

fig3
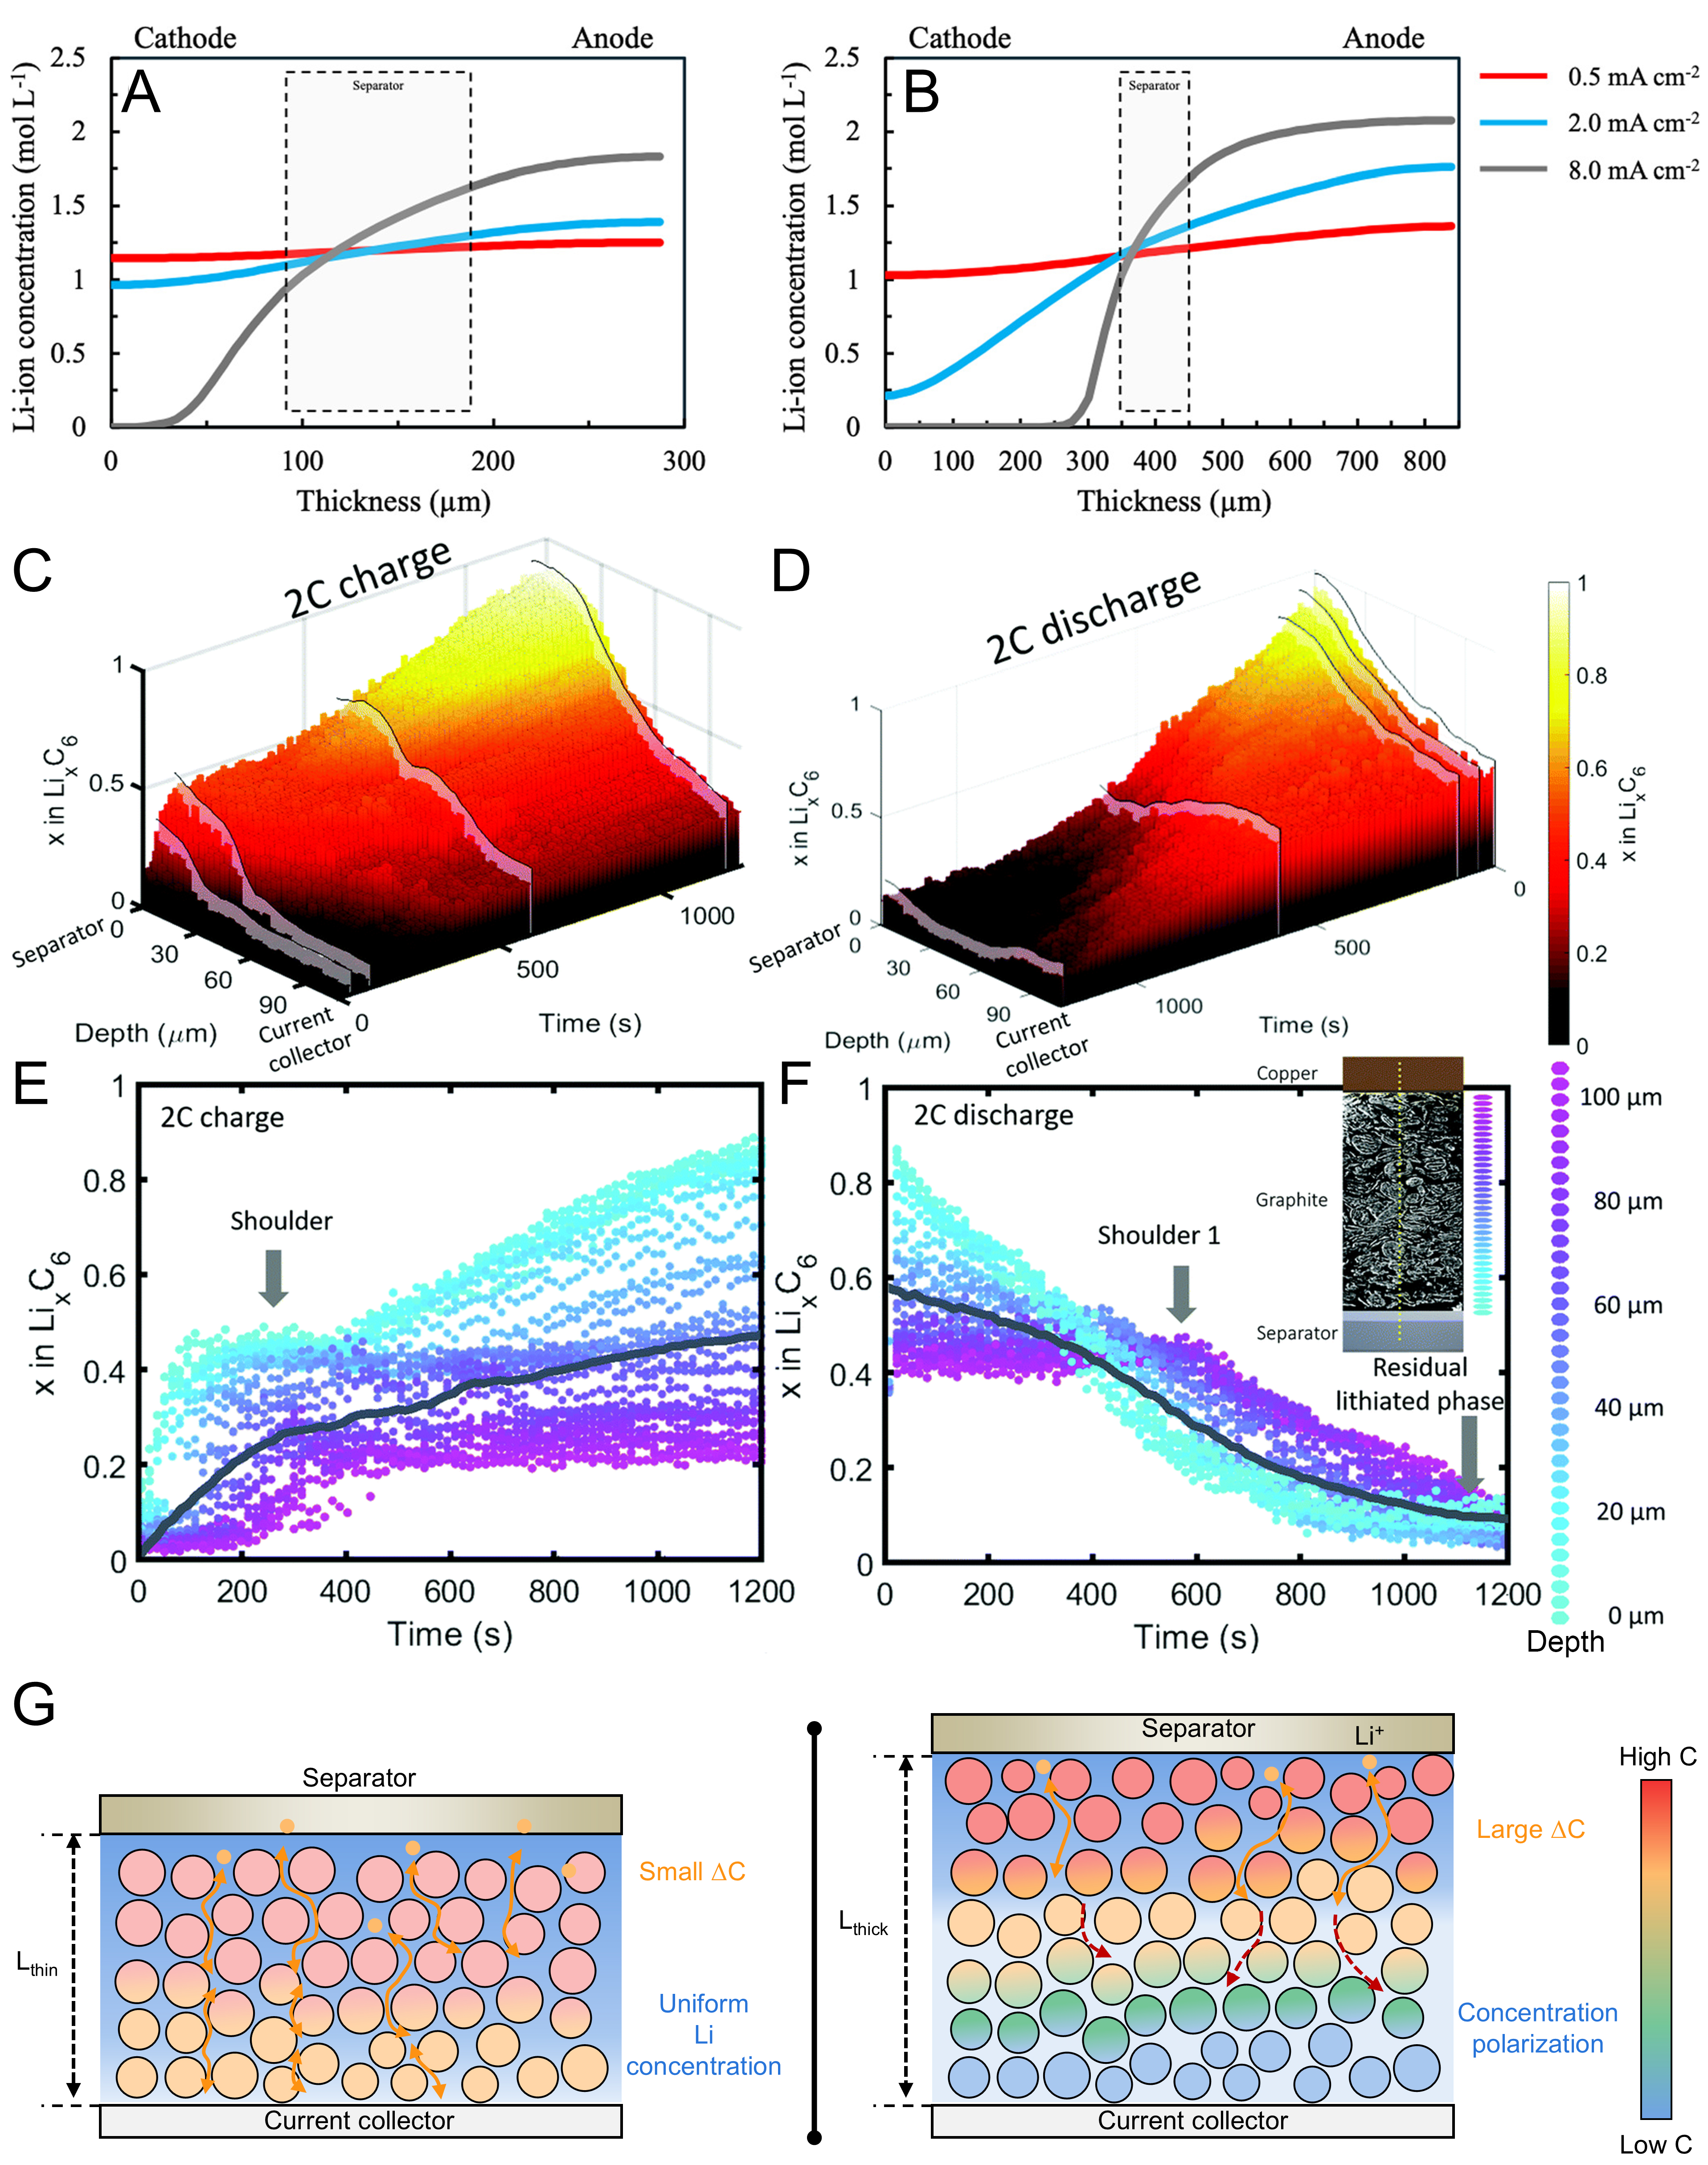
Figure 3. (A and B) Li+ concentration extracted from P2D simulations as a function of cell thickness; (A) thin and (B) thick electrodes; (A and B) are reprinted with permission from Ref.[61] under a CC BY 4.0 license; (C-F) 3D and scatter plots of XRD point measurements, color-coded by depth, showing LixC6 value as a function of time and depth during 2C (C and E) charge, and (D and F) discharge; (C-F) are reprinted with permission from Ref.[62] under a CC BY 3.0 license; (G) Schematic illustration of thickness-dependent Li+ concentration gradients in thin and thick electrodes. XRD: X-ray diffraction.