

fig10
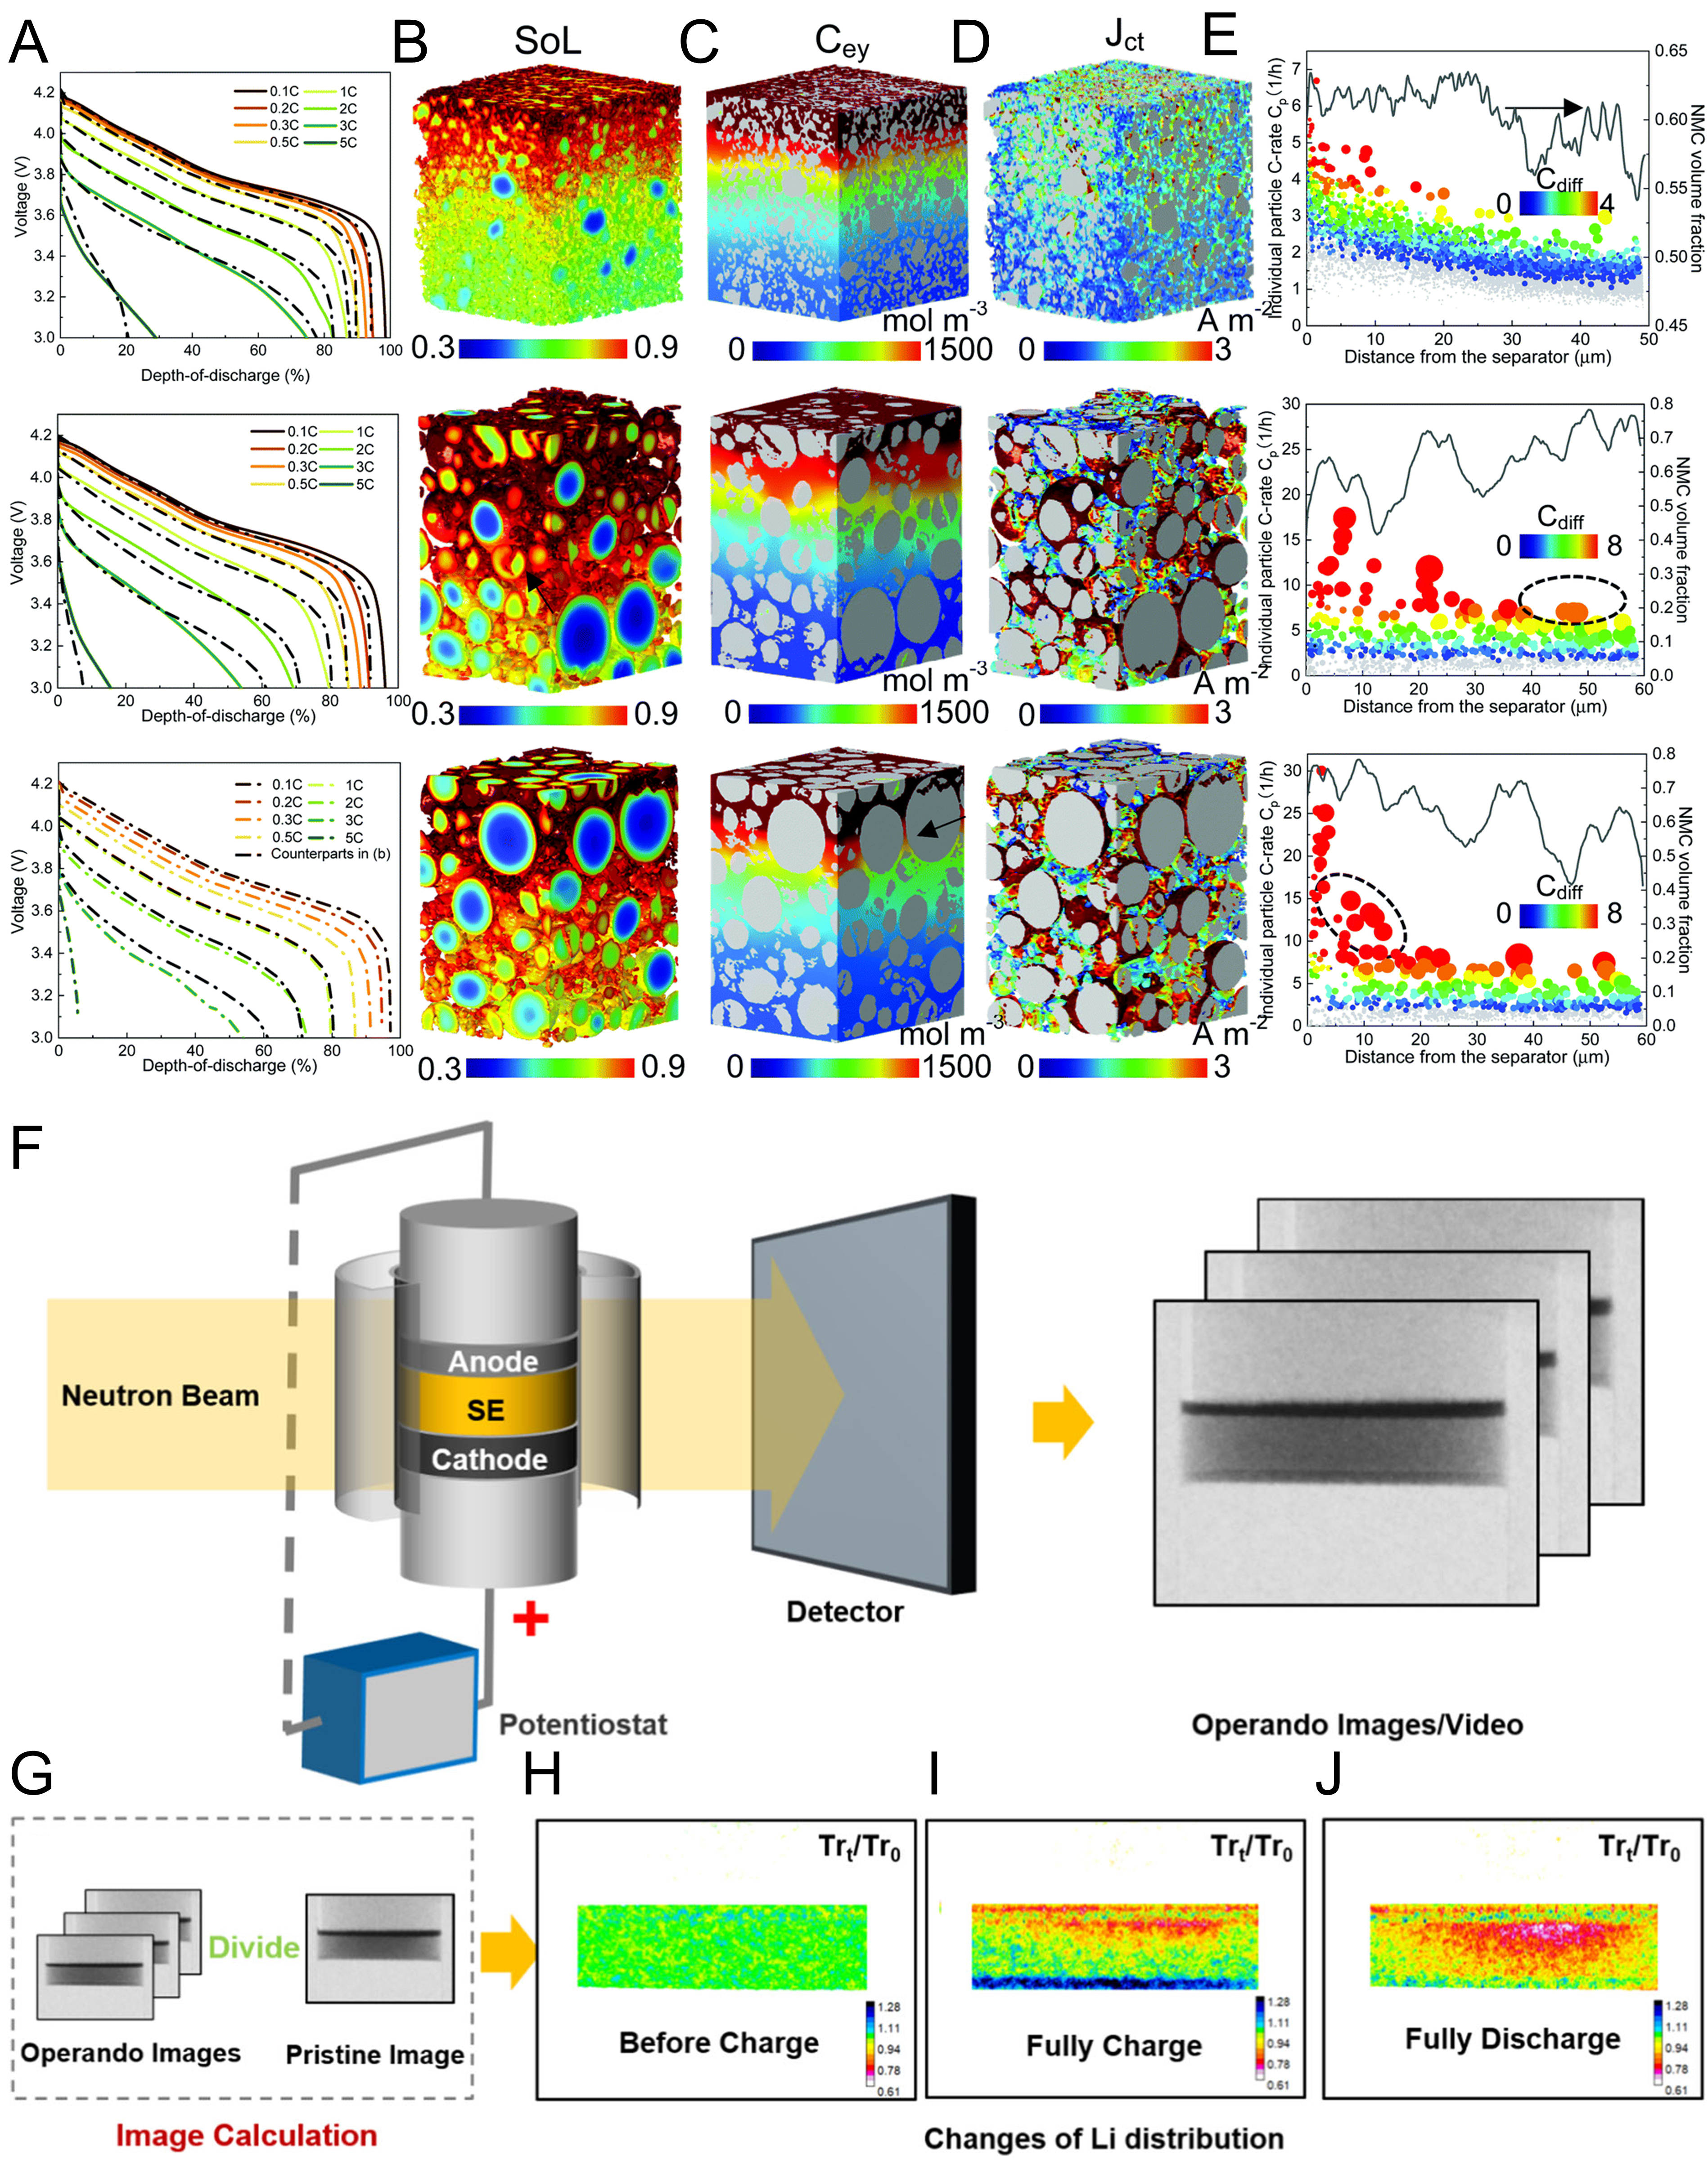
Figure 10. (A) Comparison of rate capability of SC, PC and reverse PC NCM811 electrodes by a combined analysis of experiment and modeling; (B) state of lithiation (SOL), (C) electrolyte concentration (Cey), and (D) charge-transfer current density (Jct) distribution at 65% depth of discharge (DOD); (E) actual C-rate of individual particles (Cp) shown alongside the volume fraction of the NMC particles (lines) across the electrode thickness; (A-E) are reprinted with permission from Ref.[110] under a CC BY 3.0 license; (F) schematic illustration of the experimental setup of operando neutron imaging; (G) schematic illustration of the image calculation process; (H-J) the results at different states; (H) before charge, (I) fully charged, and (J) fully discharged; (F-J) are reprinted with permission from Ref.[111], under CC BY NC-ND license. SE: Solid electrolyte; SC: single-crystal; PC: polycrystalline; NCM: nickel-cobalt-manganese; NMC: nickel-manganese-cobalt.