

fig12
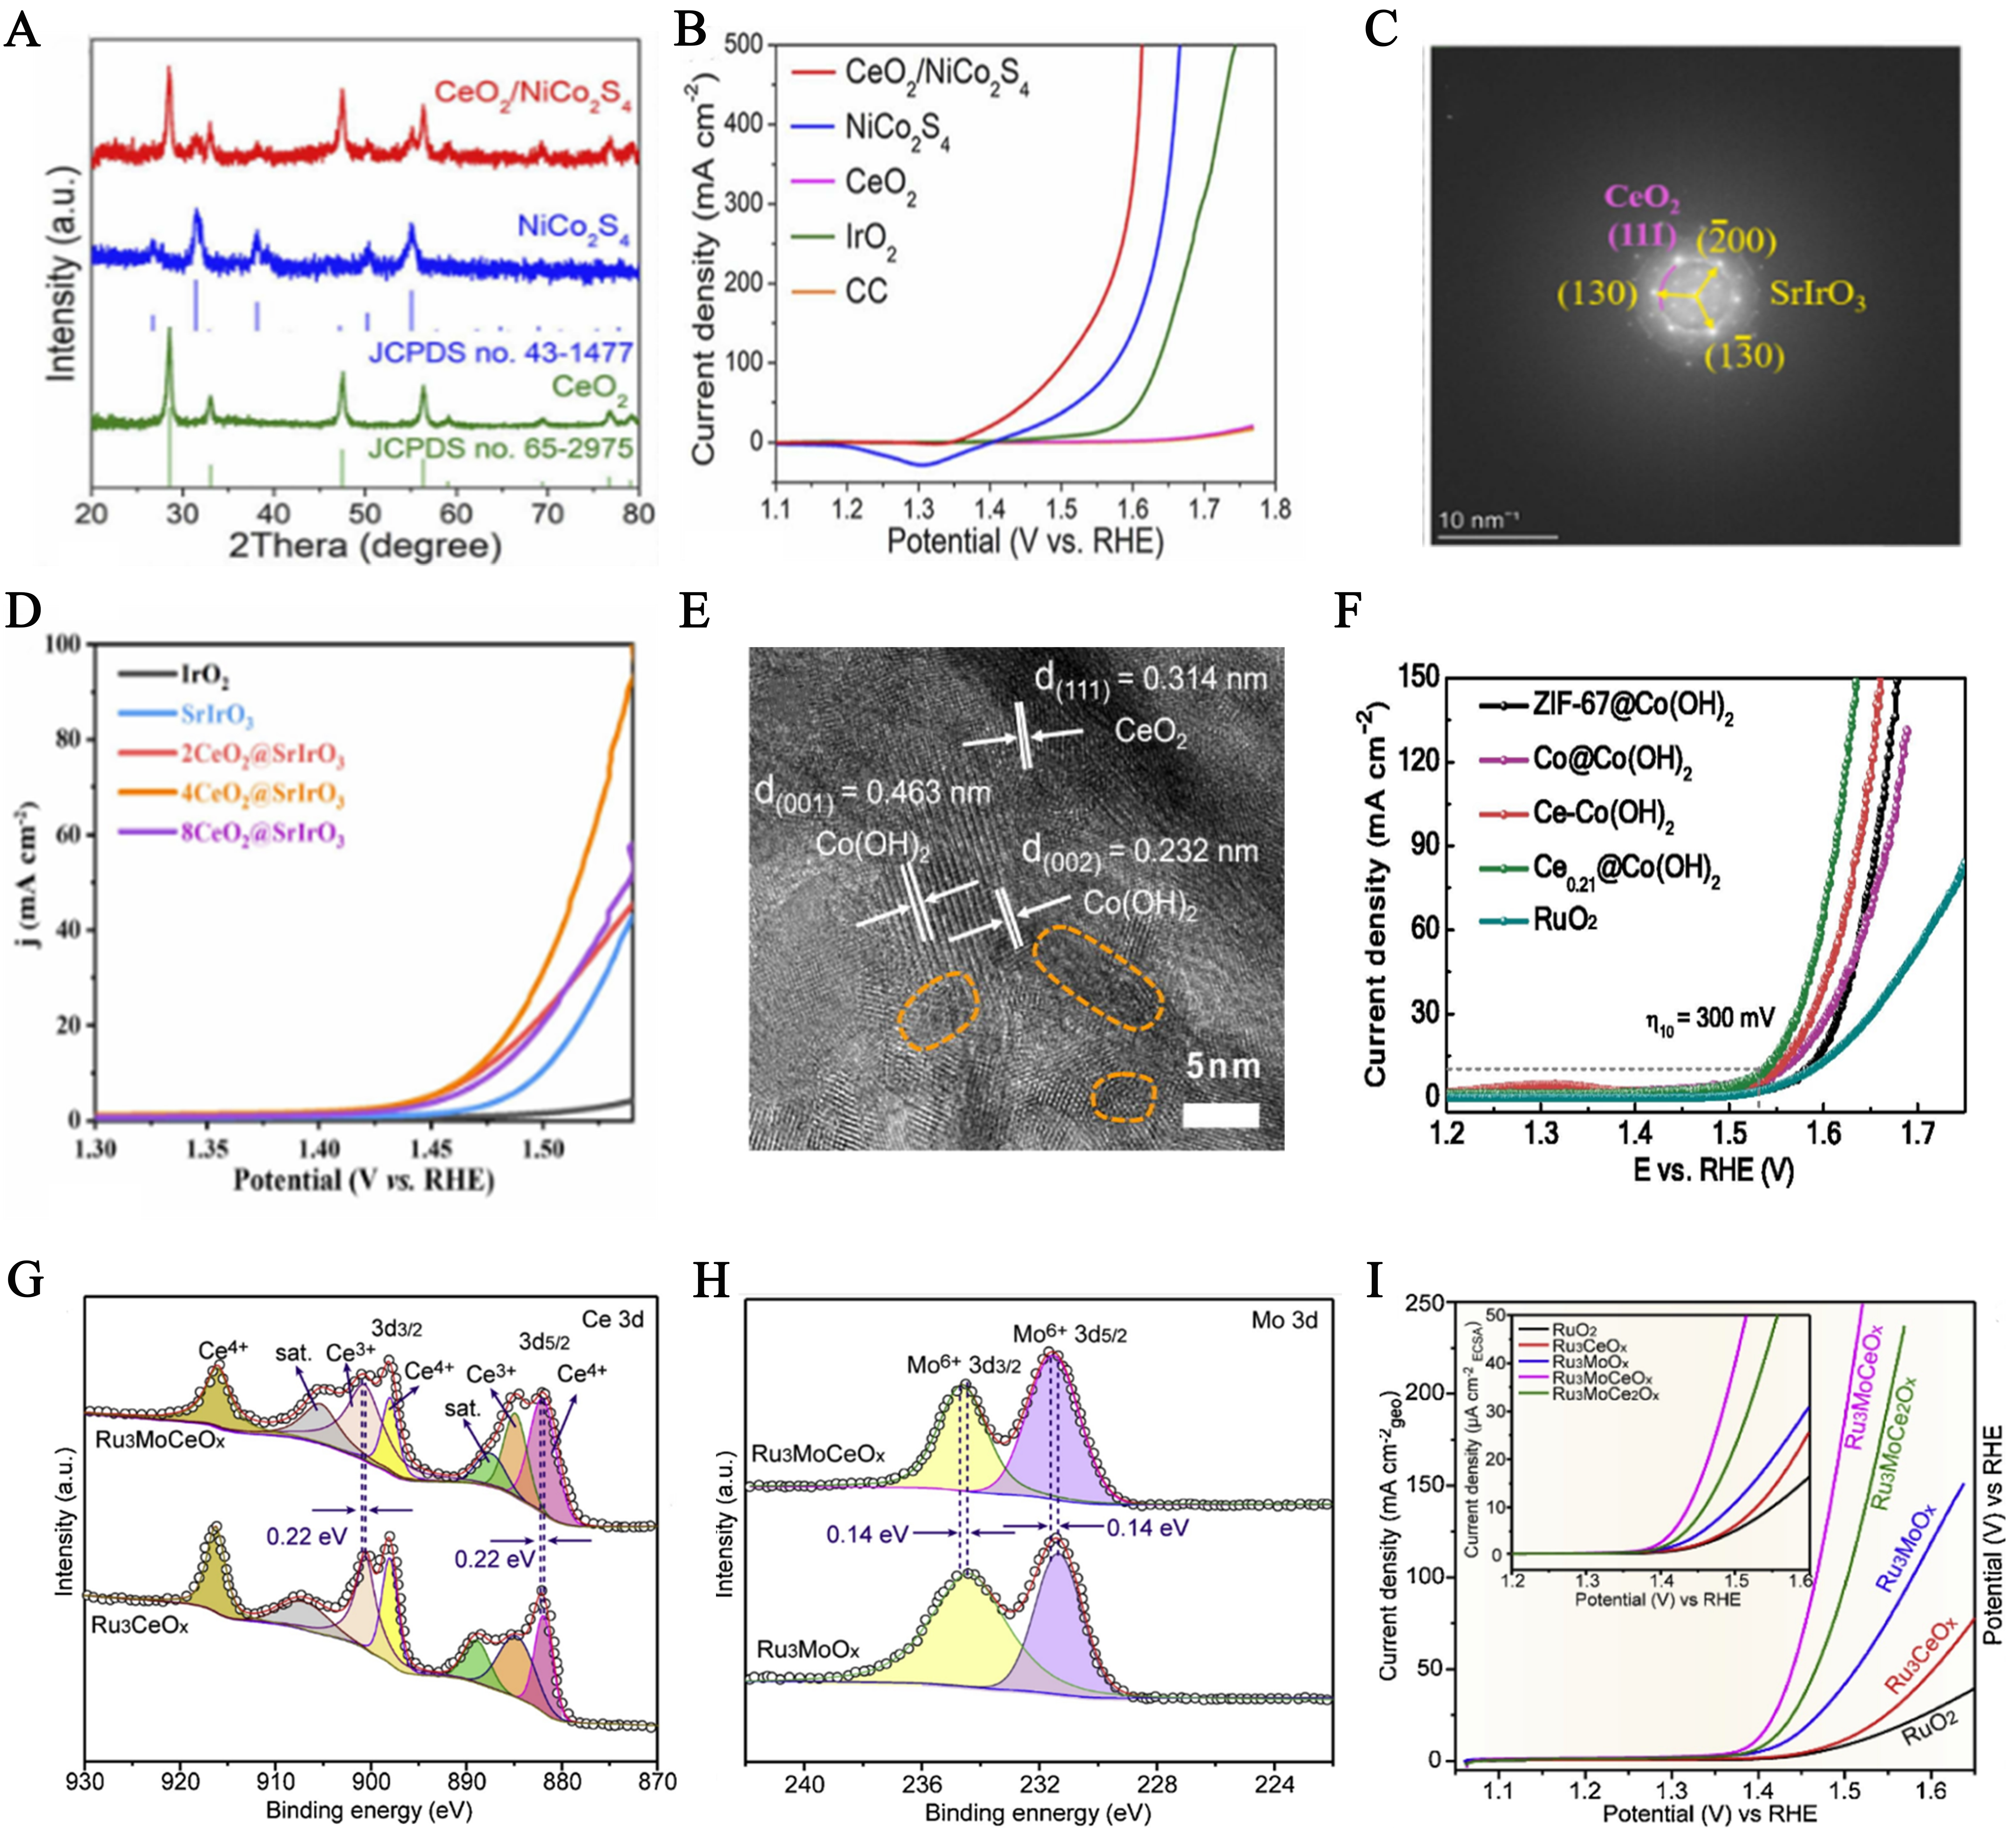
Figure 12. (A) XRD images of CeO2/NiCo2S4; (B) LSV curves of as-prepared catalysts. This figure is quoted with permission from Wang et al.[114]; (C) FFT pattern of 4CeO2@SrIrO3; (D) LSV curve of the commercial IrO2, SrIrO3, 2CeO2@SrIrO3, 4CeO2@SrIrO3 and 8CeO2@SrIrO3 electrocatalysts. This figure is quoted with permission from You et al.[22]; (E) HRTEM image, the marked area (orange line) presents the defects; (F) LSV curves of RuO2 and the prepared ZIF-67@Co(OH)2, Co@Co(OH)2, Ce-Co(OH)2 and Ce0.21@Co(OH)2 in 1.0 M KOH. This figure is quoted with permission from Zhou et al.[118]; (G) Mo 3d spectra for Ru3MoOx and Ru3MoCeOx; (H) Ce3d spectra for Ru3CeOx and Ru3MoCeOx. Erbium-based; (I) LSV curves for RuO2, Ru3CeOx, Ru3MoOx, Ru3MoCeOx, and Ru3MoCe2Ox. This figure is quoted with permission from He et al.[120]. RHE: Reversible hydrogen electrode; XRD: X-ray diffraction; LSV: linear sweep voltammetry; FFT: fast Fourier transform; HRTEM: high-resolution transmission electron microscopy; ZIF: zeolitic imidazolate framework.

