


Synergistic enhancement of lithium storage in biomass-derived hard carbon anodes via structure and phosphorus doping engineering
 0
0 
Abstract
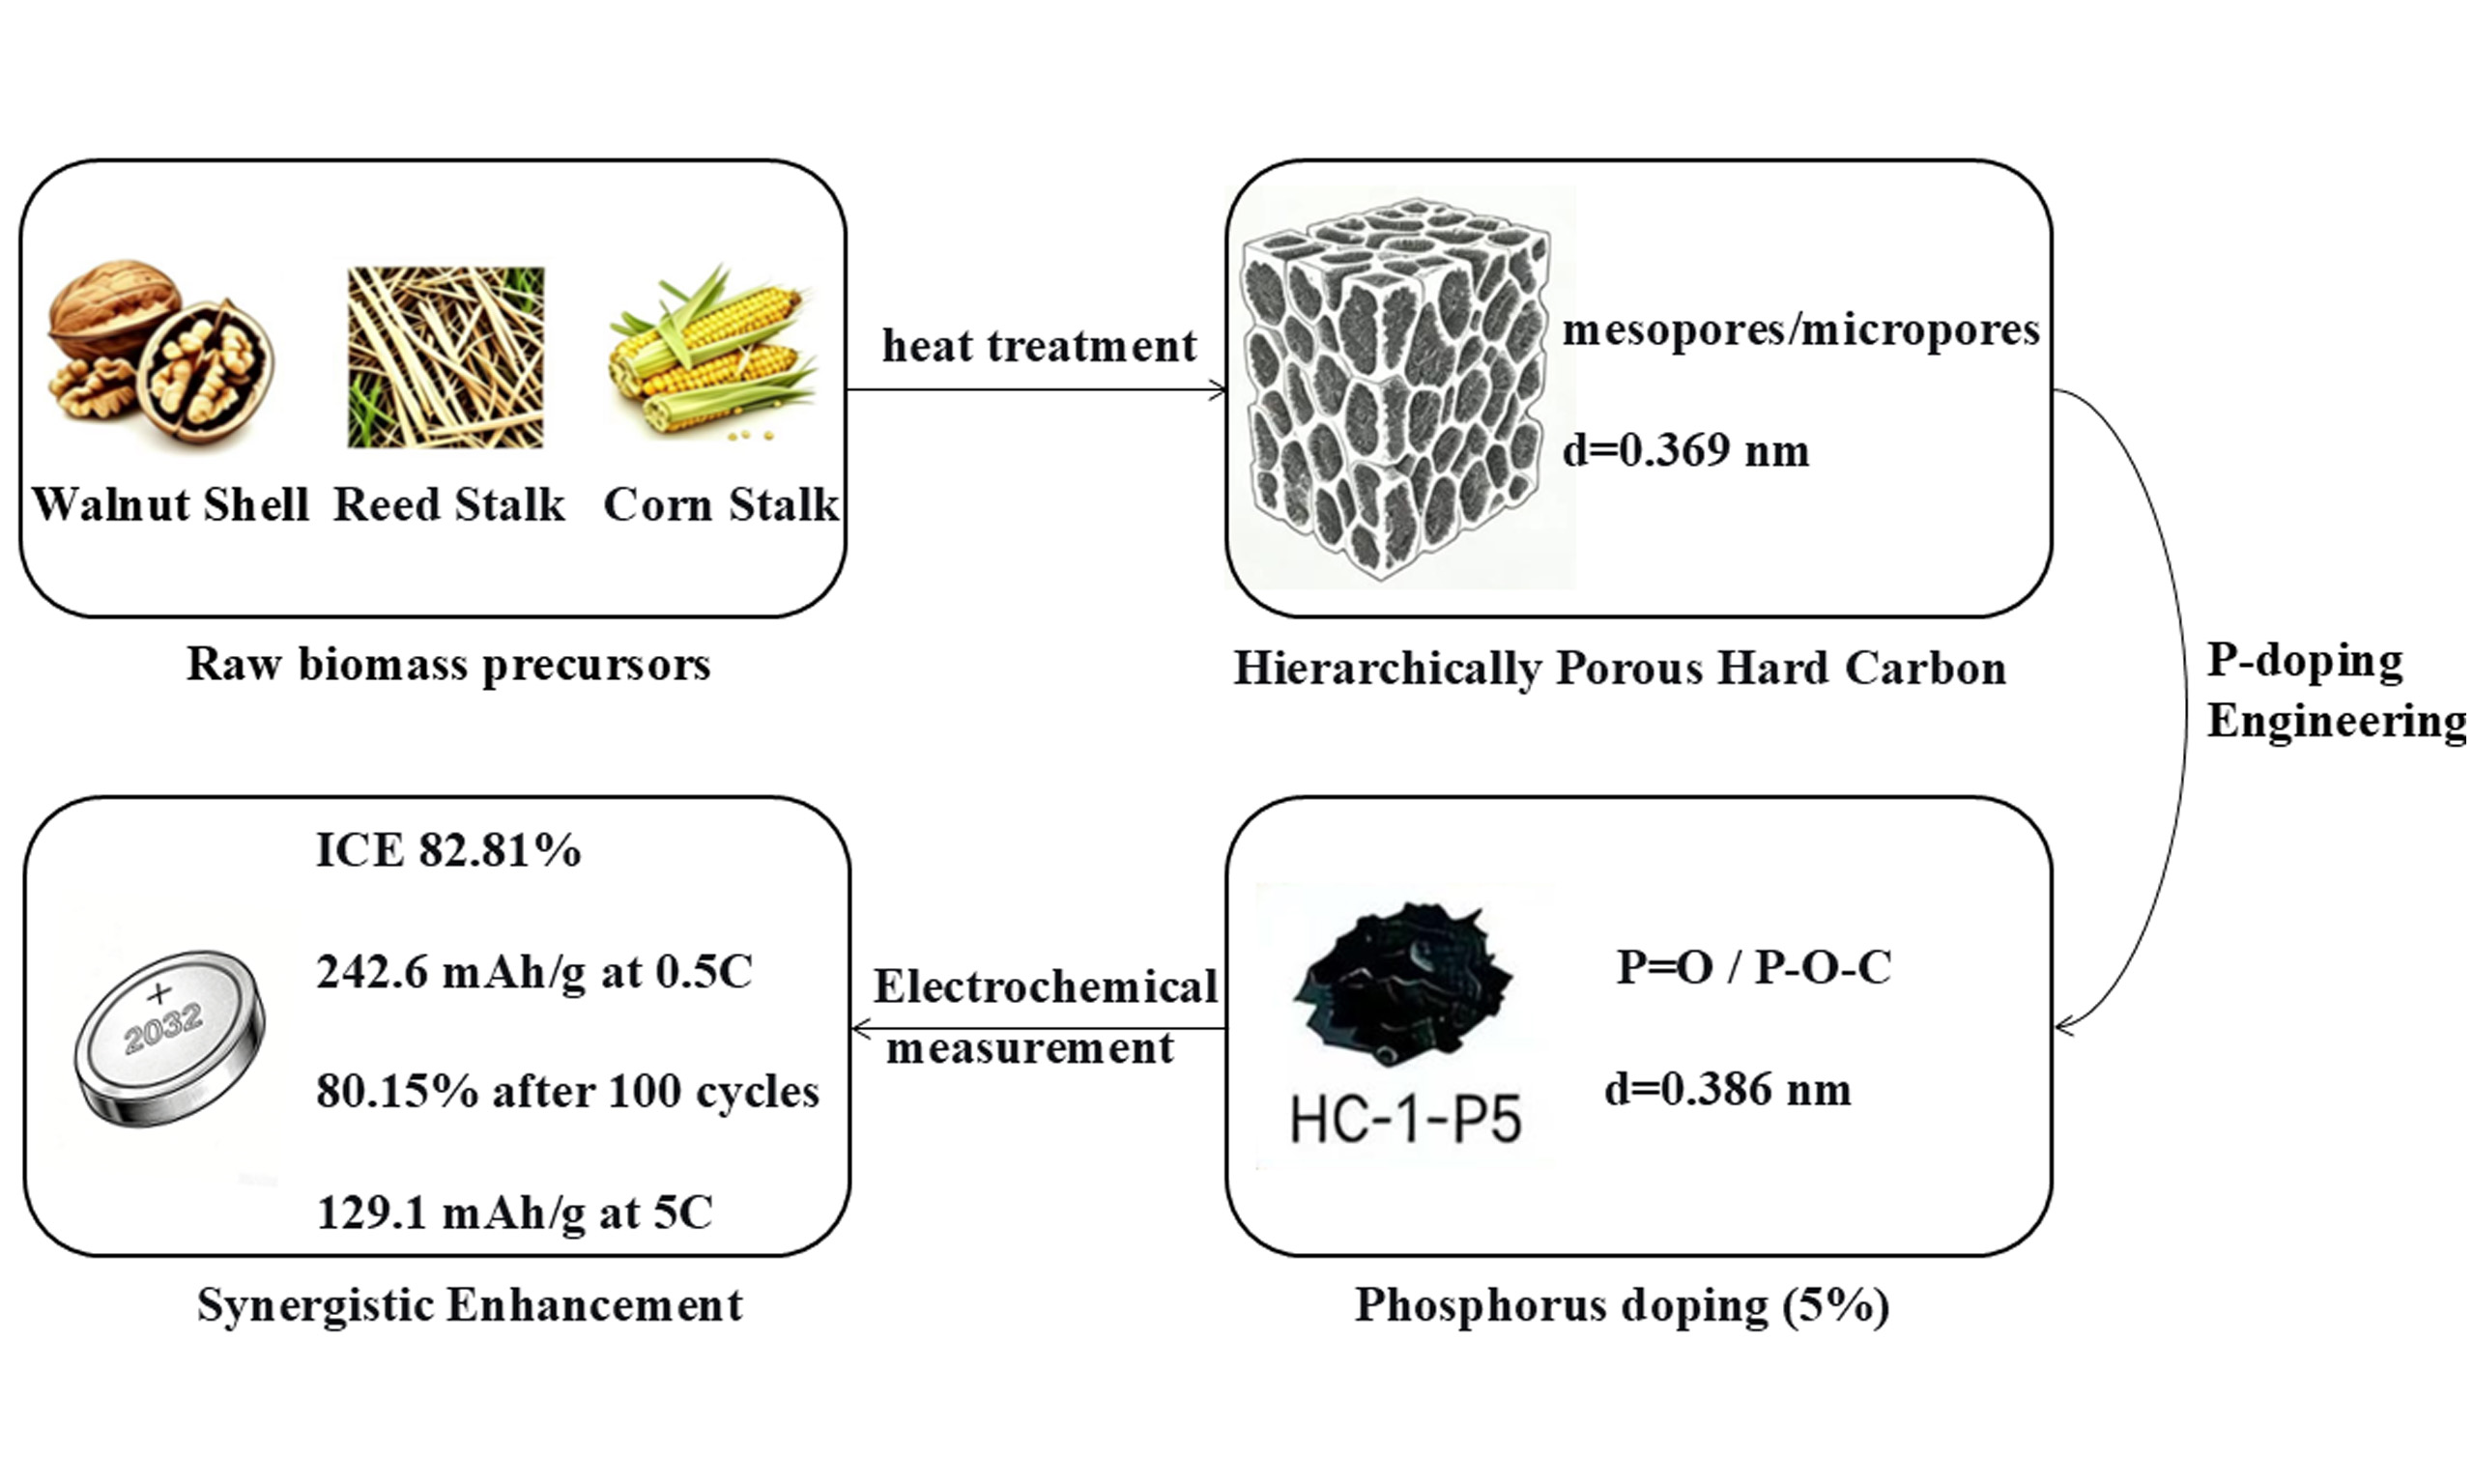
Conventional lithium-ion batteries (LIBs) anodes suffer from critical drawbacks including severe volume expansion, inferior conductivity, insufficient initial Coulombic efficiency (ICE), and limited cycling life. Biomass-based hard carbon (HC) features low cost, abundant sources, stable cyclability, and minor volume variation, making it ideal to overcome the bottlenecks of traditional anodes. In this work, hierarchical porous HC was synthesized via high-temperature pyrolysis and carbonization with walnut shells, reed stalks, and corn stalks as raw precursors. The morphology and structural properties were characterized by scanning electron microscopy (SEM), X-ray diffraction (XRD), Raman spectroscopy, and nitrogen adsorption-desorption. Electrochemical lithium storage performance was evaluated by cyclic voltammetry (CV) and constant current charge-discharge tests. Results indicate that walnut shell-derived HC shows a more ordered carbon skeleton and low impurities, improving material yield and cycling stability. Phosphorus doping enhances conductivity and electron transport, increases active sites, and reduces side reactions with electrolytes, thus boosting ICE and stability. The 5% phosphorus-doped sample exhibits excellent lithium storage performance via the triple synergistic effect of structure, interface, and electronic conductivity. At 0.5 C for 100 cycles, it delivers an ICE of 82.81%, reversible capacity of 242.6 mA h g-1, and capacity retention of 80.15%. Even at 1.86 A g-1, a rate capability of 129.1 mA h g-1 is achieved. These findings provide a feasible route for constructing advanced hard carbon HC electrodes with superior lithium-storage capability.
Keywords
INTRODUCTION
Lithium-ion batteries (LIBs) serve as dominant power sources for portable electronics, electric vehicles, and stationary energy storage systems[1]. As a core component, anode materials play a decisive role in the energy density, cycling durability, and safety performance of LIBs. Commercial graphite anodes are restricted by a relatively low theoretical capacity (372 mA h g-1) and slow reaction kinetics at high rates, prompting the search for alternative materials with higher capacity and better rate performance[2].
Biomass-derived hard carbons (HCs) have gained extensive research interest as promising anode candidates for LIBs due to their disordered graphitic structure, large interlayer spacing (favorable for Li+ intercalation), low cost, and environmental sustainability[3]. Unlike graphite, HCs exhibit a sloping voltage profile below
Recent investigations demonstrate that the electrochemical behaviors of biomass HCs are highly dependent on precursor species and preparation parameters. For instance, Wang et al. reported HC from mangosteen shells with a reversible capacity of 330 mA h g-1[5]. Moreover, heteroatom doping (e.g., N, S, P) has been widely employed to modify the electronic structure and surface chemistry of carbon materials, enhancing their Li+ storage capacity and kinetics[6]. Nevertheless, a systematic study correlating precursor characteristics, pore structure, and doping effects for LIB anodes remains scarce. In this work, we intentionally selected three representative biomass precursors - walnut shells, reed stalks, and corn stalks-based on their distinct lignocellulosic compositions to investigate the precursor-structure-performance relationship.
This work proposes a dual-modification strategy integrating structural regulation and phosphorus doping engineering to synergistically enhance the Li+ storage performance. We first compared the structural and electrochemical properties of HCs derived from three biomass sources, identifying walnut shells as the optimal precursor due to their high lignin content and ordered pore structure. Subsequently, we doped the walnut shell-derived HC with phosphorus at different levels (5, 10, 15 wt.%) to optimize its electronic conductivity and surface activity. The as-obtained HC-1-P5 sample presents remarkably enhanced initial Coulombic efficiency, rate response, and cycling durability, which fully validates the feasibility of our combined structural and doping regulation scheme. This work not only offers a competitive biomass HC anode but also delivers useful guidance for the rational construction of biomass-based carbon electrodes toward advanced energy storage.
EXPERIMENTAL
Material synthesis
Three biomass precursors were chosen according to their unique lignocellulosic components: walnut shells (high lignin content, ~45%-50%), reed stalks (high cellulose content, ~40%-45%), and corn stalks (balanced cellulose-hemicellulose-lignin ratio). These differences are expected to influence the carbonization behavior and final pore structure of the derived HCs[7]. This study utilized low-cost walnut shells, reed stalks, and corn stalks as precursors to conduct an analysis of their structural compositions. The samples prior to carbonization were denoted as OHC-1, OHC-2, and OHC-3. In total, 20 g of walnut shell, reed stalk, and corn stalk powders were separately loaded into alumina crucibles, which were then positioned within a tube furnace equipped with quartz tubes and sealed at the ends using plugs. The samples were[8] heated from room temperature to 500 °C at 1 °C min-1 and kept for 1 h, then further increased to 900 °C at 5 °C min-1 and maintained for 2 h. Upon cooling down naturally, the products were washed sequentially using dilute HCl and deionized water to eliminate soluble ash and residual impurities, after which they were designated as HC-1, HC-2, and HC-3. Among these, the walnut shell-derived HC anode with superior electrochemical properties was chosen for further modification[8]. Phosphoric acid was added as the phosphorus source at nominal mass ratios of 5, 10, and 15 wt% relative to walnut shell powder, corresponding to the final samples denoted as HC-1-P5, HC-1-P10, and HC-1-P15. Deionized water was introduced to obtain a uniform slurry. After water removal, the mixture was dried under vacuum at 80 °C for 8 h. The dried precursor was then transferred into an alumina crucible and heat-treated in a tube furnace with nitrogen protection. The sample was heated to 500 °C at 1 °C min-1 and held for 1 h, further heated to 900 °C at 5 °C min-1 and kept for 2 h, then cooled naturally to room temperature, finally obtaining P-doped HC anode materials. These samples were named HC-1-P5, HC-1-P10, and HC-1-P15 according to the additive amounts. The preparation route is displayed in Figure 1.
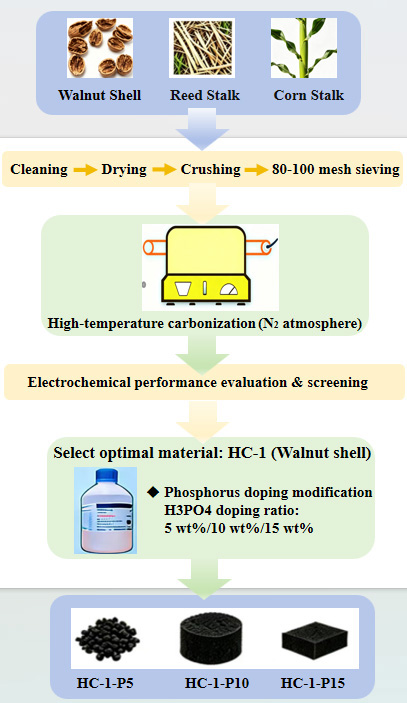
Figure 1. The schematic diagram illustrates the preparation of three hard carbon precursors and the development process of HC-1 through phosphorus doping. HC: Hard carbon.
Experimental characterization methods
Microstructural observations and elemental composition analyses were implemented by scanning electron microscopy (SEM, JEOL JSM-7500F, Japan) integrated with energy-dispersive X-ray spectroscopy (EDS). X-ray diffraction (XRD) was carried out on a Shimadzu XRD-6000 diffractometer (Shimadzu Corporation, Japan) with Cu Kα radiation (λ = 1.5406 Å), operating at 30 kV and 20 mA over a scanning range of 10° to 90° (2θ). Raman spectra were collected on a Renishaw inVia spectrometer (Renishaw plc, United Kingdom) with a 532 nm laser, covering a wavenumber window of 600-2,000 cm-1. Nitrogen adsorption-desorption isotherms were measured at 77 K using a Micromerit ASAP 2460 system (Micromeritics Instrument Corporation, USA). The specific surface area was computed via the Brunauer-Emmett-Teller (BET) approach, while the pore size distribution was determined using the density functional theory (DFT) model. Powder resistivity and electronic conductivity were measured using a GEST-126 powder resistivity tester (Guangzhou Kenuo Instrument Co., Ltd., China).
Characterization of electrochemical properties
Electrode slurries were fabricated by blending the as-prepared HC, Super P conductive agent, and carboxymethyl cellulose (CMC) binder at a weight ratio of 8:1:1 with deionized water. The slurry was cast onto a copper foil current collector via a doctor-blade coating technique, followed by vacuum drying at 80 °C for 12 h. The coating thickness of the electrode sheet was controlled at approximately 100 μm, and the areal mass loading of active material was regulated at 2.0-2.2 mg cm-2. Coin cells were assembled in an Ar-filled glove box with H2O and O2 levels below 0.1 ppm, using lithium foil as the counter and reference electrode, Celgard 2400 polypropylene as the separator, and 1 M LiPF6 dissolved in a ternary solvent of ethylene carbonate (EC), dimethyl carbonate (DMC), and diethyl carbonate (DEC) with a volume ratio of 1:1:1 as the electrolyte. All cells were rested for 24 h prior to electrochemical measurements. Galvanostatic charge-discharge tests were performed on a Land CT2001B battery test system within a voltage window of 0.01-2.5 V at current densities ranging from 0.1 C to 5 C (1 C = 372 mA g-1). Cyclic voltammetry (CV) was conducted on a CHI660E electrochemical workstation at scan rates between 0.1 and 2.0 mV s-1. Electrochemical impedance spectroscopy (EIS) was recorded over a frequency range of 0.01 Hz to 100 kHz with a 5 mV amplitude, and the impedance spectra were fitted with an equivalent circuit using ZView software.
RESULTS AND DISCUSSION
This study employs multidimensional characterization methods to deeply analyze the microstructural characteristics of HCs derived from different biomass precursors[9]. The XRD pattern [Figure 2A] indicate that all samples display typical features of amorphous carbon, with broadened (002) and (100) diffraction peaks at 2θ ≈ 24° and 43°, respectively. It should be noted that HC-2 exhibits several sharp diffraction peaks in addition to the characteristic peaks of amorphous carbon, which are ascribed to inorganic mineral impurities in reed stalks that are difficult to eliminate completely via acid washing. These impurities may affect structural stability and electrochemical properties. Interlayer spacing values calculated by the Bragg equation demonstrate the effect of precursor composition on carbonization behavior[10]:
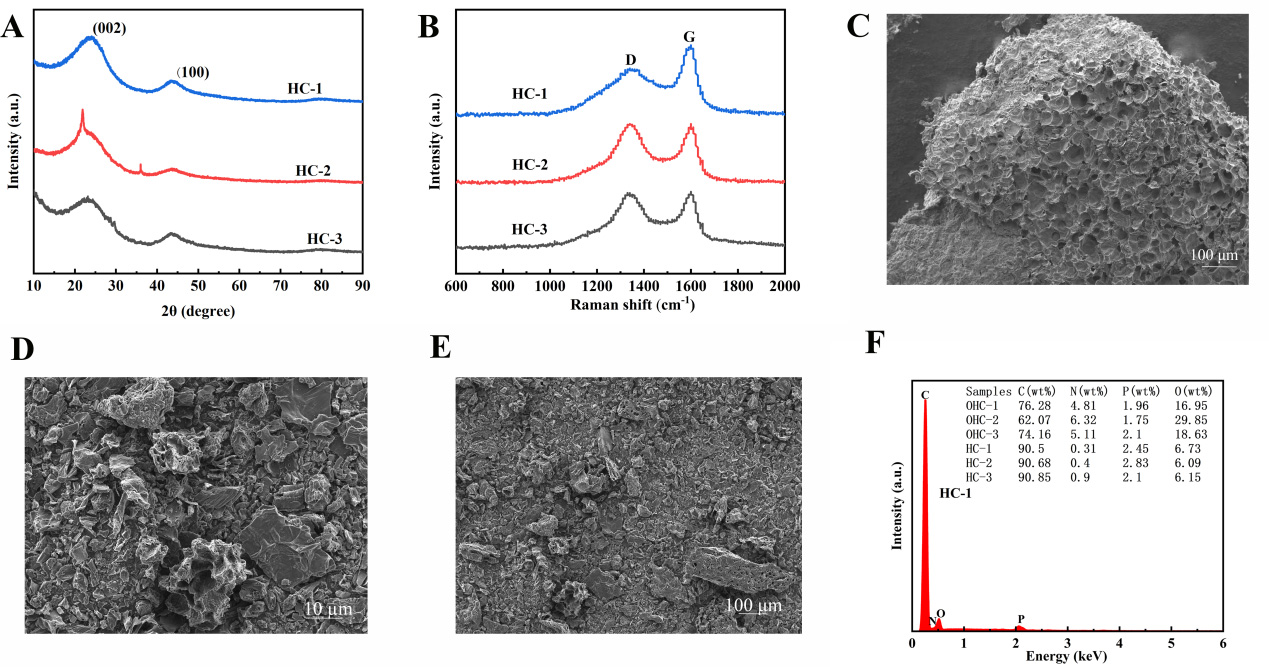
Figure 2. (A) XRD pattern, (B) Raman spectra, (C) SEM images of OHC-1; (D and E) SEM images of HC-1 at different magnifications and (F) EDS image of HC-1. XRD: X-ray diffraction; SEM: scanning electron microscopy; EDS: energy-dispersive X-ray spectroscopy.
Where n is the diffraction order, λ is the wavelength of X-ray, d is the interplanar spacing, and θ is the diffraction angle.
The d002 values for HC derived from walnut shells (HC-1), reed stalks (HC-2), and corn stalks (HC-3) are 0.369 nm, 0.405 nm, and 0.384 nm, respectively. Compared to the standard interlayer spacing of graphite (0.335 nm), the expanded interlayer spacing of HC materials provides favorable structural conditions for lithium ion transport[11].
It is noteworthy that the difference in interlayer spacing is negatively correlated with the lignin content of the biomass precursor[12]. Walnut shells are rich in lignin (about 45%-50%), and their aromatic ring structure and cross-linking network tend to form a relatively ordered carbon layer arrangement during carbonization, characterized by smaller interlayer spacing and higher structural density. Conversely, the higher cellulose and hemicellulose content in reed stalks and corn stalks produces more volatile components during pyrolysis, leading to a more loosely arranged carbon layer and increased interlayer spacing[13].
Further insight from Raman spectroscopic characterization [Figure 2B] verified the distinct structural ordering among samples[14]. All specimens displayed typical Raman features at approximately 1,350 cm-1 (D band) and 1,580 cm-1 (G band). The D-band intensity primarily reflects structural imperfections, edge locations, heteroatom doping, and disordered domains within the carbon matrix, whereas the G band arises from in-plane vibrations of sp2-hybridized carbon atoms[15]. The ID/IG ratio, a key metric for evaluating graphitization degree, showed a strong dependence on biomass precursor: the ratio was 0.88 for HC-1, 0.99 for HC-2, and 0.98 for HC-3.
A deeper analysis revealed that the full width at half maximum (FWHM) and peak shift of the D and G bands also contained rich structural information. The G band of HC-1 is located at 1,582 cm-1 with an FWHM of 45 cm-1; whereas the G bands of HC-2 and HC-3 shift to lower frequencies at 1,578 and 1,576 cm-1 respectively, with the FWHM expanding to 52 and 55 cm-1. The low-frequency shift and broadening of the G band are generally associated with the decrease in graphite crystallite size and the increase in structural disorder. The graphite crystallite sizes La calculated using the Tuinstra-Koenig relationship are as follows:
Where La is the graphite crystallite size and ID/IG is the intensity ratio of D band to G band.
The obtained values are 5.3 nm for HC-1, 4.4 nm for HC-2, and 4.5 nm for HC-3. This result is consistent with the XRD data, confirming that the walnut shell-derived HC has a more perfect graphite crystallite structure.
SEM observations unveiled the structural evolution patterns during the carbonization process [Figure 2C-E]. The original structure of walnut shells exhibited a highly ordered honeycomb-like porous configuration with uniform pore wall thickness (approximately 5-10 μm). This natural template structure demonstrated remarkable stability during high-temperature carbonization[16]. After carbonization, HC-1 retained its original pore network intact, with the pore walls transforming into continuous and dense carbon layers. Simultaneously, due to the volatilization of organic components, a rich microporous structure (1-2 nm) was formed within the carbon framework.
The design of this macroporous-mesoporous-microporous hierarchical pore structure possesses multiple physicochemical advantages: macropores (> 50 nm) serve as the main conduits for ion transport, shortening the diffusion distance of lithium ions[17]; mesopores (2-50 nm) provide ample storage space for the electrolyte, ensuring uniformity in electrode reactions; micropores gives rise to a high specific surface area and plentiful reactive sites, serving as the primary source of lithium storage capacity. In contrast, HCs derived from reed stalks and corn stalks undergo more intense structural reorganization during the carbonization process. The thin-walled structure of reed stalks (with a wall thickness of 1-3 μm) is prone to collapse under thermal stress, forming discontinuous carbon layers and numerous structural defects [Supplementary Figure 1A-C]. Although the fiber bundle structure of corn stalks is partially retained, the weak van der Waals forces between fibers are insufficient to maintain structural integrity at high temperatures, leading to significant structural fractures after carbonization [Supplementary Figure 2A-C].
Elemental composition and distribution evolution during carbonization were systematically identified by EDS [Figure 2F, Supplementary Figures 1D and 2D]. All samples exhibited a trend of carbon enrichment and reduction in oxygen and nitrogen elements after high-temperature treatment[18]. The O/C atomic ratio of HC-1 is very low, which is only 0.074, indicating that its surface contained relatively fewer oxygen-containing functional groups. Although these oxygen-containing groups can provide additional pseudocapacitance contribution, they can also undergo irreversible side reactions with electrolyte components, consuming active lithium ions and reducing ICE.
The nitrogen adsorption test results [Supplementary Figure 3 and Supplementary Table 1] provide a quantitative characterization of the pore structure. HC-1 exhibited a BET specific surface area of
Notably, a subtle trade-off can be observed between the specific surface area and ICE. Although HC-3 has the highest specific surface area (656.91 m2 g-1), its ICE is only 52.2%, which is lower than that of HC-1, which is 77.3%. This phenomenon can be explained from the perspective of interfacial chemistry: an excessively large specific surface area means more active surfaces exposed to the electrolyte, aggravating electrolyte decomposition and facilitating the generation of solid electrolyte interphase (SEI) film, consuming a large amount of irreversible lithium sources. Our research indicates that for HC anode materials, controlling the BET specific surface area within the range of 400-500 m2 g-1 while achieving an optimized distribution of pore size is a key design principle for balancing high ICE and high reversible capacity.
Figure 3A displays the CV profiles of HC materials derived from three distinct precursors at a scan rate of
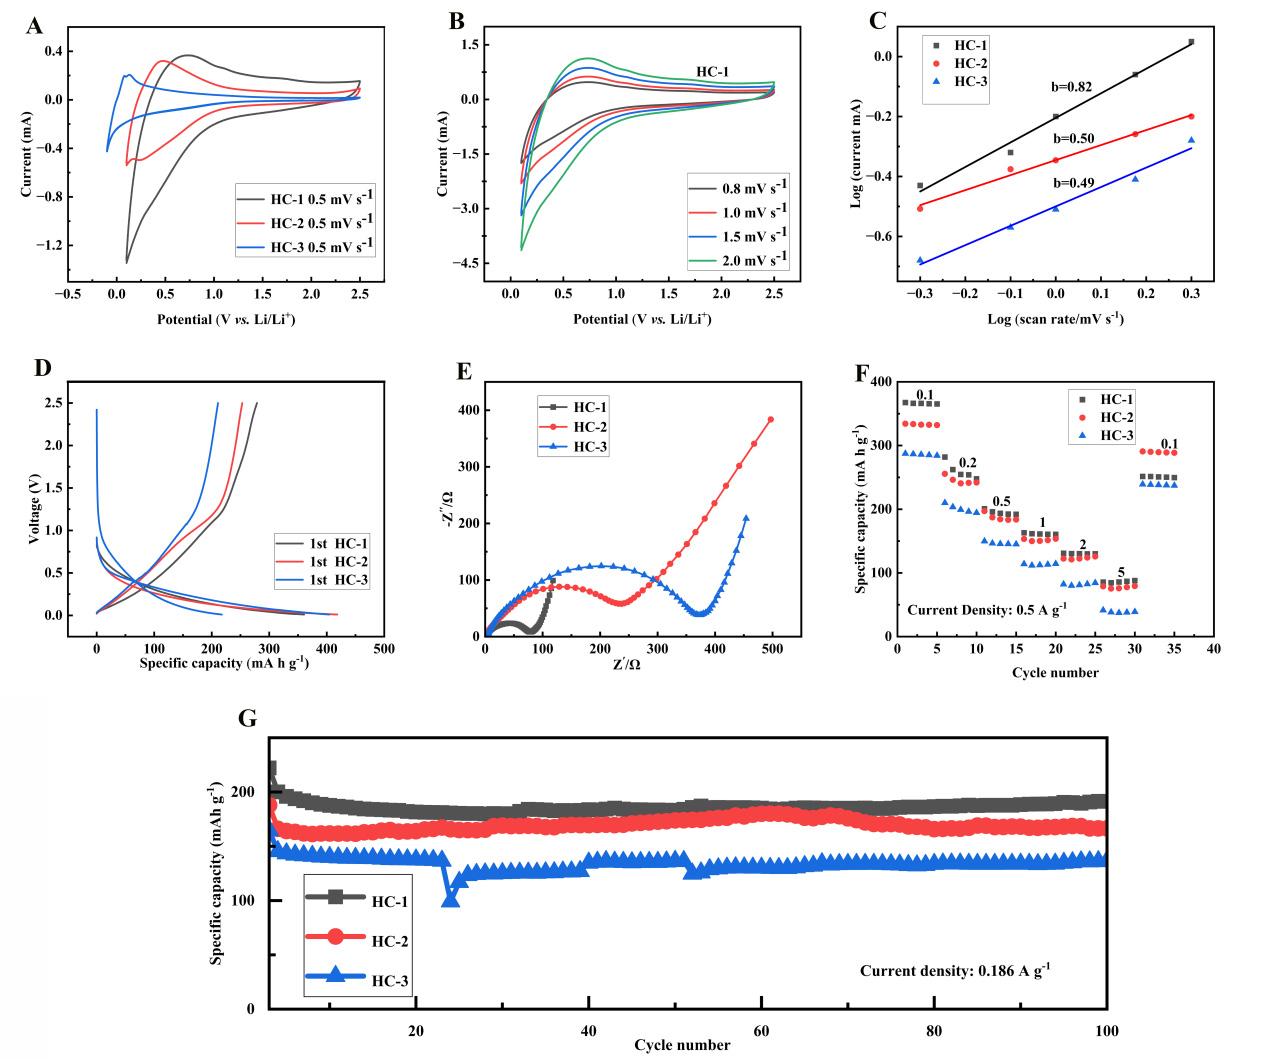
Figure 3. (A) CV curves, (B) CV curves of HC-1 at different rates; (C) linear fitting curves of the CV curves; (D) the initial galvanostatic charge-discharge profiles of the three samples at a current density of 37.2 mA g-1; (E) Nyquist Impedance plots, (F) Rate performance and (G) cycling stability (current density = 0.186 A g-1). CV: Cyclic voltammetry; HC: hard carbon.
The HC-1 electrode showed the highest peak current density (cathode peak: -0.85 mA cm2, anode peak:
From the analysis of peak shape characteristics, the CV curve of HC-1 exhibits a more symmetrical peak shape and steeper peak edges, indicating that its electrochemical process is less controlled by diffusion and the interfacial reaction rate is faster[21]. In contrast, HC-3 has a widened peak shape and lower peak current density, indicating limited electrochemical active sites and significant electrochemical polarization.
As depicted in Figure 3B, the CV profiles of HC-1 were recorded at various scan rates from 0.5 mV s-1 to
Where ip is the peak current, n is the electron transfer number, A is the electrode area, D is the Li+ diffusion coefficient, C is the Li+ concentration, and v is the scan rate.
The peak current is proportional to the square root of the scan rate. Linear fitting results demonstrated that the plot of ip versus v1/2 for HC-1 presented excellent linearity, (R2 = 0.998), revealing that the Li+ intercalation/deintercalation behavior was dominated by diffusion-controlled kinetics. CV curves of HC-2 and HC-3 at varied scan rates are presented in Supplementary Figure 4A and B, respectively. Analogous to HC-1, the redox peak currents of HC-2 and HC-3 also increased with elevated scan rates. Nevertheless, the current increment was notably smaller than that of HC-1, and the CV profiles exhibited more severe broadening and potential deviation at higher scan speeds. This observation directly suggests that the Li+ insertion/extraction processes in HC-2 and HC-3 suffer from more serious diffusion restrictions and larger polarization effects.
According to the calculated apparent diffusion coefficient (Dapp), HC-1 presents a Li+ diffusion coefficient of 2.3 × 10⁻¹² cm2 s-1, which is 1.64‐fold and 2.64‐fold higher than those of HC-2 (1.4 × 10⁻¹² cm2 s-1) and HC-3 (8.7 × 10⁻¹³ cm2 s-1), respectively. Such outstanding ion transport capability stems from the distinctive hierarchical porous architecture of HC-1, which provides multidimensional and fast transport channels for lithium ions.
Figure 3C provides a detailed analysis of the charge storage mechanisms of the three materials through log (i) - log (v) linear fitting. According to the equation:
Where i is the current, v is the scan rate, b is the kinetic control factor, and a is a constant.
The slope b reflects the control mechanism of charge storage: when b ≈ 0.5, the process is controlled by diffusion (dominated by embedding/extraction mechanism); When b ≈ 1.0, the process is controlled by capacitance (surface adsorption/desorption dominant). The b-values of HC-1, HC-2, and HC-3 are 0.82,
This result reveals important differences in charge storage mechanisms: the higher b-value (0.82) of HC-1 indicates a higher proportion of capacitance contribution in its charge storage process[22].This is closely associated with its higher specific surface area and rich surface active sites. On the basis of the Dunn method, the capacitance contribution was quantitatively calculated. At a scan rate of 0.5 mV s-1, the capacitive ratio of HC-1 reached 55%, whereas those of HC-2 and HC-3 were 45% and 40%, respectively.
The difference in capacitance contribution can be explained from the perspective of material pore structure and surface chemistry. The optimized microporous mesoporous bimodal distribution (1.5 and 3.5 nm) of HC-1 provides sufficient effective surface area for double-layer capacitance, while its moderate surface oxygen-containing functional groups contribute to Faraday pseudocapacitance. In contrast, although HC-3 has a larger specific surface area, its pore size distribution is wider, and the accessibility of some micropores (< 1 nm) is poor, which limits its contribution to capacitance.
Of particular note, the variation in the b-value with scan rate also provides critical kinetic information. At low scan rates (0.1-0.5 mV s-1), the b-values of all samples approach 0.5, suggesting that the reaction is diffusion-controlled. As the scan rate rises to 1.0-2.0 mV s-1, the b-value of HC-1 remains stable at approximately 0.82, whereas that of HC-3 drops to 0.49. This result demonstrates that HC-1 can retain a high capacitive contribution even at high rates, accounting for its superior rate capability.
Figure 3D displays the initial galvanostatic charge-discharge curves of the three samples tested at 0.1 C. All curves display typical HC. behavior: a sloping region between 0.1-1.0 V and a plateau region between 0.01-0.1 V. The sloping region corresponds to Li+ adsorption-desorption at defect sites, edge locations, and surface functional groups, while the plateau region is ascribed to Li+ insertion and extraction within graphite microcrystallites[23].
HC-1 exhibits the longest platform area, with platform capacity accounting for 58% of the total capacity, which is higher than HC-2 (52%) and HC-3 (48%).The distinction in plateau capacity directly reveals the quality of the graphite microcrystalline structure within the material. Based on the thermodynamic principles of lithium-ion insertion, the platform region corresponds to the ordered arrangement of lithium ions between graphite layers, requiring a complete graphite microcrystalline structure as the main body. The larger microcrystalline size (Lc = 1.85 nm) and higher degree of graphitization (ID/IG = 0.88) of HC-1 provide sufficient and ordered embedding sites[24].
The difference in ICE is particularly significant: HC-1 is 77.3%, HC-2 is 60.5%, and HC-3 is 52.2%. The losses of ICE mainly stem from irreversible capacity, including SEI film formation, electrolyte decomposition, and capture of lithium ions at irreversible sites. By comparing the charge-discharge profiles of the first and second cycles [Supplementary Figure 4C], the irreversible capacity of HC-1 is found to appear mainly in the voltage window of 0.5-1.5 V, which is closely associated with the reduction of oxygen-containing functional groups. The low O/C atomic ratio (0.074) of HC-1 effectively suppresses the amount of surface oxygen groups, thus decreasing the irreversible capacity loss.
From the thermodynamic standpoint, the voltage gap shown in galvanostatic charge -discharge profiles mirrors the irreversible nature of electrode electrochemical reactions. The charge-discharge curve of HC-1 almost overlaps in the plateau region, with a voltage lag of only 25 mV, while the voltage lag of HC-3 reaches 85 mV. A smaller voltage lag means lower energy loss and higher energy efficiency, which is of great significance in practical battery design[25].
Figure 3E shows the EIS Nyquist plots of three materials after 10 cycles. All spectra exhibit typical semi-circular oblique features: in EIS spectra, the semicircle at high frequencies (104-102 Hz) is assigned to the charge transfer behavior at the electrode-electrolyte interface. The intermediate-frequency response (102-100 Hz) reflects the characteristics of the SEI layer, while the straight line in the low-frequency range (100-10-2 Hz) represents lithium-ion diffusion within the bulk electrode material[26].
The semicircle diameter in Nyquist plots can be used to compare the magnitude of charge transfer resistance. Among all samples, HC-1 presents the smallest semicircle, demonstrating its optimal charge transfer capability with the lowest resistance value. By reading the intercept of the high-frequency semicircle on the real axis, the charge transfer resistance of HC-1 is estimated to be approximately 48 Ω. This value is lower than those of HC-2 (85 Ω) and HC-3 (112 Ω). It should be emphasized that EIS characterizes the overall impedance of the coin cell, including electrode-electrolyte interface, SEI film, electrolyte, and contact resistance, rather than the intrinsic electronic conductivity of the carbon powder. To verify the intrinsic conductivity, powder electronic conductivity measurements were performed. We measured the conductivity of HC-1, HC-2, and HC-3 to be 3.28 S m-1, 1.56 S m-1, and 1.12 S m-1, respectively. This result is consistent with the EIS analysis and further confirms the better electron transport capability of HC-1. A smaller charge transfer resistance implies faster interfacial reaction kinetics, which benefits from the higher graphitization degree and optimized surface chemical properties of the HC-1 sample.
By analyzing the impedance behavior in different frequency regions, we can gain a deeper understanding of the differences in interface processes. Within the high-frequency region above 103 Hz, the real impedance component of all samples tends to converge, reflecting the intrinsic resistance of the electrolyte. As the frequency decreases, the impedance of HC-1 increases most smoothly, indicating that its interface process has the smallest dynamic resistance. From the electrochemical kinetics perspective, the correlation between charge transfer resistance (Rct) and exchange current density (i0) can be clarified. In accordance with fundamental interfacial reaction theories, Rct exhibits an inverse correlation with the reaction rate constant and the number of active sites. A smaller Rct in HC-1 implies higher exchange current density and faster charge transfer kinetics.
The differences in SEI film properties can be inferred from the mid frequency characteristics of impedance spectra. Although detailed equivalent circuit fitting has not been performed, it can be observed from the shape of the Nyquist plot that the impedance contribution in the mid frequency region of HC-1 is the smallest, this reveals that a thinner and more homogeneous SEI layer is formed on its surface. By comparison, HC-3 displays a considerably larger impedance response in the intermediate-frequency range, which is probably attributable to the continuous growth of unstable SEI films as well as excessive surface parasitic reactions.
The Warburg impedance feature in the low-frequency domain can reflect the kinetic behavior of lithium-ion diffusion. The diffusion characteristics of Li+ can be evaluated by analyzing the correlation between the real impedance component Z’ and the reciprocal square root of angular frequency ω-1/2. Based on the diffusion-controlled impedance theory, Z’ shows a linear correlation with ω-1/2, within the low-frequency diffusion-dominated region. Meanwhile, its slope, namely the Warburg coefficient σ, is inversely proportional to the square root of the diffusion coefficient D:
Where Z’ is the real part of impedance, RS is the solution resistance, Rct is the charge-transfer resistance, σ is the Warburg coefficient, and ω is the angular frequency.
The σ values of HC-1, HC-2, and HC-3 obtained through linear fitting are 25, 38, and 52 Ω s-1/2 respectively. A smaller σ value indicates faster lithium ion diffusion kinetics, which is consistent with the diffusion coefficient trend calculated based on the Randles Sevcik equation earlier.
Figure 3F compares the rate capability of the three samples under various current densities. At 0.1 C
Even at a high current of 5 C (1.86 A g-1), HC-1 still delivers a specific capacity of 85.6 mA h g-1, corresponding to a capacity retention of 23.3% relative to the value at 0.1 C. By contrast, HC-2 and HC-3 only attain 78.9 and 41.4 mA h g-1, with retention ratios of 23.6% and 14.4% correspondingly. Notably, when the current density reverts from 5 C back to 0.1 C, HC-1 achieves a capacity recovery ratio of 68.4% (251.5/367.5), which is remarkably superior to HC-2 (62.7%) and HC-3 (51.2%). This result demonstrates that HC-1 well preserves structural stability even after high-rate charge-discharge cycling.
The difference in rate performance can be explained from two perspectives: ion transport and electron conduction. According to the coupling analysis of Ohm’s law and Fick’s law, the performance of electrodes at high rates is limited by the ion diffusion rate and electronic conductivity. The larger layer spacing
Figure 3G presents the long-cycle stability of the three materials at 0.5 C (186 mA g-1). After 100 cycles at
The mechanism analysis of cyclic decay reveals important information. HC-1 experiences a rapid capacity decay (about 8%) in the first 20 cycles, and then enters a stable plateau period with a significant decrease in decay rate (about 0.07% per cycle). This two-stage decay behavior is a typical feature of HC materials: the initial decay is mainly due to the adjustment of the SEI film and the saturation of some irreversible sites[27], while the later decay reflects the stability of the material structure. In contrast, HC-3 continues to rapidly decay throughout the entire cycle, indicating a continuous deterioration of its structure, which may be related to the fracture of the carbon skeleton and pore collapse.
The XRD pattern in Figure 4A shows a systematic low angle shift of the (002) diffraction peak caused by phosphorus doping, gradually shifting from 24.05° in HC-1 to 22.67° in HC-1-P15. By accurately calculating the Bragg equation, the interlayer spacing d002 linearly expanded from 0.369 nm to 0.392 nm, with an increase of 4.6%. This change is directly related to the size difference between phosphorus atoms (covalent radius
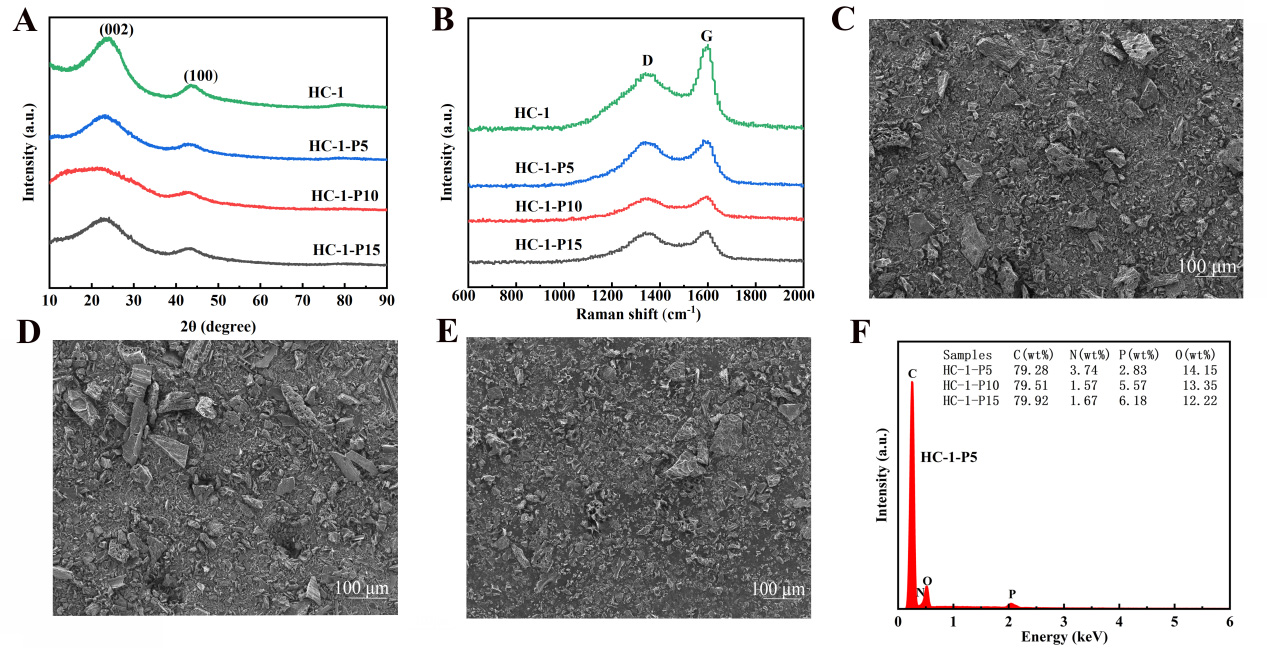
Figure 4. (A) XRD pattern, (B) Raman spectra, (C-E) High magnification SEM images of HC-1 at phosphorus contents of 5, 10, and 15 wt%, respectively and (F) EDS image of HC-1. XRD: X-ray diffraction; SEM: scanning electron microscopy; EDS: energy-dispersive X-ray spectroscopy; HC: hard carbon.
Further structural characterization can disclose the ordering variation of carbon layers by analyzing the evolution of the (100) diffraction peak. The calculated intra layer lattice constant a slightly increased from 0.246 nm (HC-1) to 0.249 nm (HC-1-P5), further confirming the lattice occupancy effect of phosphorus atoms. It is worth noting that no obvious characteristic peaks of phosphate or phosphide were observed in all doped samples, indicating that within the doping concentration range of ≤ 15 wt.% in this study, phosphorus is mainly dispersed in the carbon matrix at the atomic scale, rather than forming a second phase.
In the Raman spectrum of Figure 4B, the intensity ratio ID/IG of the D band (~1,350 cm-1) to the G band (~1,580 cm-1) monotonically increases from 0.88 (HC-1) to 0.99 (HC-1-P15). The decomposed the D band into three components: D1 (sp3 defect, ~1,350 cm-1), D2 (edge defect, ~1,500 cm-1), and D3 (disordered sp2 carbon, ~1,200 cm-1). Phosphorus doping mainly increases the strength of D3 component by 45%, while D1 and D2 components increase by 28% and 32% respectively[28].
Further investigation shows that the FWHM of the G-band broadens from 45 cm-1 for HC-1 to 52 cm-1 for HC-1-P15, suggesting reduced graphite microcrystal dimensions and enhanced structural disorder. The graphite crystallite size was calculated via the Tuinstra-Koenig correlation La = 4.4/(ID/IG). The obtained La value of HC-1-P5 is 5.0 nm, slightly smaller than 5.3 nm of pristine HC-1. Such a mild decrease in crystallite size is conducive to generating more edge active sites, thereby facilitating the surface adsorption and storage of lithium ions.
The high magnification SEM images in Figure 4C-E clearly demonstrate the regulatory effect of phosphorus doping on the surface morphology of the material. HC-1-P5 [Figure 4C] exhibits a relatively uniform particle distribution and a moderate nanoscale roughness (Ra ≈ 25 nm) on the surface, which is due to the mild etching effect of the phosphoric acid precursor during pyrolysis. In contrast, HC-1-P15 [Figure 4E] exhibits obvious over etching features, with a large number of micropores (< 50 nm) and cracks appearing on the surface, indicating a decrease in mechanical stability.
The low magnification SEM images in Supplementary Figure 5A-C further confirm the above trend. The particles of HC-1-P5 maintain a complete spherical morphology, with an average particle size of
The EDS quantitative data in Figure 4F provides stoichiometric information for phosphorus doping. The elemental composition of HC-1-P5 is C: 79.28 at.%, O: 14.15 at.%, P: 2.83 at.%, N: 3.74 at.%. The actual phosphorus content (2.83 at.%) is consistent with the nominal doping level of 5 wt% H3PO4 relative to the walnut shell precursor (5% phosphorus doping refers to a mass fraction of 5% phosphorus doping before carbonization, and 2.83% is the phosphorus content measured by EDS after carbonization. Because high-temperature decomposition and carbonization reduction will cause a portion of phosphoric), demonstrating high phosphorus incorporation efficiency. O/C atomic ratio: 0.178, which is higher than the 0.074 of HC-1. This increase is mainly due to the introduction of oxygen-containing functional groups by phosphorus atoms, which are speculated to exist in the forms of P=O and P-O-C. N content: 3.74 at.%, higher than the 0.31 at.% of HC-1. Possible sources of nitrogen include natural nitrogen-containing components in precursors and interactions with the atmosphere during phosphorus doping processes[30].
Supplementary Figure 5D and E show the EDS surface distribution of samples with different phosphorus contents, and the uniform distribution of phosphorus elements further confirms the uniformity of doping. By calculating the coefficient of variation (CV = σ/μ) of phosphorus distribution, the CV value of HC-1-P5 is 0.28, indicating good distribution uniformity; The CV value of HC-1-P15 increased to 0.43, reflecting the enhanced non-uniformity of doping.
The N2 adsorption desorption isotherm in Supplementary Figure 6A shows that all phosphorus doped samples maintain Type I isotherm characteristics, indicating the dominant role of microporous structure[31]. However, as the phosphorus content increases, the adsorption capacity of the isotherm increases within the range of relative pressure P/P0 = 0.1-0.3, which usually corresponds to an increase in the number of super micropores (< 1 nm).
Quantitative results summarized in Supplementary Table 1 demonstrate that the BET specific surface area rises from 474.00 m2 g-1 for HC-1 to 786.30 m2 g-1 for HC-1-P15. Notably, the growth of specific surface area does not follow a strict linear relationship with phosphorus doping content. At 5 wt% P doping, the surface area only rises by 3.7% to 491.70 m2 g-1; at 10 wt% doping, it increases by 33.5% to 632.55 m2 g-1; and at
The pore size distribution curve in Supplementary Figure 6B reveals that phosphorus doping mainly affects micropores and mesopores within the range of 1-3 nm. Specifically: HC-1 exhibits a bimodal distribution at 1.3 and 3.5 nm. The peak of HC-1-P5 at 1.2 nm is enhanced, while the peak at 3.5 nm remains largely unchanged. HC-1-P15 shows a new peak at 1.0 nm, indicating the extensive generation of super micropores. This variation in pore size distribution has a significant impact on lithium storage behavior. 1-2 nm micropores are suitable for single-layer adsorption of lithium ions, providing high specific capacity; However, ultramicropores < 1 nm may cause ion transport obstruction. The optimized pore size distribution of HC-1-P5 (mainly focused on 1.2-1.5 nm) achieves a balance between capacity and kinetics[32].
In the CV curve of Figure 5A, the phosphorus doped samples maintain the typical redox characteristics of HC, but the peak current and peak position undergo changes. The cathodic peak current density of HC-1-P5 is as high as -1.02 mA cm-2, which is 20% greater than that of pristine HC-1. At the same time, the oxidation-reduction peak potential difference ΔEp decreased from 0.51 V (HC-1) to 0.45 V (HC-1-P5), indicating an improvement in the reversibility of the electrode reaction. Supplementary Figure 7A and B show the CV curves of HC-1-P10 and HC-1-P15 at different scan rates, respectively. Compared with HC-1-P5, although the CV curves of HC-1-P10 and HC-1-P15 still maintain similar shapes, they show two key trends with increasing doping concentration: firstly, at the same scan rate, the absolute value of peak current decreases, indicating a decrease in overall reaction rate and active site utilization; Secondly, as the scanning speed increases, the broadening and shift of its oxidation-reduction peak intensify[33].
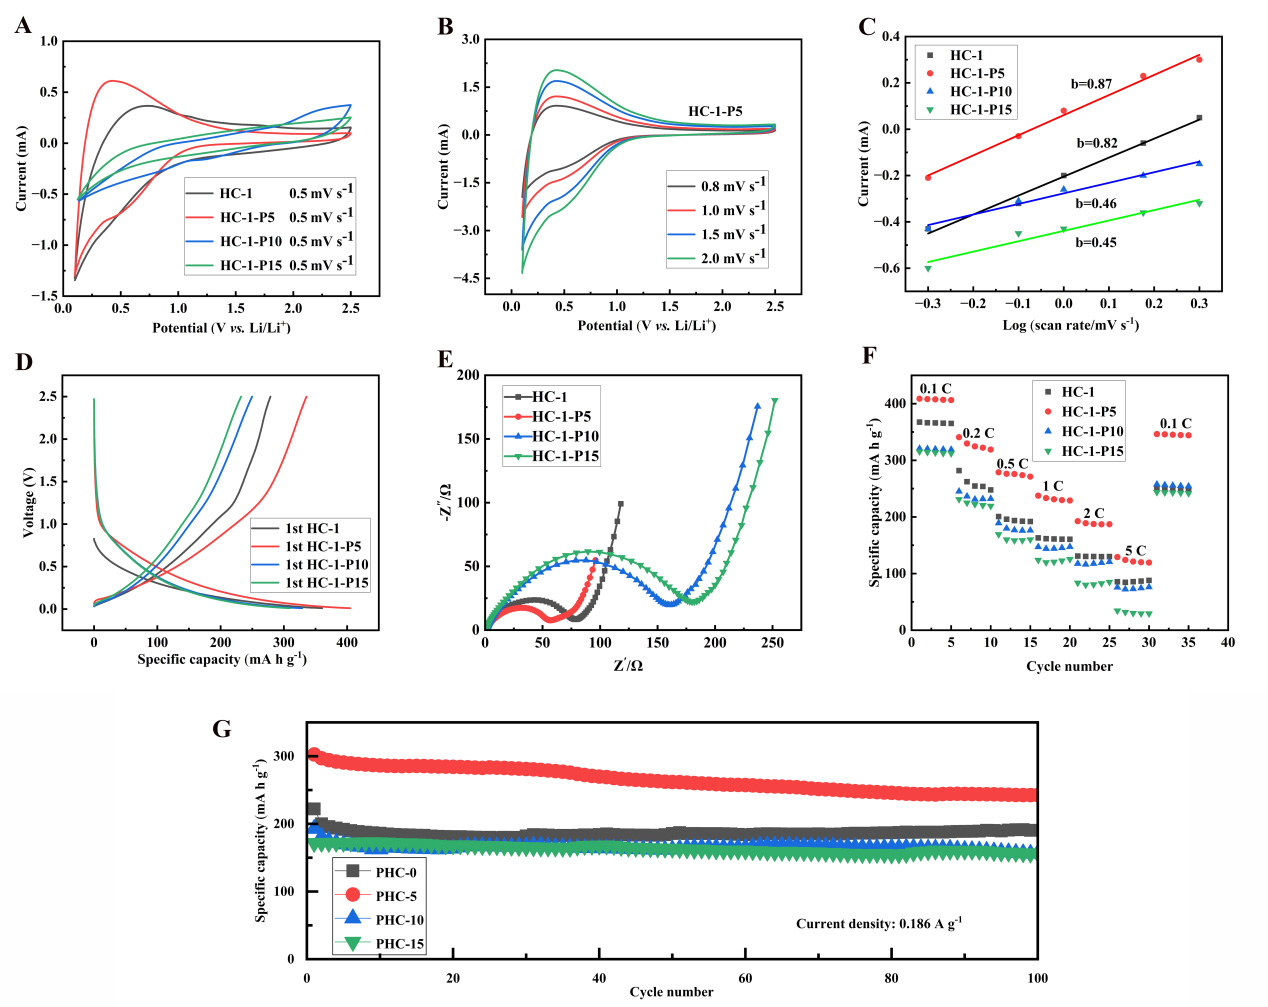
Figure 5. (A) CV curves; (B) CV profiles of HC-1-P5 at various scan rates; (C) Linear fitting plots based on CV data; (D) Initial galvanostatic charge-discharge curves of HC-1 with 5, 10, and 15 wt% phosphorus doping at 37.2 mA g-1; (E) Nyquist plots; (F) Rate capability; (G) Cycling stability measured at 0.186 A g-1. CV: Cyclic voltammetry; HC: hard carbon.
A more in-depth dynamic analysis was achieved through scanning rate dependent experiments [Figure 5B]. According to the Randles Sevcik equation, the calculated apparent lithium-ion diffusion coefficient Dapp of HC-1-P5 is 3.2 × 10⁻¹² cm2 s-1, presenting a 39% enhancement compared with pure HC-1. Such promotion mainly originates from the expanded interlayer spacing, which lowers the migration energy barrier for lithium ions[34].
The log (i) - log (v) fitting results in Figure 5C show that HC-1-P5 possesses a b-value of 0.87, higher than the 0.82 of HC-1. Electrochemical fundamentals demonstrate that a b-value approaching 1 corresponds to dominant capacitive-controlled behavior, while a value near 0.5 represents diffusion-dominated kinetics. Quantitative analysis via the Dunn method indicates that HC-1-P5 delivers a capacitive contribution of 68% and a diffusion contribution of only 32% at a scan rate of 0.5 mV s-1.
The transformation of this storage mechanism is closely related to the surface functional groups introduced by phosphorus doping. The increase in oxygen content measured by EDS (O/C increased from 0.074 to 0.178) indicates an increase in oxygen-containing functional groups, especially P=O and P-O-C, which can provide additional Faraday pseudocapacitance[35].
Figure 5D shows that the first coulombic efficiency of HC-1-P5 reached 82.81%. The initial specific capacity at 0.1 C is 405.4 mAh g-1, which is higher than the other three materials. It is worth noting that HC-1-P5 exhibits a higher BET specific surface area (491 m2 g-1) than HC-1. Normally, a larger specific surface area tends to induce more severe electrolyte decomposition and increased irreversible lithium loss, which usually reduces the However, HC-1-P5 still achieves a prominently enhanced ICE, which can be mainly ascribed to the positive effects introduced by appropriate phosphorus doping. Firstly, appropriate phosphorus doping effectively increases the content of unstable oxygen-containing groups on the carbon surface, which are prone to trigger side reactions with electrolyte. Secondly, it optimizes the surface chemical state and electronic structure, helping to form a thinner, denser and more stable SEI film. Finally, the stabilized interfacial structure suppresses excessive electrolyte decomposition and unnecessary lithium consumption during the first cycle. Therefore, even with a relatively high specific surface area, HC-1-P5 still delivers a remarkably high ICE[36]. Capacity distribution analysis reveals that the plateau capacity below 0.1 V reaches value of
To further explore the influences of different phosphorus doping contents on the reversible capacity and interfacial stability between electrode and electrolyte, Supplementary Figure 7C compares the constant current charge-discharge curves of three doped samples (HC-1-P5, HC-1-P10, HC-1-P15) during the second cycle. Based on the impedance analysis results [Figure 5E], a clear pattern can be observed: as the phosphorus doping concentration increases from 5 wt.% to 15 wt.%, the polarization of the electrode increases, this phenomenon can be directly manifested as the elevated voltage hysteresis in the charge-discharge plateau region, accompanied by a relative capacity decline in the slope region. Specifically, the curve of HC-1-P15 shows the widest voltage hysteresis and the least obvious plateau region, which is closely related to its highest charge transfer resistance (inferred from the Nyquist plot) and the possible formation of unstable/excessively thick SEI films. In contrast, the second cycle curve of HC-1-P5 highly overlaps with the first cycle [Figure 5D], indicating excellent reversibility and stability of its interfacial reaction. This comparison strongly indicates that moderate phosphorus doping (5 wt.%) can optimize interface chemistry, form a thin and stable SEI film, thereby reducing impedance, decreasing polarization, and enhancing cycling reversibility; However, excessive doping can disrupt this balance, leading to an increase in interface side reactions, impedance rise, and accelerated capacity decay[38].
In the Nyquist plot of Figure 5E, phosphorus doping reduces the high-frequency semicircle diameter. By measuring the diameter of the semicircle, the charge transfer resistance Rct was estimated to be approximately 32 Ω for HC-1-P5, which is 33% lower than HC-1 (48 Ω). It should be noted that EIS reflects the overall electrode impedance including SEI, electrolyte, and interface resistance, not the intrinsic electronic conductivity. Powder conductivity tests confirm that phosphorus doping effectively enhances the intrinsic electronic conductivity of HC-1-P5, which is consistent with the reduced charge transfer resistance. Based on the Butler-Volmer equation, the exchange current density i0 exhibits an inverse correlation with Rct:
Where i0 is the exchange current density, R is the gas constant, T is the absolute temperature, n is the electron transfer number, F is the Faraday constant, and Rct is the charge-transfer resistance.
The calculated i0 of HC-1-P5 is 5.2 × 10⁻⁴ A cm-2, which is 67% higher than HC-1 .
The analysis of Warburg behavior in the low-frequency region further confirms the improvement of diffusion dynamics. By fitting the Z’-Ω-1/2 relationship, the Warburg coefficient σ was obtained: HC-1-P5 is
Figure 5F shows that HC-1-P5 can still provide a capacity of 129.1 mAh g-1 at a rate of 5 C (1.86 A g -1), with a capacity retention rate of 31.6% compared to 0.1 C rate. The retention rate is higher than HC-1 (11.1%) and other doped samples.
It is worth noting that the material exhibits excellent capacity recovery performance. When the current density returns from 5 C to 0.1 C, the reversible specific capacity of HC-1-P5 reaches 346.3 mAh g-1, with a recovery rate of 84.7% relative to its initial 0.1 C capacity (408.7 mAh g -1). Such superior capacity recovery demonstrates that the material structure remains free from irreversible destruction even under high-rate cycling conditions. This is mainly attributed to phosphorus doping, which strengthens the mechanical stability of the carbon framework and optimizes its pore structure.
Figure 5G shows that the capacity retention rate of HC-1-P5 after 100 cycles at 0.5 C is 80.15%, After 100 cycles at a current density of 0.5 C, HC-1-P5 exhibits a slightly lower capacity retention rate (80.15%) than HC-1 (85.7%). However, the specific capacity of HC-1-P5 during cycling is much higher than that of HC-1 throughout the entire cycling process. Its initial specific capacity is 302.7 mAh g-1. In the initial 20 cycles, the capacity loss was 18.4 mAh g-1, with a remaining capacity of 284.3 mAh g-1 resulting in a 6% loss. In the next 80 cycles, the capacity further decreased to 242.6 mAh g-1 with a loss rate of 14.7%. The average loss rate of the latter cycle (~0.183%/cycle) is lower than that of the previous cycle (~0.300%/cycle), indicating that the material exhibits better capacity retention ability after initial activation or stabilization.
The optimization of this attenuation mode may stem from the stable SEI film promoted by phosphorus doping. Although there is no direct SEI composition analysis, the electrochemical behavior indirectly indicates that the lower interface impedance and better capacity retention of HC-1-P5 suggest the formation of a more stable and ion conductive SEI film on its surface.
CONCLUSION
This work systematically investigated HC materials fabricated from three typical biomass precursors, namely walnut shell, reed stalk and corn stalk. The results demonstrate that walnut shell-derived HC-1 delivers the optimal electrochemical performance, which is ascribed to its well-organized carbon framework and hierarchically porous structure. Further optimization through phosphorus doping achieved comprehensive performance improvement in the HC-1-P5 at an optimal doping concentration of 5 wt.%, through a triple synergistic effect of structure, interface, and electrons: the ICE is up to 82.81%, the reversible specific capacity attains 242.6 mA h g-1 at 0.5 C, and after 100 cycles at 0.5C, the capacity retention maintains 80.15%. Phosphorus doping promotes ion diffusion by expanding the interlayer spacing (0.369 → 0.392 nm), optimizes surface chemistry to reduce interfacial impedance, and enhances electron conduction through n-type doping. Excessive doping (> 10 wt.%) leads to performance degradation due to increased structural defects. This study provides effective doping strategies and theoretical basis for the rational design of biomass HC anodes.
DECLARATIONS
Authors’ contributions
Designed the overall research framework, formulated experimental schemes, supervised the whole study progress, revised the full manuscript, and took charge of submission and communication with journals: Zou, Y.; Zhou, Z.
Performed raw material pretreatment, material synthesis andhigh-temperature carbonization experiments, completed physical characterizations (XRD, SEM, Raman etc.) and electrochemical testing (galvanostatic cycling, EIS, CV), sorted original experimental data, drafted the initial full manuscript, drew all figures and tables: Fei, H.
Assisted with material doping modification experiments, collected partial electrochemical test data, participated in data analysis and result discussion, modified the manuscript’s results and discussion section: Yang, Y.
Completed material microstructure theoretical analysis and relevant data fitting, consulted and screened cited literatures, helped finish reference formatting and manuscript language polishing: Tang, T.; Liu, L.
Provided experimental raw materials and test equipment support, put forward constructive suggestions on experimental parameter optimization, reviewed the finished manuscript: Zeng, T.; Wan, J.
Availability of data and materials
The data presented in this study are available from the corresponding author upon request.
AI and AI-assisted tools statement
During the preparation of this manuscript, the AI tool ChatGPT (version GPT-5.5, released 2026-04-23) was used solely for language editing. The tool did not influence the study design, data collection, analysis, interpretation, or the scientific content of the work. All authors take full responsibility for the accuracy, integrity, and final content of the manuscript.
Financial support and sponsorship
This work was supported by the National Natural Science Foundation of China under Grant 62301084; the Natural Science Foundation of Hunan Province under Contract 2025JJ50221; the Scientific Research Project of Hunan Provincial Education Department under Grant 22B0829; and the Yuelu Mountain Industrial Innovation Center Key Projects under Grant 2023YCII0120.
Conflicts of interest
All authors declared that there are no conflicts of interest.
Ethical approval and consent to participate
Not applicable.
Consent for publication
Not applicable.
Copyright
© The Author(s) 2026.
Supplementary Materials
REFERENCES
1. Reddy, M. V.; Mauger, A.; Julien, C. M.; Paolella, A.; Zaghib, K. Brief history of early lithium-battery development. Materials 2020, 13, 1884.
2. Dos Reis, G. S.; Molaiyan, P.; Subramaniyam, C. M.; et al. Biomass-derived carbon-silicon composites (C@Si) as anodes for lithium-ion and sodium-ion batteries: a promising strategy towards long-term cycling stability: a mini review. Electrochem. Commun. 2023, 153, 107536.
3. Mahato, S.; Das, A.; Biswas, K. Experimental and theoretical investigation on boron, phosphorus dual doped hard carbon as anode for sodium-ion battery. J. Energy. Storage. 2024, 104, 114422.
4. Tang, H.; Yue, L.; Mu, X.; Xia, H.; Zhou, H. Phosphorus-based anodes for fast-charging lithium-ion batteries: advances, challenges and prospects. Energy. Mater. 2025, 5, 500151.
5. Wang, K.; Jin, Y.; Sun, S.; et al. Low-cost and high-performance hard carbon anode materials for sodium-ion batteries. ACS. Omega. 2017, 2, 1687-95.
6. Yuan, A. B.; Cheng, S. A.; Zhang, J. Q.; Cao, C. N. Electrochemical lmpedance spectroscopy of porous nickel electrode and its mathematical model. Acta. Phys. Chim. Sin. 1998, 14, 804-10.
7. Deng, H.; Chen, J.; Liu, J.; Li, H.; Chen, D. Study on the structure evolution and sodium storage mechanism of biomass hard carbon induced by regulating carbonization temperature. Mater. Sci. Eng. B. 2026, 327, 119284.
8. Liao, L.; Ma, T.; Xiao, Y.; Wang, M.; Gao, Y.; Fang, T. Enhanced reversibility and cyclic stability of biomass-derived silicon/carbon anode material for lithium-ion battery. J. Alloys. Compd. 2021, 873, 159700.
9. Bao, Y.; Gao, T.; Ma, L.; Zhao, Y.; Su, H. Biomass hard carbon for sodium-ion batteries: feedstock-process-performance relationships. Ind. Crops. Prod. 2026, 246, 123417.
10. Batool, K.; Murtaza, G.; Nazir, S.; Li, W.; Chang, C.; Liu, G. G. Si@MXene hybrid anodes for lithium-ion batteries: Interface engineering, structural design, and mechanistic insights toward high-performance energy storage. Energy. Storage. Mater. 2026, 89, 105236.
11. Grey, C. P.; Hall, D. S. Prospects for lithium-ion batteries and beyond-a 2030 vision. Nat. Commun. 2020, 11, 6279.
12. Zhang, Y.; Wang, C.; Zhang, F.; et al. High-performance micron-sized porous Si/C anodes from natural graphite tailings for lithium-ion batteries. Met. Adv. 2026, 44, 88-98.
13. Park, H.; Kim, D.; Yang, J. Controlling the microstructure of hard carbon derived from waste polyethylene terephthalate (PET) for lithium-ion batteries. Funct. Compos. Struct. 2026, 8, 025005.
14. Yu, K.; Xiang, Y.; Song, J.; Zhu, L.; Liang, C. Biomass-derived hard carbon with synergistic ion/electron transport for high-rate sodium-ion batteries: mechanistic insights into sulfur-mediated morphology regulation. Diamond. Relat. Mater. 2026, 165, 113663.
15. Zhang, Q.; Xie, Z.; Wang, X.; Cui, R. Nano-silicon/polythiophene derived high-sulfur hard carbon as lithium-ion battery anode. J. Solid. State. Electrochem. 2026, 30, 1941-51.
16. Ge, H.; Xiu, Z.; Xie, L.; et al. Modified conductive additives based on pine needle-derived biomass carbon for high-performance lithium-ion batteries. Biomass. Bioenergy. 2025, 200, 108008.
17. Qu, X.; Yu, X.; Liao, Y.; et al. Structural regulations of biomass-derived hard carbon for high-performance sodium-ion batteries. J. Power. Sources. 2025, 654, 237786.
18. Li, J.; Jin, Y.; Sun, K.; et al. Unveiling the role of lignin in biomass-derived hard carbon anodes via machine learning. J. Power. Sources. 2025, 631, 236323.
19. Song, W.; Tang, Y.; Liu, J.; et al. Mild pretreatment synthesis of coal-based phosphorus-doped hard carbon with extended plateau capacity as anodes for sodium-ion batteries. J. Alloys. Compd. 2023, 946, 169384.
20. Li, Y.; Huang, Y.; Wang, X.; Liu, W.; Yu, K.; Liang, C. Simple synthesis of rice husk hollow carbon-coated flower ZnO for the anode in a high performance lithium-ion battery. J. Phys. Chem. Solids. 2020, 145, 109540.
21. Wang, C.; Yang, X.; Zheng, M.; Xu, Y. Synthesis of β-FeOOH nanorods adhered to pine-biomass carbon as a low-cost anode material for Li-ion batteries. J. Alloys. Compd. 2019, 794, 569-75.
22. Lin, W.; Zhao, S.; Lu, B.; Jiang, F.; Lu, Z.; Xu, Z. Structures, performances and applications of green biomass derived carbon in lithium-ion batteries. Energy. Mater. 2024, 4, 400078.
23. Lu, J.; Guo, L.; Wang, X.; et al. Recent progress and prospects on modification strategies of antimony anode materials for potassium-ion batteries. Chin. Chem. Lett. 2026, 37, 111951.
24. Zhao, L.; Guan, Z.; Zhu, H.; et al. Interface-homogenized engineering of red phosphorus/activated carbon for high-performance lithium-ion battery anodes. Nanoscale 2026, 18, 8005-24.
25. Fereydooni, A.; Yue, C.; Nakhanivej, P.; et al. Biomass-derived hard carbon host with added commercial silicon for high-capacity lithium-ion battery anodes. Nanoscale. Adv. 2026, 8, 2398-410.
26. Wang, H.; Liu, S.; Lei, C.; et al. P-doped hard carbon material for anode of sodium ion battery was prepared by using polyphosphoric acid modified petroleum asphalt as precursor. Electrochim. Acta. 2024, 477, 143812.
27. Wu, S.; Lu, X.; Zhang, K.; Xu, J.; Sun, Z. Nitrogen/phosphorus dual-doped hard carbon anode with high initial coulombic efficiency for superior sodium storage. Batteries. Supercaps. 2022, 6, e202200427.
28. Chu, Y.; Zhang, J.; Zhang, J.; et al. A Ginkgo biloba derived hard carbon as a highly stable anode for lithium-ion battery. J. Energy. Storage. 2026, 152, 120780.
29. Shang, H.; Zhou, Y.; Li, H.; et al. Solanaceous crops-derived nitrogen-doped biomass carbon material as anode for lithium-ion battery. Nanomaterials 2025, 15, 1357.
30. Song, J.; Mu, T.; Xu, X.; et al. Tailored work function by N, Si Co-doping enables high-performance hard carbon anode for lithium-ion batteries. Adv. Funct. Mater. 2025, 36, e15805.
31. Yao, X.; Wu, J.; Chen, L.; et al. A N, S co-doped carbon produced from soybean pods for use as the anode in sodium-ion batteries. New. Carbon. Mater. 2026, 41, 157-72.
32. Yang, S.; Jin, Y.; Bai, Q.; et al. Synthesis and lithium storage properties of N, S co-doped biomass carbon from peanut shells. J. Electroanal. Chem. 2026, 1009, 120022.
33. Ando, H.; Toyoda, Y.; Fujino, K.; et al. The structural stability and capacity increase of a phosphorus-doped hard carbon produced by zinc oxide templating used in sodium-ion batteries. Carbon 2026, 252, 121392.
34. Hao, Z.; Meng, L.; Wu, Q.; et al. Synergistic stabilization of Fe2VO4 via nitrogen-doped carbon nanofibers and black phosphorus for high performance sodium/lithium-ion batteries. J. Energy. Storage. 2026, 169, 122767.
35. Aristote, N. T.; Song, Z.; Deng, W.; Hou, H.; Zou, G.; Ji, X. Effect of double and triple-doping of sulfur, nitrogen and phosphorus on the initial coulombic efficiency and rate performance of the biomass derived hard carbon as anode for sodium-ion batteries. J. Power. Sources. 2023, 558, 232517.
36. Gong, Y. The modification progress of advanced biomass carbon-based anode materials for LIBs. J. Phys. Conf. Ser. 2025, 3030, 012027.
37. Bai, W.; Ke, J. The preparation of biomass carbon materials and its energy storage research. Ionics 2018, 25, 2543-8.
38. Niu, H.; Zhang, N.; Lu, Y.; et al. Strategies toward the development of high-energy-density lithium batteries. J. Energy. Storage. 2024, 88, 111666.
Cite This Article
How to Cite
Download Citation
Export Citation File:
Type of Import
Tips on Downloading Citation
Citation Manager File Format
Type of Import
Direct Import: When the Direct Import option is selected (the default state), a dialogue box will give you the option to Save or Open the downloaded citation data. Choosing Open will either launch your citation manager or give you a choice of applications with which to use the metadata. The Save option saves the file locally for later use.
Indirect Import: When the Indirect Import option is selected, the metadata is displayed and may be copied and pasted as needed.
About This Article
Copyright

Data & Comments
Data
0


Comments
Comments must be written in English. Spam, offensive content, impersonation, and private information will not be permitted. If any comment is reported and identified as inappropriate content by OAE staff, the comment will be removed without notice. If you have any queries or need any help, please contact us at [email protected].