


Synergistic effect of cation substitution and p-type anion doping to improve thermoelectric properties in Zintl phases
 0
0 Abstract
Altogether, seven Zintl compounds in the solid solution Ca9-xYbxZn4.5-yCuySb9 (0 ≤ x ≤ 1.5, 0 ≤ y ≤ 0.15) system were successfully prepared by the molten Pb-flux and hot-pressing method. From the powder X-ray and single crystal

Keywords
INTRODUCTION
Recent advancements in energy research have focused on developing sustainable solutions to address the global energy crisis[1]. Among these, thermoelectric (TE) materials hold a great deal of promise for directly converting waste heat into electrical energy[1,2]. The efficiency of such materials is typically evaluated using the figure-of-merit ZT, commonly defined as ZT = σS2T/κ, where σ is the electrical conductivity, S is the Seebeck coefficient, T is the absolute temperature, and κ is the thermal conductivity[2]. As is obvious, a high σ, large S, and low κ are necessary to obtain an overall large ZT. Within the field of potential TE materials, Zintl phase compounds have garnered significant interest owing to their inherent semiconducting properties, complex crystal structures, and high thermal stabilities[3].
Over the last decade, our research team has tried to discover new Zintl phase systems and understand the correlation among the crystal structure, chemical compositions, and physical properties for TE applications. These phases includes the A14MSb11 (A = Ca, Yb; M = Al, Mg, Mn, Zn)[4,5], the AM2Sb2 (A = Ca, Sr, Ba, Eu, Yb; M = Zn, Cd)[6,7], the Ca9Cd3+x-yMx+ySb9 (M = Cu, Zn)[8], and the A9M4+xSb9 (A = Ca, Eu, Yb; M = Mn, Zn, Cd) systems[9-11]. Among them, of particular interest is the Ca9Mn4Bi9-type A9M4+xSb9 (A = Ca, Eu, Yb; M = Mn, Zn, Cd) systems[9-11]. Research on this system has been widely conducted all over the world owing to its considerably high ZT, and to enhance the ZT even further, many studies have explored various doping and substitution strategies on this system. However, the polymorphic feature of the “9-4-9” phase often produced some other “9-4-9” structure types rather than the targeted Ca9Mn4Bi9-type phase[12], such as the three orthorhombic Ca9Mn4.41(1)Sb9-type[13], Eu9Mn2.87(4)Al1.13Sb9-type[14], Ca8.27La0.73(1)Mn4Sb9-type phases[15], and the one hexagonal Ca9Zn3.1In0.9Sb9-type phase[16]. To address this issue, firstly, we attempted to apply the cation mixture using both Ca and Yb in the title system, which showed significant potential for enhancing ZT by increasing phonon scattering and reducing lattice thermal conductivity[17,18]. Secondly, in the
In this study, we successfully synthesized seven new compounds in the Ca9-xYbxZn4.5-yCuySb9 (0 ≤ x ≤ 1.5,
EXPERIMENTAL
Synthesis
Sample preparation was carried out within an argon-filled glovebox, where oxygen and moisture concentrations were kept below 0.1 ppm, or under vacuum. All reactants were bought from Alfa Aesar, and these included Ca (shot, 99.5%), Yb (ingot, 99.9%), Zn (shot, 99.99%), Cu (shot, 99.5%), Sb (shot, 99.9999%), and Pb (granules, 99.99%). The surfaces of Ca and Yb, which had become tarnished, were scrubbed using a metal brush inside an argon-filled glovebox before use. All reactant sets were introduced into alumina crucibles, accompanied by an excess quantity of Pb metal used as the metal-flux in the following ratios: Ca:Yb:Zn:Cu:Sb:Pb = 9:0:4.5:0:9:45, 8.5:0.5:4.5:0:9:45, 8:1:4.5:0:9:45, 7.5:1.5:4.5:0:9, 8:1:4.45:0.05:9:45, 8:1:4.4:0.1:9:45, and 8:1:4.35:0.15:9:45. Individual alumina crucibles were inserted into separate fused-silica tubes which were subsequently sealed under vacuum conditions to prevent oxidation of reactants during processing at elevated temperatures. Then, the reactants were annealed in a furnace ramped up to 1323 K at 200 K/h, kept there for 24 h, and then cooled down to 873 K at a rate of 5 K/h in 90 h. Afterward, the reaction ampoule was quickly taken out of the furnace and centrifuged for 3 min to separate the crystallized products from the molten Pb-metal flux. A small amount of remaining Pb metal after the centrifugation was further dissolved by soaking crystals in H2O2 for 48 h, and the needle/bar-shaped nicely grown single crystals were eventually obtained as shown in Figure 1.

Figure 1. OM images for the needle/bar-shaped single-crystals of (A) Ca8YbZn4.45Cu0.05Sb9, (B) Ca8YbZn4.4Cu0.1Sb9, and (C)
Four of the title compounds were additionally prepared via ball-milling followed by a hot-pressing method to obtain larger quantities of samples suitable for TE property measurements. Initially, each reactant mixture corresponding to the target composition was placed into a stainless-steel container along with two 0.5-inch and two 0.25-inch stainless-steel balls inside an argon-filled glovebox. The mixtures were then ball-milled using a SPEX 8000M milling machine for 3 h. During this procedure, milling was paused every
X-ray diffraction analysis
PXRD analysis was initially used to evaluate the phase purity of the five title compounds in the
The phase purities were first examined by comparing the measured diffraction patterns with a calculated pattern based on the SXRD refinement results of Ca9Zn4.48(2)Sb9; this comparison is shown in Figure 2. In addition, the Rietveld refinement was conducted for the collected PXRD patterns of three Zn/Cu mixture-containing quinary compounds using PDXL2 software to obtain the lattice parameters and volumes of the unit cells. The refinement results and lattice parameters are presented in Supplementary Table 1 and Supplementary Figure 1.

Figure 2. (A-F) PXRD patterns of five title compounds in the Ca9-xYbxZn4.5-yCuySb9 (0.57(2) ≤ x ≤ 1.28(2), 0 ≤ y ≤ 0.15) system. A PXRD pattern calculated from the SXRD data of CaZn4.48(2)Sb9 is also provided for a comparison purpose.
SXRD data was collected at room temperature for one ternary and three quaternary compounds:
Crystallographic data for Ca9-xYbxZn4.5-ySb9 [0 ≤ x ≤ 1.28(2), 0.02(2) ≤ y ≤ 0.05(2)] system
| Empirical formula | Ca9Zn4.48(2)Sb9 | Ca8.43(2)Yb0.57Zn4.46(1)Sb9 | Ca8.01(3)Yb0.99Zn4.46(1)Sb9 | Ca7.72(2)Yb1.28Zn4.45(2)Sb9 | |
| Structure type | Ca9Mn4Bi9-type | ||||
| Crystal system | Orthorhombic | ||||
| Space group | Pbam (No. 55) | ||||
| Lattice parameters (Å) | a | 12.4557(6) | 12.5080(3) | 12.4546(4) | 12.4523(7) |
| b | 21.848(1) | 21.9140(6) | 21.8344(6) | 21.845(2) | |
| c | 4.5425(2) | 4.5574(1) | 4.5412(1) | 4.5438(2) | |
| Volume (Å3) | 1,236.2(1) | 1,249.18(5) | 1,234.93(6) | 1,236.0(2) | |
| Density (g/cm3) | 4.700 | 4.847 | 5.058 | 5.151 | |
| Data/restraints/parameters | 1,786/0/76 | 2,221/0/81 | 1,286/0/81 | 1,947/0/81 | |
| R indicesa [I > 2σ(I)] | R 1 | 0.0198 | 0.0256 | 0.0194 | 0.0176 |
| wR 2 | 0.0402 | 0.0550 | 0.0383 | 0.0349 | |
| R indicesa (all data) | R 1 | 0.0202 | 0.0291 | 0.0206 | 0.0223 |
| wR2 | 0.0403 | 0.0565 | 0.0386 | 0.0364 | |
| Goodness of fit on F2 | 1.406 | 1.199 | 1.264 | 1.065 | |
| Largest diff. of peak and hole (e/Å3) | 0.996/-1.350 | 0.930/-1.641 | 0.873/-1.329 | 0.883/-1.017 | |
Atomic coordinates, site occupancies, and equivalent isotropic atomic displacement parameters (Ueqa) for the Ca9-xYbx Zn4-ySb9 (0 ≤ x ≤ 1.28(2), 0.02(2) ≤ y ≤ 0.05(2)) system
| Atom | Wyckoff position | Occupancy | x | y | z | Ueqa (Å2) | |
| Ca9Zn4.48(2)Sb9 | |||||||
| A1b | 4h | 1 | 0.0602(1) | 0.4087(1) | 1/2 | 0.0067(2) | |
| A2b | 4h | 1 | 0.1223(1) | 0.2391(1) | 1/2 | 0.0090(2) | |
| A3b | 4h | 1 | 0.3634(1) | 0.3622(1) | 1/2 | 0.0077(2) | |
| A4b | 4g | 1 | 0.2891(1) | 0.1026(1) | 0 | 0.0115(2) | |
| A5b | 2a | 1 | 0 | 0 | 0 | 0.0106(3) | |
| Zn1 | 4h | 0.24(1) | 0.1042(3) | 0.1029(2) | 1/2 | 0.017(1) | |
| Zn2 | 4g | 1 | 0.2208(1) | 0.4546(1) | 0 | 0.0088(2) | |
| Zn3 | 4g | 1 | 0.3798(1) | 0.2611(1) | 0 | 0.0093(2) | |
| Sb1 | 4h | 1 | 0.1941(1) | 0.0035(1) | 1/2 | 0.0067(1) | |
| Sb2 | 4h | 1 | 0.3773(1) | 0.1948(1) | 1/2 | 0.0067(1) | |
| Sb3 | 4g | 1 | 0.0402(1) | 0.1476(1) | 0 | 0.0049(1) | |
| Sb4 | 4g | 1 | 0.1907(1) | 0.3333(1) | 0 | 0.0043(1) | |
| Sb5 | 2c | 1 | 0 | 0 | 0 | 0.0050(1) | |
| Ca8.43(2)Yb0.57Zn4.46(1)Sb9 | |||||||
| A1b | 4h | 0.94(1)/0.06 | 0.0611(1) | 0.4089(1) | 1/2 | 0.0127(3) | |
| A2b | 4h | 0.94(1)/0.06 | 0.1229(1) | 0.2390(1) | 1/2 | 0.0158(3) | |
| A3b | 4h | 0.91(1)/0.09 | 0.3634(1) | 0.3616(1) | 1/2 | 0.0139(3) | |
| A4b | 4g | 0.94(1)/0.06 | 0.2892(1) | 0.1022(1) | 0 | 0.0190(4) | |
| A5b | 2a | 0.96(1)/0.04 | 0 | 0 | 0 | 0.0159(5) | |
| Zn1 | 4h | 0.23(1) | 0.1044(4) | 0.1026(2) | 1/2 | 0.031(2) | |
| Zn2 | 4g | 1 | 0.2217(6) | 0.4542(1) | 0 | 0.0171(2) | |
| Zn3 | 4g | 1 | 0.3806(1) | 0.2606(1) | 0 | 0.0193(2) | |
| Sb1 | 4h | 1 | 0.1939(1) | 0.0032(1) | 1/2 | 0.0127(1) | |
| Sb2 | 4h | 1 | 0.3777(1) | 0.1946(1) | 1/2 | 0.0127(1) | |
| Sb3 | 4g | 1 | 0.0405(1) | 0.1477(1) | 0 | 0.0108(1) | |
| Sb4 | 4g | 1 | 0.1909(1) | 0.3331(1) | 0 | 0.0099(1) | |
| Sb5 | 2c | 1 | 0 | 1/2 | 0 | 0.0115(2) | |
| Ca8.01(3)Yb0.99Zn4.46(1)Sb9 | |||||||
| A1b | 4h | 0.89(1)/0.11 | 0.06080(7) | 0.40877(4) | 1/2 | 0.0070(4) | |
| A2b | 4h | 0.90(1)/0.10 | 0.12213(7) | 0.23920(4) | 1/2 | 0.0095(4) | |
| A3b | 4h | 0.85(1)/0.15 | 0.36278(6) | 0.36182(4) | 1/2 | 0.0074(4) | |
| A4b | 4g | 0.91(1)/0.09 | 0.28930(8) | 0.10239(4) | 0 | 0.0118(4) | |
| A5b | 2a | 0.91(1)/0.09 | 0 | 0 | 0 | 0.0108(6) | |
| Zn1 | 4h | 0.23(1) | 0.1049(3) | 0.10319(16) | 1/2 | 0.020(2) | |
| Zn2 | 4g | 1 | 0.22122(6) | 0.45436(3) | 0 | 0.0087(2) | |
| Zn3 | 4g | 1 | 0.38005(6) | 0.26102(3) | 0 | 0.0095(2) | |
| Sb1 | 4h | 1 | 0.19403(3) | 0.00335(2) | 1/2 | 0.0069(1) | |
| Sb2 | 4h | 1 | 0.37734(3) | 0.19475(2) | 1/2 | 0.0066(1) | |
| Sb3 | 4g | 1 | 0.04017(3) | 0.14758(2) | 0 | 0.0049(1) | |
| Sb4 | 4g | 1 | 0.19053(3) | 0.33315(2) | 0 | 0.0042(1) | |
| Sb5 | 2c | 1 | 0 | 1/2 | 0 | 0.0051(2) | |
| Ca7.72(2)Yb1.28Zn4.45(2)Sb9 | |||||||
| A1b | 4h | 0.86(1)/0.14 | 0.0615(1) | 0.4089(1) | 1/2 | 0.0075(2) | |
| A2b | 4h | 0.87(1)/0.13 | 0.1226(1) | 0.2391(1) | 1/2 | 0.0103(2) | |
| A3b | 4h | 0.81(1)/0.19 | 0.3634(1) | 0.3619(1) | 1/2 | 0.0088(2) | |
| A4b | 4g | 0.88(1)/0.12 | 0.2896(1) | 0.1022(1) | 0 | 0.0123(2) | |
| A5b | 2a | 0.88(1)/0.12 | 0 | 0 | 0 | 0.0100(3) | |
| Zn1 | 4h | 0.23(1) | 0.1054(3) | 0.1035(2) | 1/2 | 0.023(2) | |
| Zn2 | 4g | 1 | 0.2214(1) | 0.4543(1) | 0 | 0.0097(1) | |
| Zn3 | 4g | 1 | 0.3807(1) | 0.2609(1) | 0 | 0.0104(2) | |
| Sb1 | 4h | 1 | 0.1940(1) | 0.0034(1) | 1/2 | 0.0077(1) | |
| Sb2 | 4h | 1 | 0.3779(1) | 0.1946(1) | 1/2 | 0.0078(1) | |
| Sb3 | 4g | 1 | 0.0407(1) | 0.1475(1) | 0 | 0.0060(1) | |
| Sb4 | 4g | 1 | 0.1909(1) | 0.3331(1) | 0 | 0.0055(1) | |
| Sb5 | 2c | 1 | 0 | 1/2 | 0 | 0.0062(1) | |
Selected bond distances for the Ca9-xYbx Zn4-ySb9 [0 ≤ x ≤ 1.28(2), 0.02(2) ≤ y ≤ 0.05(2)] system
| Atomic pair | Bond distance (Å) | |||
| Ca9Zn4.48(2)Sb9 | Ca8.43(2)Yb0.57Zn4.46(1)Sb9 | Ca8.01(3)Yb0.99Zn4.46(1)Sb9 | Ca7.72(2)Yb1.28Zn4.45(2)Sb9 | |
| A1a - Sb1 | 3.695(2) | 3.696(1) | 3.686(1) | 3.6784(7) |
| A1a - Sb2 | 3.211(2) | 3.226(1) | 3.214(1) | 3.2159(7) |
| A1a - Sb4 | 3.2426(7) | 3.2543(7) | 3.239(1) | 3.2407(5) |
| A1a - Sb5 (×2) | 3.1140(7) | 3.1239(6) | 3.114(1) | 3.1162(4) |
| A2a - Sb2 | 3.377(2) | 3.394(2) | 3.373(1) | 3.3729(8) |
| A2a - Sb3 | 3.1937(7) | 3.2036(7) | 3.194(1) | 3.1939(5) |
| A2a - Sb4 | 3.1817(7) | 3.1884(7) | 3.176(1) | 3.1782(5) |
| A3a - Sb1 | 3.169(2) | 3.184(1) | 3.170(1) | 3.1737(7) |
| A3a - Sb3 (×2) | 3.1712(8) | 3.1846(6) | 3.175(1) | 3.1743(5) |
| A3a - Sb4 | 3.1909(8) | 3.1998(7) | 3.186(1) | 3.1889(5) |
| A4a - Sb1 | 3.3546(8) | 3.3638(8) | 3.353(1) | 3.3515(6) |
| A4a - Sb2 | 3.2282(8) | 3.2435(8) | 3.229(1) | 3.2329(5) |
| A4a - Sb5 (×2) | 3.454(2) | 3.459(2) | 3.447(1) | 3.4421(7) |
| A5a - Sb1 | 3.3177(3) | 3.3287(3) | 3.353(1) | 3.3174(3) |
| Zn1 - Sb1 | 2.444(3) | 2.450(3) | 2.446(4) | 2.450(3) |
| Zn1 - Sb3 (×2) | 2.597(2) | 2.608(2) | 2.597(2) | 2.595(2) |
| Zn2 - Sb1 (×2) | 2.7245(4) | 2.7315(4) | 2.723(1) | 2.7241(4) |
| Zn2 - Sb4 | 2.6755(7) | 2.6808(8) | 2.674(1) | 2.6749(7) |
| Zn2 - Sb5 (×2) | 2.9243(6) | 2.9492(8) | 2.930(1) | 2.9329(6) |
| Zn3 - Sb2 (×2) | 2.6939(4) | 2.6997(5) | 2.693(1) | 2.6945(4) |
| Zn3 - Sb3 | 2.8231(7) | 2.8356(8) | 2.821(1) | 2.8218(7) |
| Zn3 - Sb4 | 2.8352(7) | 2.8558(9) | 2.838(1) | 2.8400(7) |
DFT calculation
To understand how atomic substitutions influence the electronic structure of the studied system, DFT calculations were carried out by employing the TB-LMTO-ASA method[24-27] with two hypothetical models. For practical reasons, these two hypothetical models were designed to have the monoclinic subgroup Pc
All relativistic effects were incorporated using a scalar relativistic approximation, except for spin-orbit coupling. The potential inside each Wigner-Seitz (WS) sphere was treated as spherically symmetric[28], and a combined correction was applied to account for the overlapping regions. Empty spheres were automatically included, and the space was filled with overlapping WS atomic spheres[28]. The WS sphere radii were automatically calculated to optimize the overlapping potential's approximation to the full potential. The WS radii used for the two models are as follows: Ca, 1.891-2.158 Å; Zn, 1.335-1.504 Å; Sb, 1.631-1.911 Å for
TGA
The TGA, performed on a Netzsch TG 209 F1 Libra instrument, was utilized to evaluate the thermal stability of three synthesized compounds. Each pulverized sample (around 20 mg) was positioned in an alumina pan. Heating proceeded to 1,123 K under a constant nitrogen flow, with the temperature ramped at 10 K/min. Following the heating cycle, the samples underwent natural cooling back to ambient temperature. The resulting TGA curves [Supplementary Figure 2] indicated that the three compounds maintained thermal integrity up to roughly 900 K.
Electrical transport property measurement
First, disk-shaped specimens were prepared using a two-step pressing process: initial hot-pressing at 623 K for 2 h under 60 MPa, followed by pressing at 1,073 K for 2 h. From these disks, square bars (3 mm × 3 mm × 10 mm) were cut and polished for the electrical measurements. It was verified through geometric density checks that all samples achieved densities above 96%. Under a helium atmosphere, the temperature-dependent electrical conductivity σ and Seebeck coefficient S of the four compounds were measured simultaneously from 323 to 861 K with a ULVAC-RIKO ZEM-3 system.
Thermal conductivity measurement
Using the flash diffusivity method, thermal diffusivity was evaluated for the four disk-shaped title compounds between 323 and 861 K. The measurements were performed with a Netzsch LFA 467 HyperFlash system in an argon environment, where a laser pulse heats the sample's front surface, and an Infrared (IR) detector tracks the subsequent temperature rise on the back surface. The thermal conductivity κ was determined using κ = DCpρ, where D = thermal diffusivity, Cp = heat capacity, and
EDS and EPMA analysis
The elemental composition and distribution within the compounds Ca8YbZn4.35Cu0.05Sb9,
RESULTS AND DISCUSSION
Crystal structure analysis
Seven title compounds in the Ca9-xYbxZn4.5-yCuySb9 (0 ≤ x ≤ 1.50, 0 ≤ y ≤ 0.15) system were prepared using the molten Pb-flux method. Initial structural assessments, including the determination of phase purities and lattice parameters of all compounds, were conducted through Rietveld refinements for the collected PXRD data. As displayed in Figure 2 and Supplementary Figure 1, all seven compounds crystallize as single-phase products. The refined lattice parameters were consistent with those obtained from SXRD data refinement. Further detailed structural refinements for one ternary and three quaternary Zn-containing title compounds were conducted by SXRD analysis, and the resultant crystallographical details are listed in Tables 1-3. The studied compounds adopted the Ca9Mn4Bi9-type phase having an orthorhombic Pbam space group (Pearson code oP44,
Since all seven title compounds are isostructural, the detailed overall crystal structure can be explained using a representative quaternary compound Ca8.43(2)Yb0.57Zn4.46(1)Sb9 in Figure 3. The presented crystal arrangement can basically be elucidated as an assembly of (1) a complex 2-dimensional (2D) layered anionic structure; and (2) two different types of electron-donating cationic elements. Interestingly, the 2D anionic layered structure can be built up from its basic building block of the [ZnSb4] tetrahedron, which initially forms the 1D

Figure 3. (A) A crystal structure of Ca8.43(2)Yb0.57Zn4.46(1)Sb9 illustrated by a combination of ball-and-stick and polyhedral representations viewed down from the c-axis direction. (B) A schematic presentation of the assembly of the 2D anionic layered structure. Color codes: A (Ca/Yb mixed-site): gray; Zn: orange; Sb: blue.
Finally, these anionic clusters are connected to one another via the bridging Zn1 along the a-axis directions to complete the complete 2D layered structure. In particular, these two different types of Zn sites were refined in this anionic framework with distinctive local coordination geometries and different occupations: (1) the Zn1 site (Wyckoff 4h) was located at the center of the trigonal planar site with a partial occupation of ca. 24%; and (2) the Zn2 and Zn3 (both Wyckoff 4g) were found to be at the center of the tetrahedral site with full occupations. Interestingly, the Zn1 site showed a rather larger atomic displacement parameter (ADP) value than two other Zn sites as given in Table 2. This kind of large ADP value was already reported in other isotypic Ca9Mn4Bi9-type compounds, including Ca9Zn4.10(1)Bi9, Sr9Cd4.49(1)Sb9, Ca9Zn4.478(8)Sb9, and
Five different types of cationic sites existed in the title system (See Figure 4): (1) the two intra-layer A3 and A5 sites located inside the “channel-like” voids within the anionic 2D layers; and (2) the three inter-layer A1, A2, and A4 sites situated in-between two such neighboring 2D layers as displayed in Figure 3. All these cationic sites were primarily coordinated by six Sb, which formed a slightly distorted octahedral geometry, and depending on the given local coordination environment, some of the triangular faces were capped by Zn atoms resulting in the various site volumes. Interestingly, in the two quaternary compounds having the Ca/Yb mixed-sites, Yb showed a specific affinity for the A3 site among the five possible cationic sites.

Figure 4. Illustration of the five distinct cationic environments identified within the Ca8.43(2)Yb0.57Zn4.46(1)Sb9 structure. Detailed labeling of atoms and chosen interatomic distance are also shown.
The observed site-preference behavior is typically influenced by one of the following main factors: (1) the size factor, which reflects the compatibility between the central cation and the site volume; or (2) the electronic factor represented by the QVAL[17], which is the relationship between the electronegativity of a cation and an electron density at the site. In our title system, the difference in size between two divalent cations Ca2+ and Yb2+ is quite subtle [r(Ca2+) = 1.00 Å and r(Yb2+) = 1.02 Å][35]. Consequently, the electronic factor should be considered the determining criterion for Yb's observed preference for the A3 site. A detailed analysis of the correlation between the electronic factor and cationic site-preference will be a part of the Electronic Structure section.
Electronic structure and chemical bonding analysis
To understand how the co-substitution of Yb for Ca and Cu for Zn affects the electronic structure of the Ca9-xYbxZn4.5-yCuySb9 system, DFT calculations using the TB-LMTO-ASA method were performed[24-27]. Therefore, two hypothetical structural models containing only Yb or both Yb and Cu were systematically designed with the idealized compositions of Ca8YbZn4.5Sb9 and Ca8YbZn4Cu0.5Sb9, and their electronic structures were calculated and compared with that of the parental compound Ca9Zn4.5Sb9. To incorporate these specific compositions and atomic arrangements in the models, the symmetry was reduced from the experimentally refined space group Pbam (no. 55), which contains 13 crystallographically independent atomic sites, to its subgroup Pc (no. 7), which contains 48 atomic sites. In particular, three out of four Zn1 sites were treated as vacancies to mimic the partial occupation observed in the SXRD refinements. For the quinary Ca8YbZn4Cu0.5Sb9 model, Cu with a higher electronegativity than Zn was assigned to partially occupy the Zn2 site (Wyckoff 4g site) showing the largest QVAL amidst the three available Zn sites. Additional crystallographic details, including lattice parameters and atomic coordinates, were obtained from the SXRD results of Ca9Zn4.48(2)Sb9 and Ca8.01(3)Yb0.99Zn4.46(1)Sb9, respectively. Supplementary Table 2 presents further details for the two studied hypothetical models.
The calculated total DOS (TDOS) and partial DOS (PDOS) curves of Ca9Zn4.5Sb9 and Ca8YbZn4Cu0.5Sb9 resembled each other since they adopted the identical Ca9Mn4.5Bi9-type crystal structure [Figure 5A]. Strong orbital mixing among all elements was observed across the entire energy window, and the pseudogap noted at the Fermi level (EF) was indicative of the poor metallic properties of these title compounds. In particular, the slightly increased metallic properties should be expected for the p-type Cu-substituting compounds since, as shown in Figure 5B, the DOS level at EF increased in the Ca8YbCu0.5Sb9 model. In addition, the wide p-orbital states ranging between ca. -6.5 and 0 eV can be interpreted by dividing into two sub-sections: (1) the lower section between ca. -6.5 and -4.5 eV, where Zn2 and Zn3 showed relatively larger contributions; and (2) the higher section between ca. -4.5 and 0 eV, where Zn1 displayed a relatively stronger contribution. Two or three COHP curves were evaluated to represent the averaged interatomic interactions between Zn and Sb atoms either in a triangular environment of the [ZnSb3] unit or in the tetrahedral coordination of the [ZnSb4] unit [See Figure 5C and D]. In particular, the Cu2-Sb COHP curve in the quinary Ca8YbZn4Cu0.5Sb9 model was also displayed in Figure 5D. Overall, both of these types of Zn-Sb and Cu-Sb COHP curves were nicely optimized at EF in both structural models, and the non-bonding characteristics continued even below EF indicating the possibility of a certain amount of p-type doping on the anionic sites. However, above EF, these two Zn-Sb interactions showed quite strong antibonding characteristics. In particular, the Zn1-Sb COHP curves displayed a three-fold stronger antibonding character than that of Zn2/3-Sb. This strongly indicated that the central site of the [ZnSb3] triangle was supposed to be partially occupied as experimentally observed in the SXRD refinement results.

Figure 5. TDOS, PDOS and COHP curves of Ca9Zn4.5Sb9 (A, C) and Ca8YbZn4Cu0.5Sb9 (B, D). The EF corresponding to 72 and 71.5 valence electron count (VEC) in (A and B) is set as the reference energy (0 eV) and marked with a dashed vertical line. An additional line corresponding to 72 VEC in (B) is shown with a dotted line. In the COHP diagram, "+" regions indicate bonding interactions, while "-" regions represent antibonding interactions. Color codes in DOS curves are as follows: TDOS: bold black outline; Ca PDOS: gray region; Yb PDOS: magenta region; Zn TDOS: yellow region; Cu PDOS: green region; Sb PDOS: sky blue region.
The ELF calculations were conducted as well for these two structural models to analyze the different distributions of lone-pairs of electrons on the bridging Sb4 in two structural models. As shown in Figure 6, two lone-pairs of electrons on Sb4 merged together producing the “C-shaped” electron densities. In addition, due to the stronger electron withdrawing ability of Cu than Zn, these lone-pairs in the Cu-containing compound shown in Figure 6B were further spread out toward the Cu-substituents in

Figure 6. ELF analysis illustrating the electron lone-pairs associated with the bridging Sb4 in (A) Ca9Zn4.5Sb9 and (B)
To understand the affinity of Yb for the A3 site, the QVAL of the five cationic sites in the ternary
QVAL and volume of the five cationic sites in Ca9Zn4.5Sb9
| Atom (Wyckoff site) | Ca1 (4h) | Ca2 (4h) | Ca3 (4h) | Ca4 (4g) | Ca5 (2a) |
| QVAL | 1.800 | 2.279 | 2.336 | 2.312 | 2.215 |
| Volume (Å3) | 50.82 | 57.80 | 63.72 | 62.29 | 73.17 |
Thermoelectric properties measurements
To investigate the effects of cationic substitution with divalent Yb and anionic p-type substitution with monovalent Cu, the temperature-dependent TE properties were measured across a temperature range of 323 to 861 K.
First, Figure 7A shows the temperature-dependent electrical conductivities σ of four title compounds. All compounds exhibited decreasing electrical conductivity σ with increasing temperature which is a characteristic typical of a heavily doped degenerate semiconductor. The measured σ values at 323 K were 243.4, 434.1, 542.8, 567.9, and 430.4 S/cm for Ca9Zn4.5Sb9[19], Ca8YbZn4.5Sb9, Ca8YbZn4.45Cu0.05Sb9,
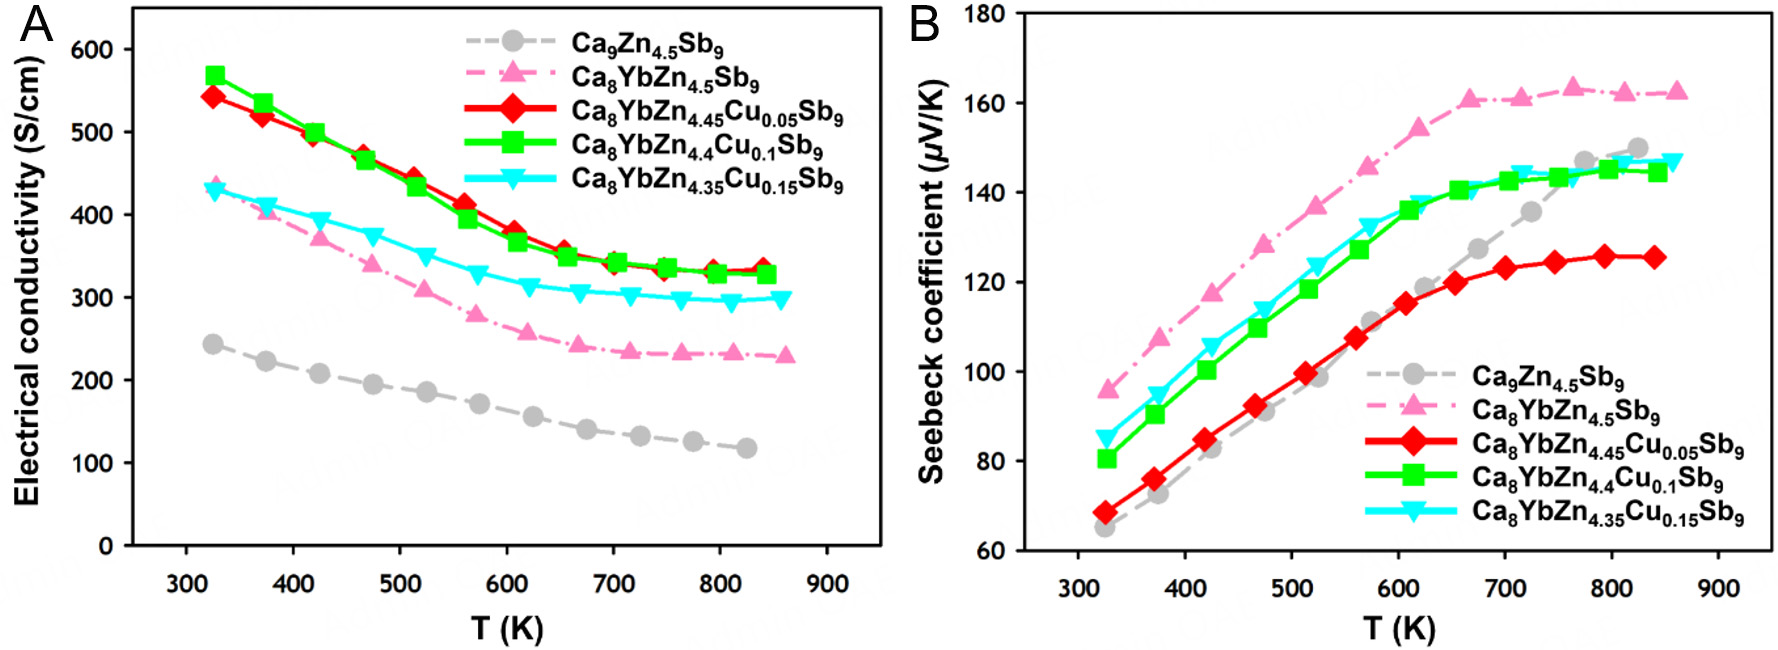
Figure 7. For four compounds in the Ca8YbZn4.5-yCuySb9 (0 ≤ y ≤ 0.15) system, temperature-dependent (A) electrical conductivity σ and (B) Seebeck coefficient S are plotted over the range of 323 to 861 K. Corresponding data for the ternary Ca9Zn4.5Sb9[19] compound are presented for comparison.
In particular, the σ values were higher in one quaternary compound with the Yb substitution and three quinary compounds with the Yb and Cu co-substitution compared to in the ternary parental compound
Hall effect measurement results for the three title compounds
| Compound | Carrier concentration n (× 1020 carriers/cm3) | Mobility η (cm2/V·s) |
| Ca9Zn4.5Sb9[19] | 0.607 | 48.966 |
| Ca8YbZn4.5Sb9 | 0.663 | 47.705 |
| Ca8YbZn4.4Cu0.1Sb9 | 0.700 | 28.864 |
| Ca8YbZn4.35Cu0.15Sb9 | 1.264 | 23.755 |
The temperature-dependent Seebeck coefficients S of the title compounds are displayed in Figure 7B. The S values in all studied cases increased with temperature up to ca. 700 K, and then the values were saturated beyond 700 K. The maximum S values were 149.9, 163.2, 125.5, 144.5, and 147.2 μV/K for Ca9Zn4.5Sb9[19],
Figure 8A shows the temperature-dependent thermal conductivity κtot of the title compounds with minimum κtot values of 0.57, 0.82, 0.76, 0.70, and 1.00 W/mK for Ca9Zn4.5Sb9[19], Ca8YbZn4.5Sb9,

Figure 8. For four compounds in the Ca8YbZn4.5-yCuySb9 (0 ≤ y ≤ 0.15) system, temperature-dependent (A) total thermal conductivity
The magnitude of κtot for the three co-substituted compounds exhibited decreasing patterns down to
Ultimately, the temperature-dependent ZT was calculated and displayed in Figure 8B. Overall, the ZT for all title compounds showed an increasing trend up to 861 K. Among these title compounds, Ca8YbZn4.4Cu0.1Sb9 attained a maximum ZT of 0.81 at 843 K, representing an improvement over the ternary parental compound Ca9Zn4.5Sb9. In addition, the previously reported Cu-doped Ca9Zn4.35Cu0.15Sb9[38] showed a ZT of 0.72 at 873 K. Therefore, the highest ZT of our quaternary Ca8YbZn4.4Cu0.1Sb9 should be attributed to the enhanced σ and S resulting from the co-substitution of Yb and Cu compared to Ca9Zn4.5Sb9. While the total thermal conductivity of Ca8YbZn4.4Cu0.1Sb9 displayed an increase in comparison to Ca9Zn4.5Sb9, the enhanced σ was found to possess a disproportionately large influence over the overall TE properties.
CONCLUSIONS
A series of seven title compounds in the Ca9-xYbxZn4.5-yCuySb9 (0 ≤ x ≤ 1.50, 0 ≤ y ≤ 0.15) system were prepared using the molten Pb-flux and hot-pressing method. Structural analyses revealed that all samples crystallized in the orthorhombic Ca9Mn4Bi9-type structure (Pbam space group), as confirmed by PXRD and SXRD refinements. The chemical compositions were further validated through EDS and EPMA analysis, which also confirmed the partial substitutions Cu for Zn and Yb for Ca. Notably, the Zn1 site exhibited a partial occupancy with a relatively large ADP which was an intrinsic structural feature of this structure type. The structural refinement indicated that Yb displayed a specific site-preference for the A3 site, and this site-preference was attributed to the QVAL-based electronic factor rather than the size factor. Electronic structure calculations using the TB-LMTO methods revealed that the p-type Cu doping indeed led to increased carrier concentrations and eventually to improved electrical conductivities. The ELF analysis further demonstrated that the Cu substitution altered the bond polarity within the anionic frameworks, improving carrier concentration and finally electrical conductivities. TE property measurements proved that the co-substitution of Yb and Cu significantly increased the σ compared to that of the parental compound Ca9Zn4.5Sb9 despite the reduced carrier mobility. This observation demonstrated that the increased carrier concentration had a more significant effect on electrical conductivity than the decreased carrier mobility. The increase in σ also led to an enhancement in the κelec, which caused an overall increase in the κtot. However, the increase in phonon scattering by the Yb and Cu co-substitution resulted in the reduction in κlatt, which suppressed the overall rise in κtot. As a result of these combinations, the optimized TE performance was achieved in Ca8YbZn4.4Cu0.1Sb9 with the maximum ZT of 0.81 computed at 843 K.
DECLARATIONS
Authors’ contributions
Designed the experiment: Seo, N.; You, T. S.
Wrote the manuscript: Seo, N.; You, T. S.
Data analysis: Seo, N.; Lee, J.
Performed the physical characterization: Seo, N.; Lee, J.; Lee, Y.; Pi, J. H.; Lee, K. H.
Performed the SXRD measurements: Choi, M. H.; Ok, K. M.
Revised the manuscript: Lee, J.; You, T. S.
Acquired funding: Lee, K. H.; You, T. S.
Supervised students and developed concepts: You, T. S.
Availability of data and materials
The original supplementary crystallographic data for this study is openly available in the Cambridge Crystallographic Data Center (12 Union Road, Cambridge CB21EZ, UK; fax: +44-1223-336033) at www.ccdc.cam.ac.uk/data_request/cif (accessed on 10 February 2025), or by emailing [email protected]. The reference/accession number to be used is CCDC 2422809-2422812. Furthermore, the raw data supporting the conclusions of this article will be made available by the authors on request.
Financial support and sponsorship
This work was supported by the Basic Science Research Program through the National Research Foundation of Korea (NRF), funded by the Ministry of Science and ICT (RS-2024-00337629 and RS-2022-NR068194).
Conflicts of interest
All authors declared that there are no conflicts of interest.
Ethical approval and consent to participate
Not applicable.
Consent for publication
Not applicable.
Copyright
© The Author(s) 2025.
Supplementary Materials
REFERENCES
1. Qin, B.; Kanatzidis, M. G.; Zhao, L. D. The development and impact of tin selenide on thermoelectrics. Science 2024, 386, eadp2444.
2. Jia, Y.; Jiang, Q.; Sun, H.; et al. Wearable thermoelectric materials and devices for self-powered electronic systems. Adv. Mater. 2021, 33, 2102990.
3. Shuai, J.; Ge, B.; Mao, J.; Song, S.; Wang, Y.; Ren, Z. Significant role of Mg stoichiometry in designing high thermoelectric performance for Mg3(Sb,Bi)2-based n-type Zintls. J. Am. Chem. Soc. 2018, 140, 1910-5.
4. Justl, A. P.; Ricci, F.; Pike, A.; et al. Unlocking the thermoelectric potential of the Ca14AlSb11 structure type. Sci. Adv. 2022, 8, eabq3780.
5. Justl, A. P.; Kauzlarich, S. M. Probing high-temperature oxidation of thermoelectric phases Yb14MSb11 (M = Mg, Mn, Zn). ACS. Appl. Mater. Interfaces. 2022, 14, 47246-54.
6. Guo, K.; Cao, Q.; Zhao, J. Zintl phase compounds AM2Sb2 (A=Ca, Sr, Ba, Eu, Yb; M=Zn, Cd) and their substitution variants: a class of potential thermoelectric materials. J. Rare. Earths. 2013, 31, 1029-38.
7. Jeong, J.; Shim, D.; Yox, P.; et al. Tuning the radius ratio to enhance thermoelectric properties in the Zintl compounds AM2Sb2 (A = Ba, Sr; M = Zn, Cd). Chem. Mater. 2023, 35, 3985-97.
8. Lee, J.; Kim, M.; Pi, J. H.; et al. Insights into the crystal structure and thermoelectric properties of the Zintl phase Ca9Cd3+x-yMx+ySb9 (M = Cu, Zn) system. Chem. Mater. 2025, 37, 368-77.
9. Chen, C.; Xue, W.; Li, X.; et al. Enhanced thermoelectric performance of Zintl phase Ca9Zn4+xSb9 by beneficial disorder on the selective cationic site. ACS. Appl. Mater. Interfaces. 2019, 11, 37741-7.
10. Bux, S. K.; Zevalkink, A.; Janka, O.; et al. Glass-like lattice thermal conductivity and high thermoelectric efficiency in Yb9Mn4.2Sb9. J. Mater. Chem. A. 2014, 2, 215-20.
11. Kazem, N.; Zaikina, J. V.; Ohno, S.; Snyder, G. J.; Kauzlarich, S. M. Coinage-metal-stuffed Eu9Cd4Sb9: metallic compounds with anomalous low thermal conductivities. Chem. Mater. 2015, 27, 7508-19.
12. Brechtel, E.; Cordier, G.; Schafer, H. Darstellung und kristallstruktur von Ca9Mn4Bi9 und Ca9Zn4Bi9/Preparation and crystal structure of Ca9Mn4Bi9 and Ca9Zn4Bi9. Z. Naturforsch. 1979, 34, 1229-33.
13. Liu, X. C.; Wu, Z.; Xia, S. Q.; Tao, X. T.; Bobev, S. Structural variability versus structural flexibility. A case study of Eu9Cd4+xSb9 and Ca9Mn4+xSb9 (x ≈ 1/2). Inorg. Chem. 2015, 54, 947-55.
14. Liu, X. C.; Liu, K. F.; Wang, Q. Q.; Wang, Y. M.; Pan, M. Y.; Xia, S. Q. Exploring new Zintl phases in the 9-4-9 family via Al substitution. Synthesis, structure, and physical properties of Ae9Mn4-xAlxSb9 (Ae = Ca, Yb, Eu). Inorg. Chem. 2020, 59, 3709-17.
15. Wang, Y.; Bobev, S. Rare-earth metal substitutions in Ca9-xRExMn4Sb9 (RE = La-Nd, Sm; x ≈ 1). Synthesis and characterization of a new series of narrow-gap semiconductors. Chem. Mater. 2018, 30, 3518-27.
16. Smiadak, D. M.; Baranets, S.; Rylko, M.; et al. Single crystal growth and characterization of new Zintl phase Ca9Zn3.1In0.9Sb9. J. Solid. State. Chem. 2021, 296, 121947.
17. Uvarov, C. A.; Ortega-Alvarez, F.; Kauzlarich, S. M. Enhanced high-temperature thermoelectric performance of Yb14-xCaxMnSb11. Inorg. Chem. 2012, 51, 7617-24.
18. Shuai, J.; Wang, Y.; Liu, Z.; et al. Enhancement of thermoelectric performance of phase pure Zintl compounds Ca1-xYbxZn2Sb2,
19. Ohno, S.; Aydemir, U.; Amsler, M.; et al. Achieving zT > 1 in inexpensive Zintl phase Ca9Zn4+xSb9 by phase boundary mapping. Adv. Funct. Mater. 2017, 27, 1606361.
20. APEX2, Version 2013.6-2. Madison, WI: Bruker AXS Inc., 2013.
21. SAINT. Madison, WI: Bruker AXS Inc., 2002.
22. Sheldrick, G. M. SADABS. Göttingen: University of Göttingen, 2003.
23. Gelato, L. M.; Parthé, E.
25. Andersen, O. K.; Jepsen, O. Explicit, first-principles tight-binding theory. Phys. Rev. Lett. 1984, 53, 2571-4.
26. Lambrecht, W. R. L.; Andersen, O. K. Minimal basis sets in the linear muffin-tin orbital method: application to the diamond-structure crystals C, Si, and Ge. Phys. Rev. B. Condens. Matter. 1986, 34, 2439.
27. Jepsen, O.; Andersen, O. K. The STUTTGART TB-LMTO program. Available from: https://www2.fkf.mpg.de/andersen/LMTODOC/LMTODOC.html [Last accessed on 25 Jun 2025].
28. Andersen, O. K.; Jepsen, O.; Glötzel, D. Canonical description of the band structures of metals. 1985; pp. 65-72. Available from: https://www2.fkf.mpg.de/andersen/docs/pub/85CanonicalVarenna.pdf [Last accessed on 25 Jun 2025].
29. Jepsen, O.; Andersen, O. K. Calculated electronic structure of the sandwichd1 metals LaI2 and CeI2: application of new LMTO techniques. Z. Physik. B. Condensed. Matter. 1995, 97, 35-47.
30. Blöchl, P. E.; Jepsen, O.; Andersen, O. K. Improved tetrahedron method for Brillouin-zone integrations. Phys. Rev. B. Condens. Matter. 1994, 49, 16223-33.
31. Borup, K. A.; de Boor, J.; Wang, H.; et al. Measuring thermoelectric transport properties of materials. Energy. Environ. Sci. 2015, 8, 423-35.
32. Kim, H.; Gibbs, Z. M.; Tang, Y.; Wang, H.; Snyder, G. J. Characterization of Lorenz number with Seebeck coefficient measurement. APL. Mater. 2015, 3, 041506.
33. Xia, S. Q.; Bobev, S. Interplay between size and electronic effects in determining the homogeneity range of the A9Zn4+xPn9 and
34. Bobev, S.; Thompson, J. D.; Sarrao, J. L.; Olmstead, M. M.; Hope, H.; Kauzlarich, S. M. Probing the limits of the Zintl concept: structure and bonding in rare-earth and alkaline-earth zinc-antimonides Yb9Zn4+xSb9 and Ca9Zn4.5Sb9. Inorg. Chem. 2004, 43, 5044-52.
35. Shannon, R. D. Revised effective ionic radii and systematic studies of interatomic distances in halides and chalcogenides. Acta. Cryst. A. 1976, 32, 751-67.
36. Wachter, J. The Elements. Von J. Emsley. Clarendon Press, Oxford 1989. 256 S., Paperback £ 9.95. – ISBN 0-19-855237-8. Angew. Chem. Int. Ed. 1990, 102, 115.
37. Lei, J.; Wuliji, H.; Zhao, K.; et al. Efficient lanthanide Gd doping promoting the thermoelectric performance of Mg3Sb2-based materials. J. Mater. Chem. A. 2021, 9, 25944-53.
Cite This Article
How to Cite
Download Citation
Export Citation File:
Type of Import
Tips on Downloading Citation
Citation Manager File Format
Type of Import
Direct Import: When the Direct Import option is selected (the default state), a dialogue box will give you the option to Save or Open the downloaded citation data. Choosing Open will either launch your citation manager or give you a choice of applications with which to use the metadata. The Save option saves the file locally for later use.
Indirect Import: When the Indirect Import option is selected, the metadata is displayed and may be copied and pasted as needed.
About This Article
Special Issue
Copyright

Data & Comments
Data
0


Comments
Comments must be written in English. Spam, offensive content, impersonation, and private information will not be permitted. If any comment is reported and identified as inappropriate content by OAE staff, the comment will be removed without notice. If you have any queries or need any help, please contact us at [email protected].