


fig4
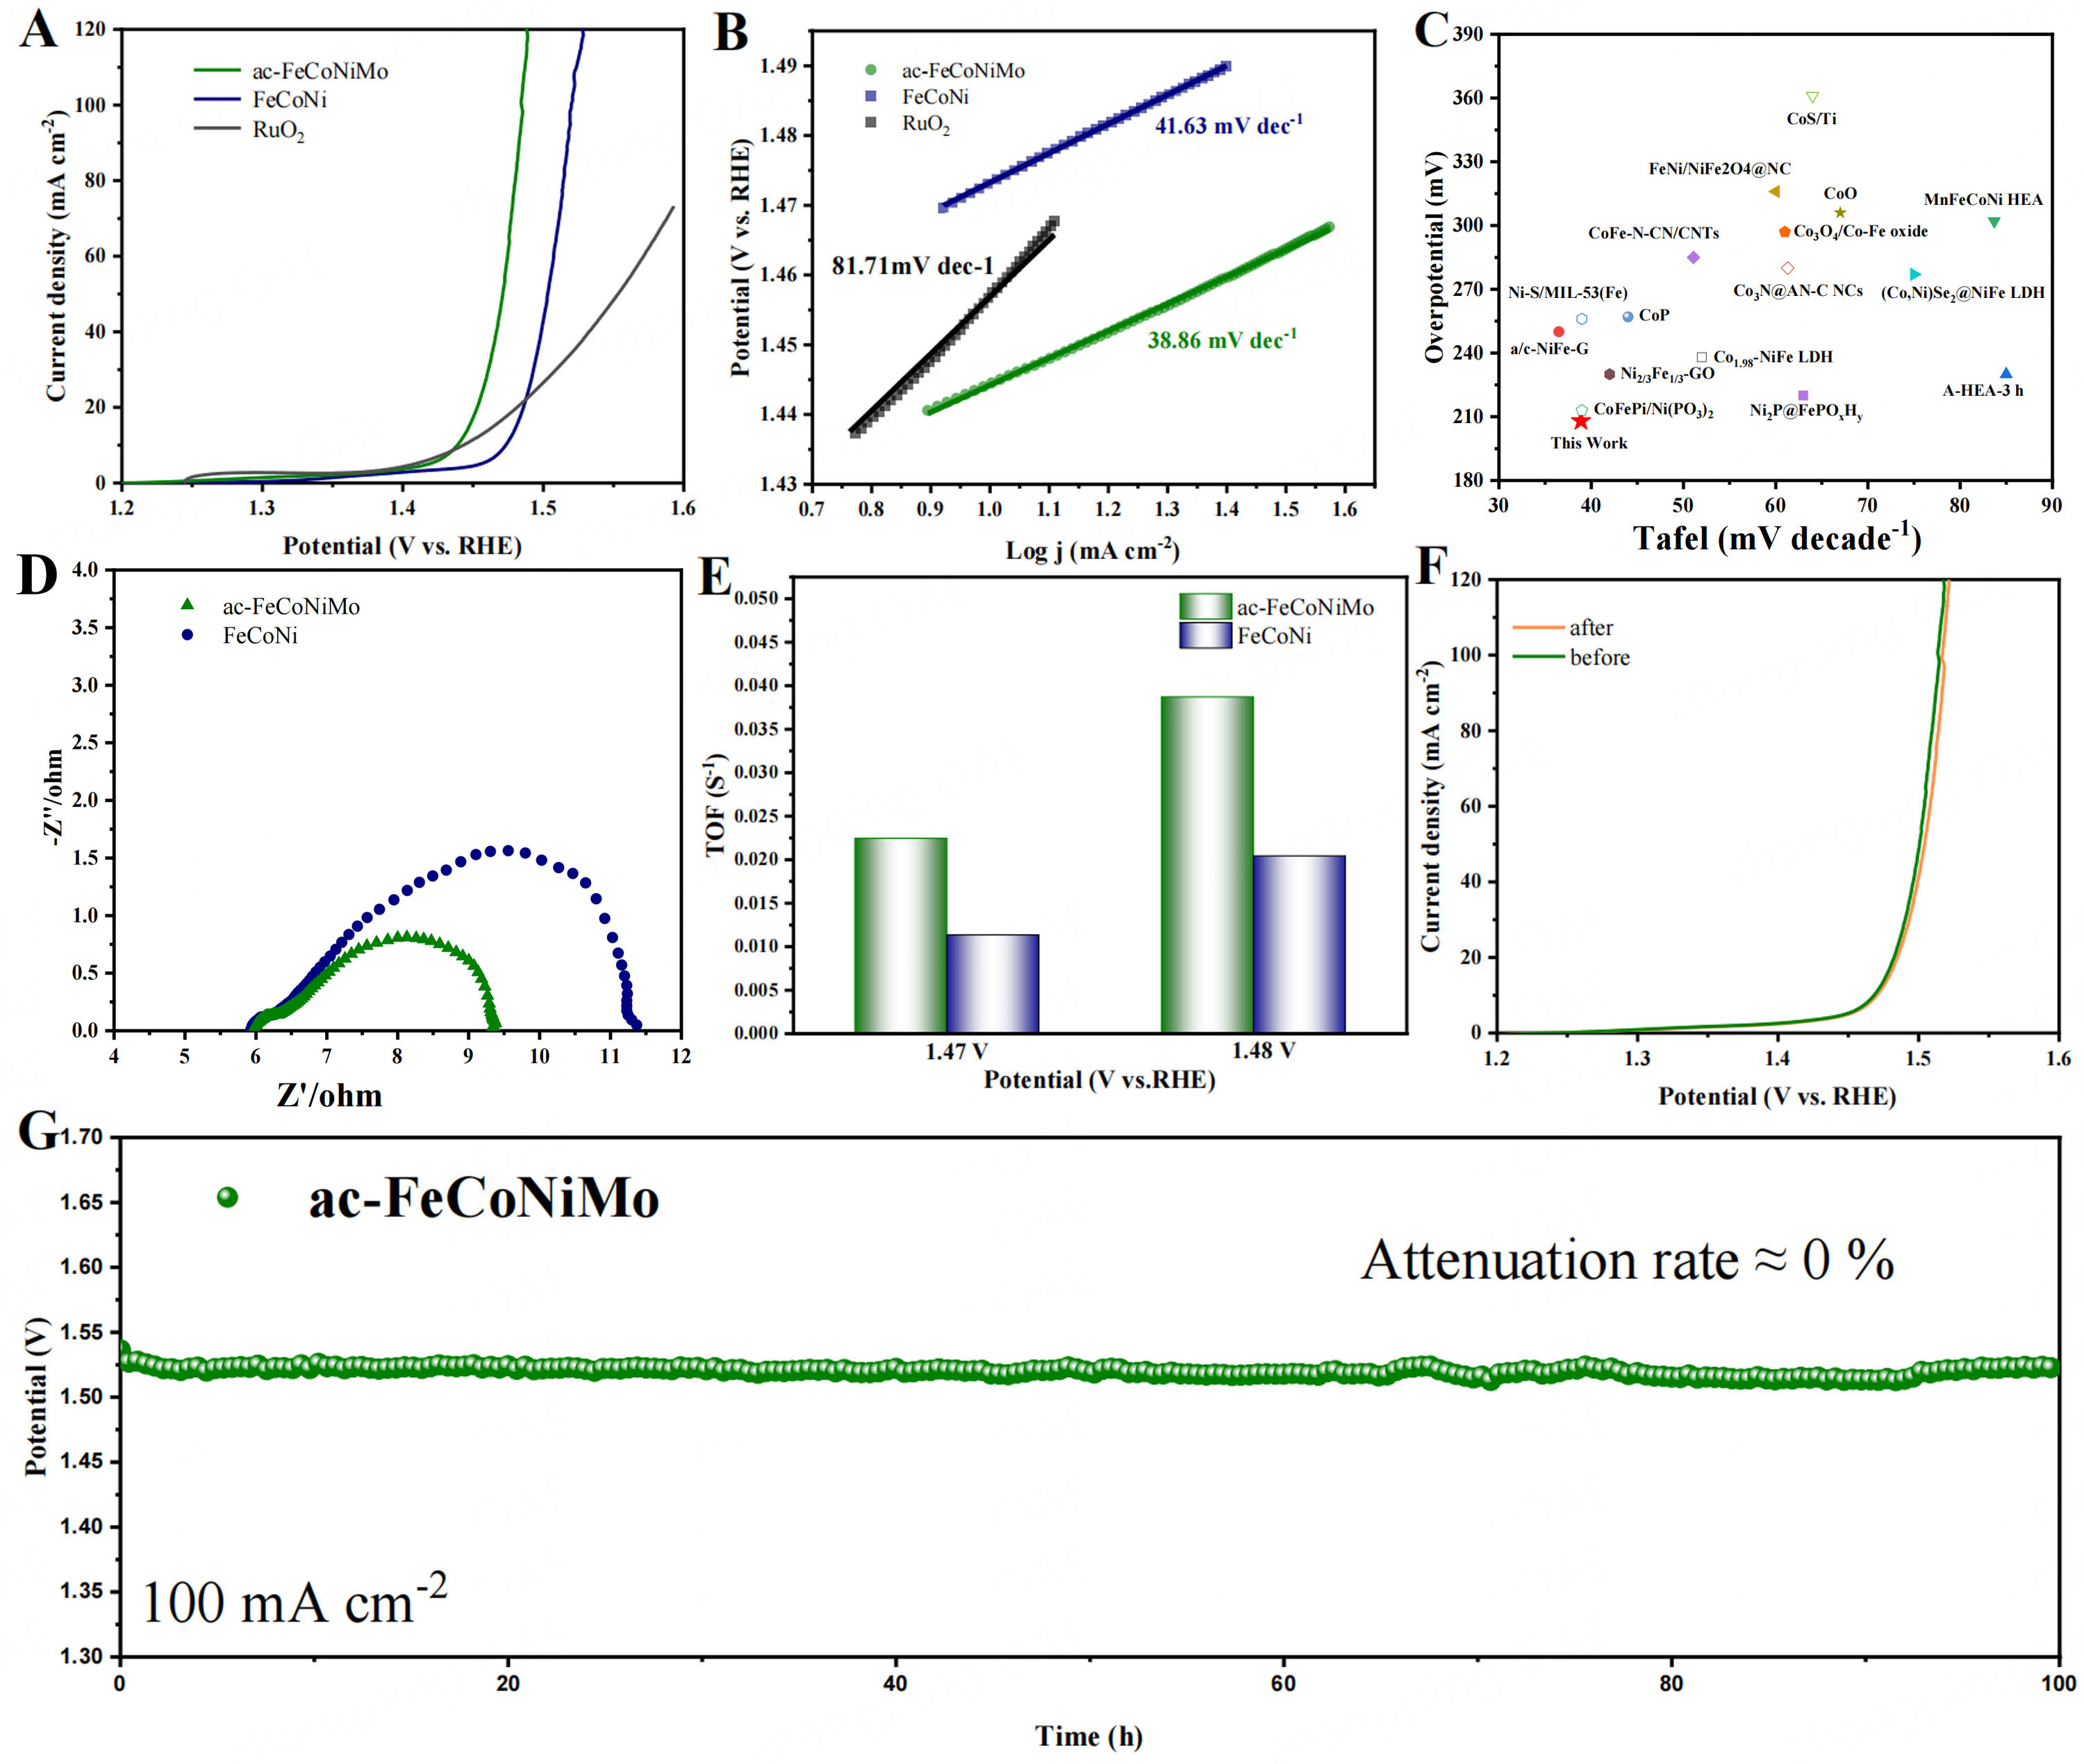
Figure 4. LSV curves (A) and Tafel curves (B) for ac-FeCoNiMo, FeCoNi, and RuO2; (C) EIS diagram of ac-FeCoNiMo and FeCoNi (D) Coordinate diagram of OER electrocatalyst overpotential and Tafel slope; (E) The calculated TOF of ac-FeCoNiMo and FeCoNi at certain overpotentials; (F) LSV diagram of ac-FeCoNiMo before and after 10000 CV cycles of ac-FeCoNiMo and FeCoNi; (G) the long-term stability test of ac-FeCoNiMo. LSV: Linear sweep voltammetry; EIS: electrochemical impedance spectroscopy; OER: oxygen evolution reaction; TOF: turnover frequency.


