


fig9
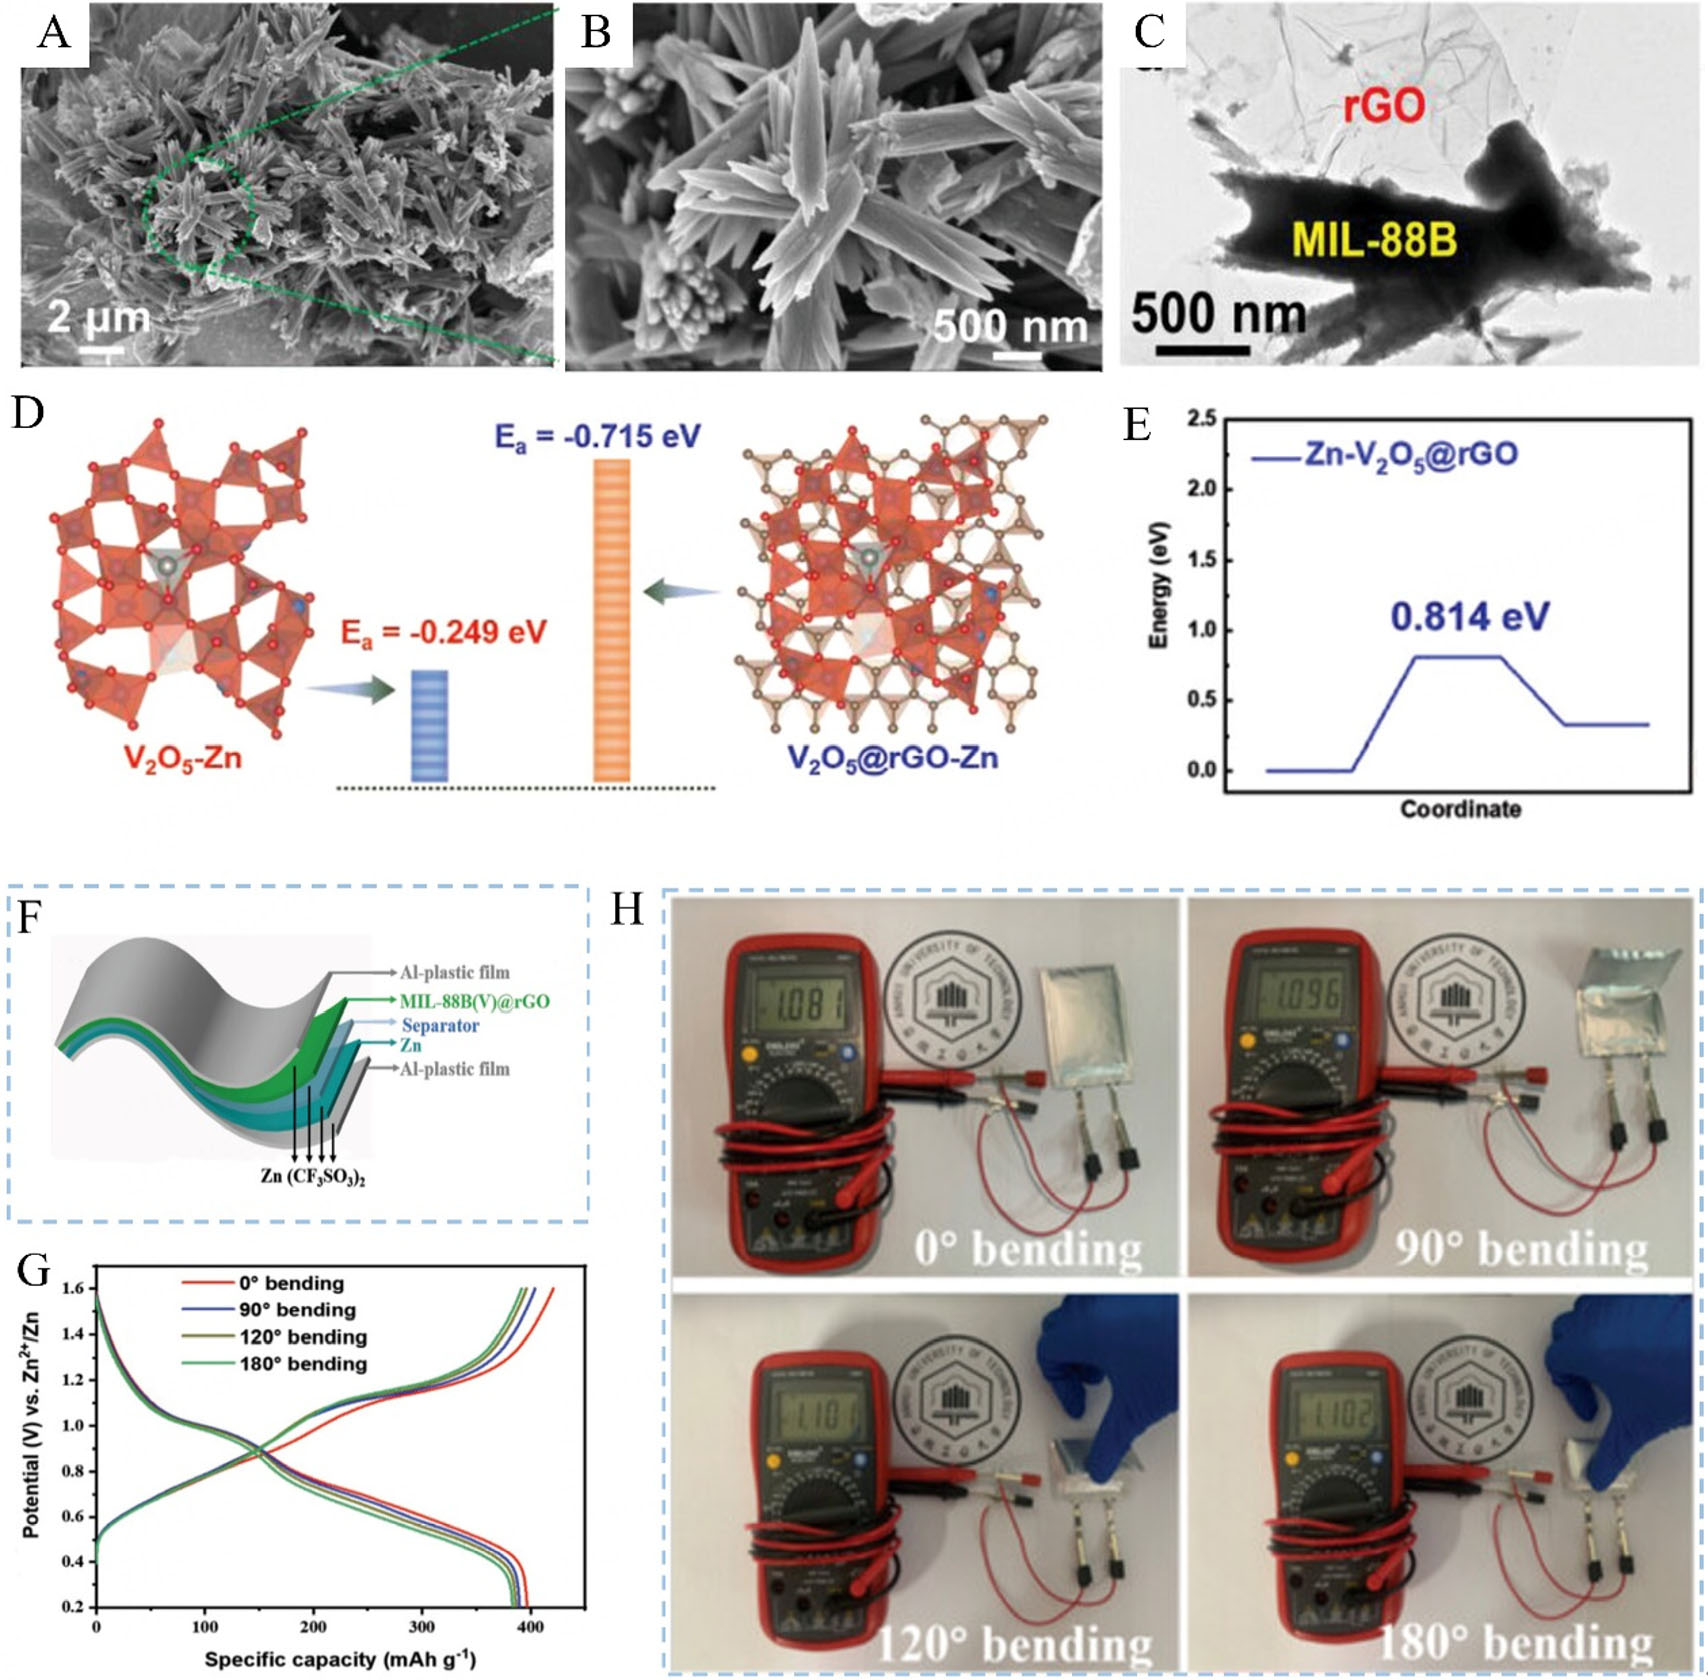
Figure 9. (A and B) SEM and (C) TEM images of MIL-88B(V)@rGO composite; (D) The calculated Zn2+ adsorption energy; (E) The calculated insertion/extraction energy of Zn2+ in amorphous V2O5@rGO; (F) Schematic diagram of a flexible pouch cell; (G) The GCD curves under different bending angles; (H) The voltage of samples bent to different angles. Reproduced with permission from Ref.[114]. Copyright 2024, Wiley. SEM: Scanning electron microscopy; TEM: transmission electron microscopy; GCD: galvanostatic


