


fig16
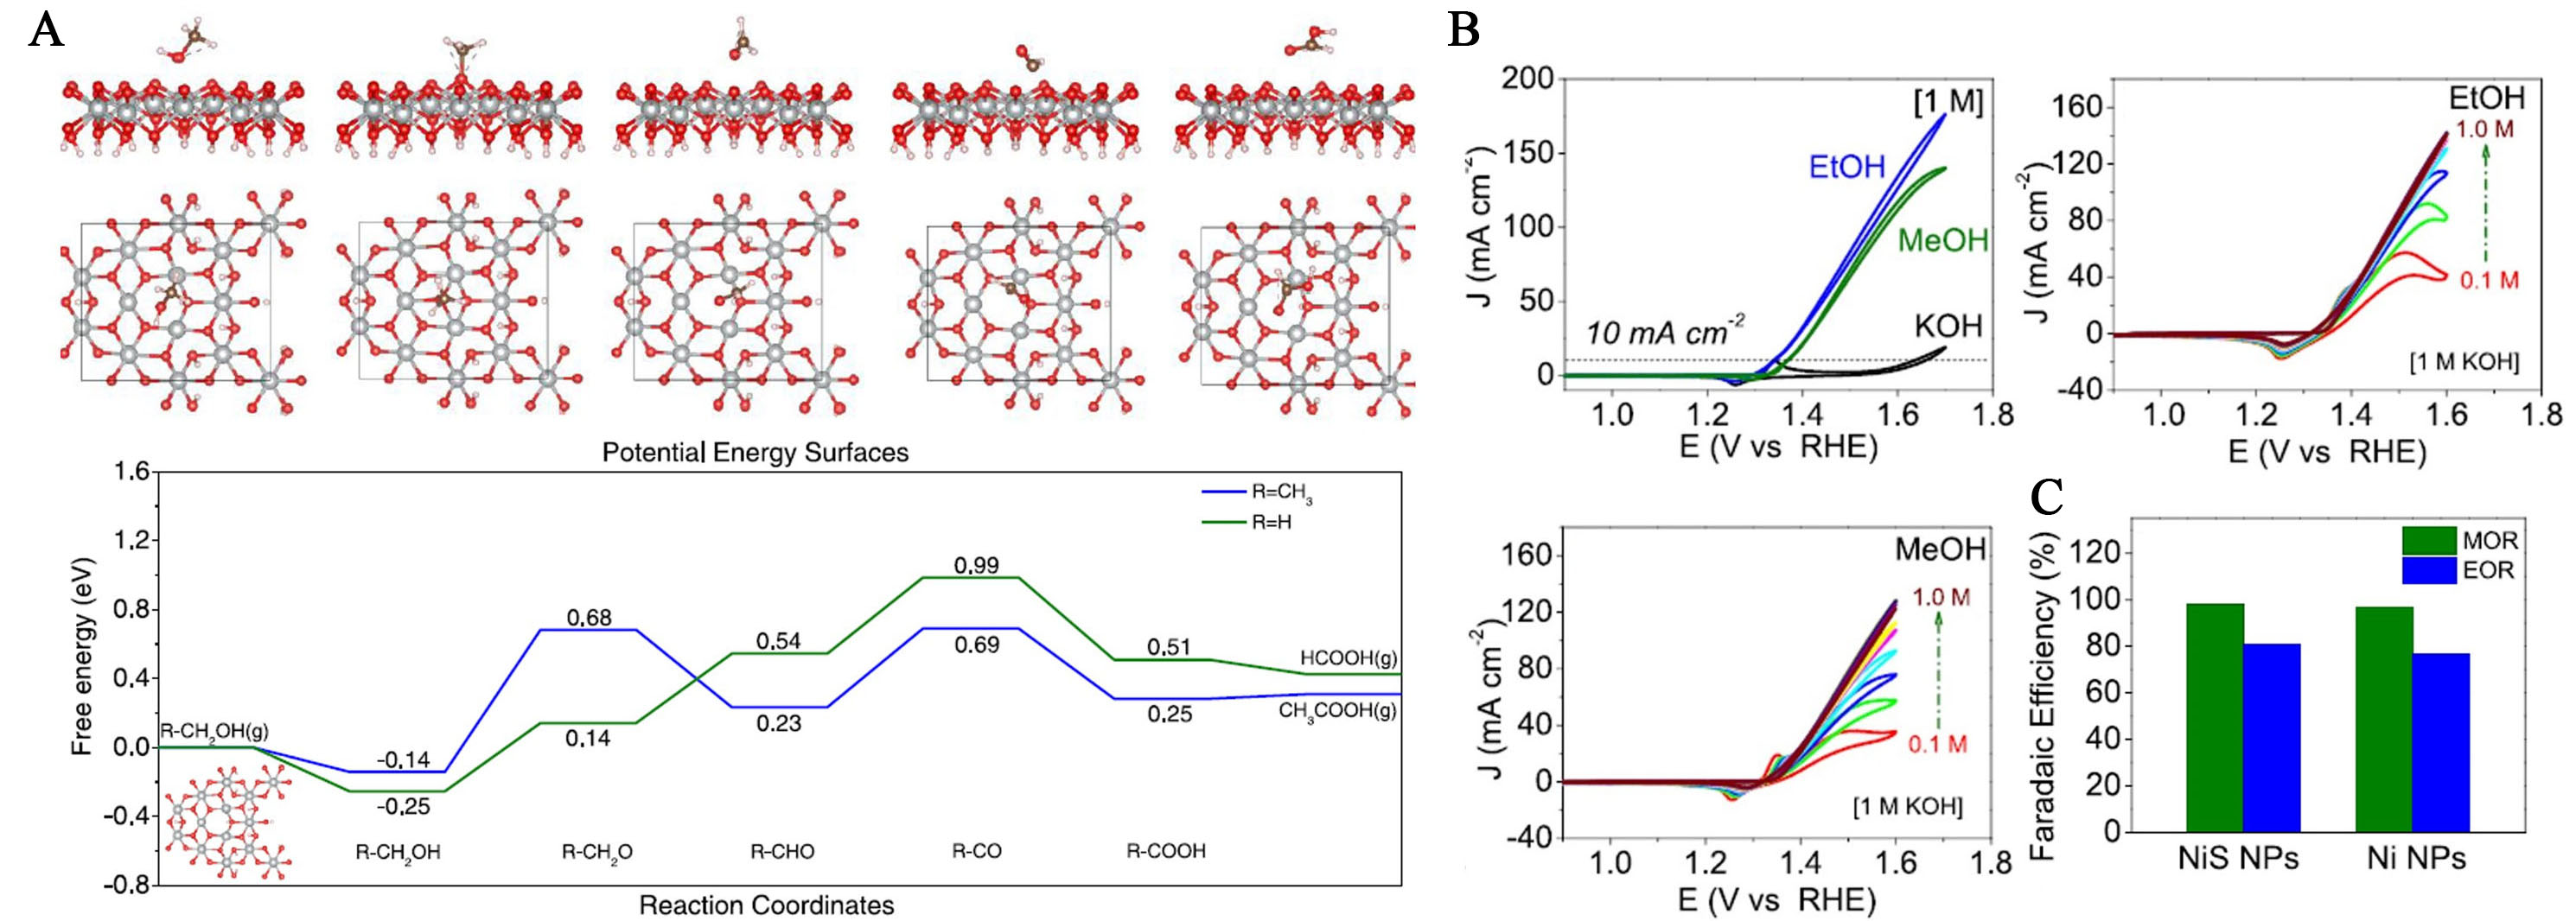
Figure 16. (A) Stable adsorption configurations of intermediates involved in the process of MOR on the NiOOH surface from the side and top view; (B) CV curves without and with 1 M methanol or ethanol at a scan rate of 50 mV s-1. CV curves as a function of methanol and ethanol concentration from 0.1 M to 1 M; (C) Comparison of Faradaic efficiency between the NiS and Ni electrodes[181]. This figure is quoted with permission from Li et al. CV: Cyclic voltammetry; MOR: methanol oxidation reaction.


