


fig8
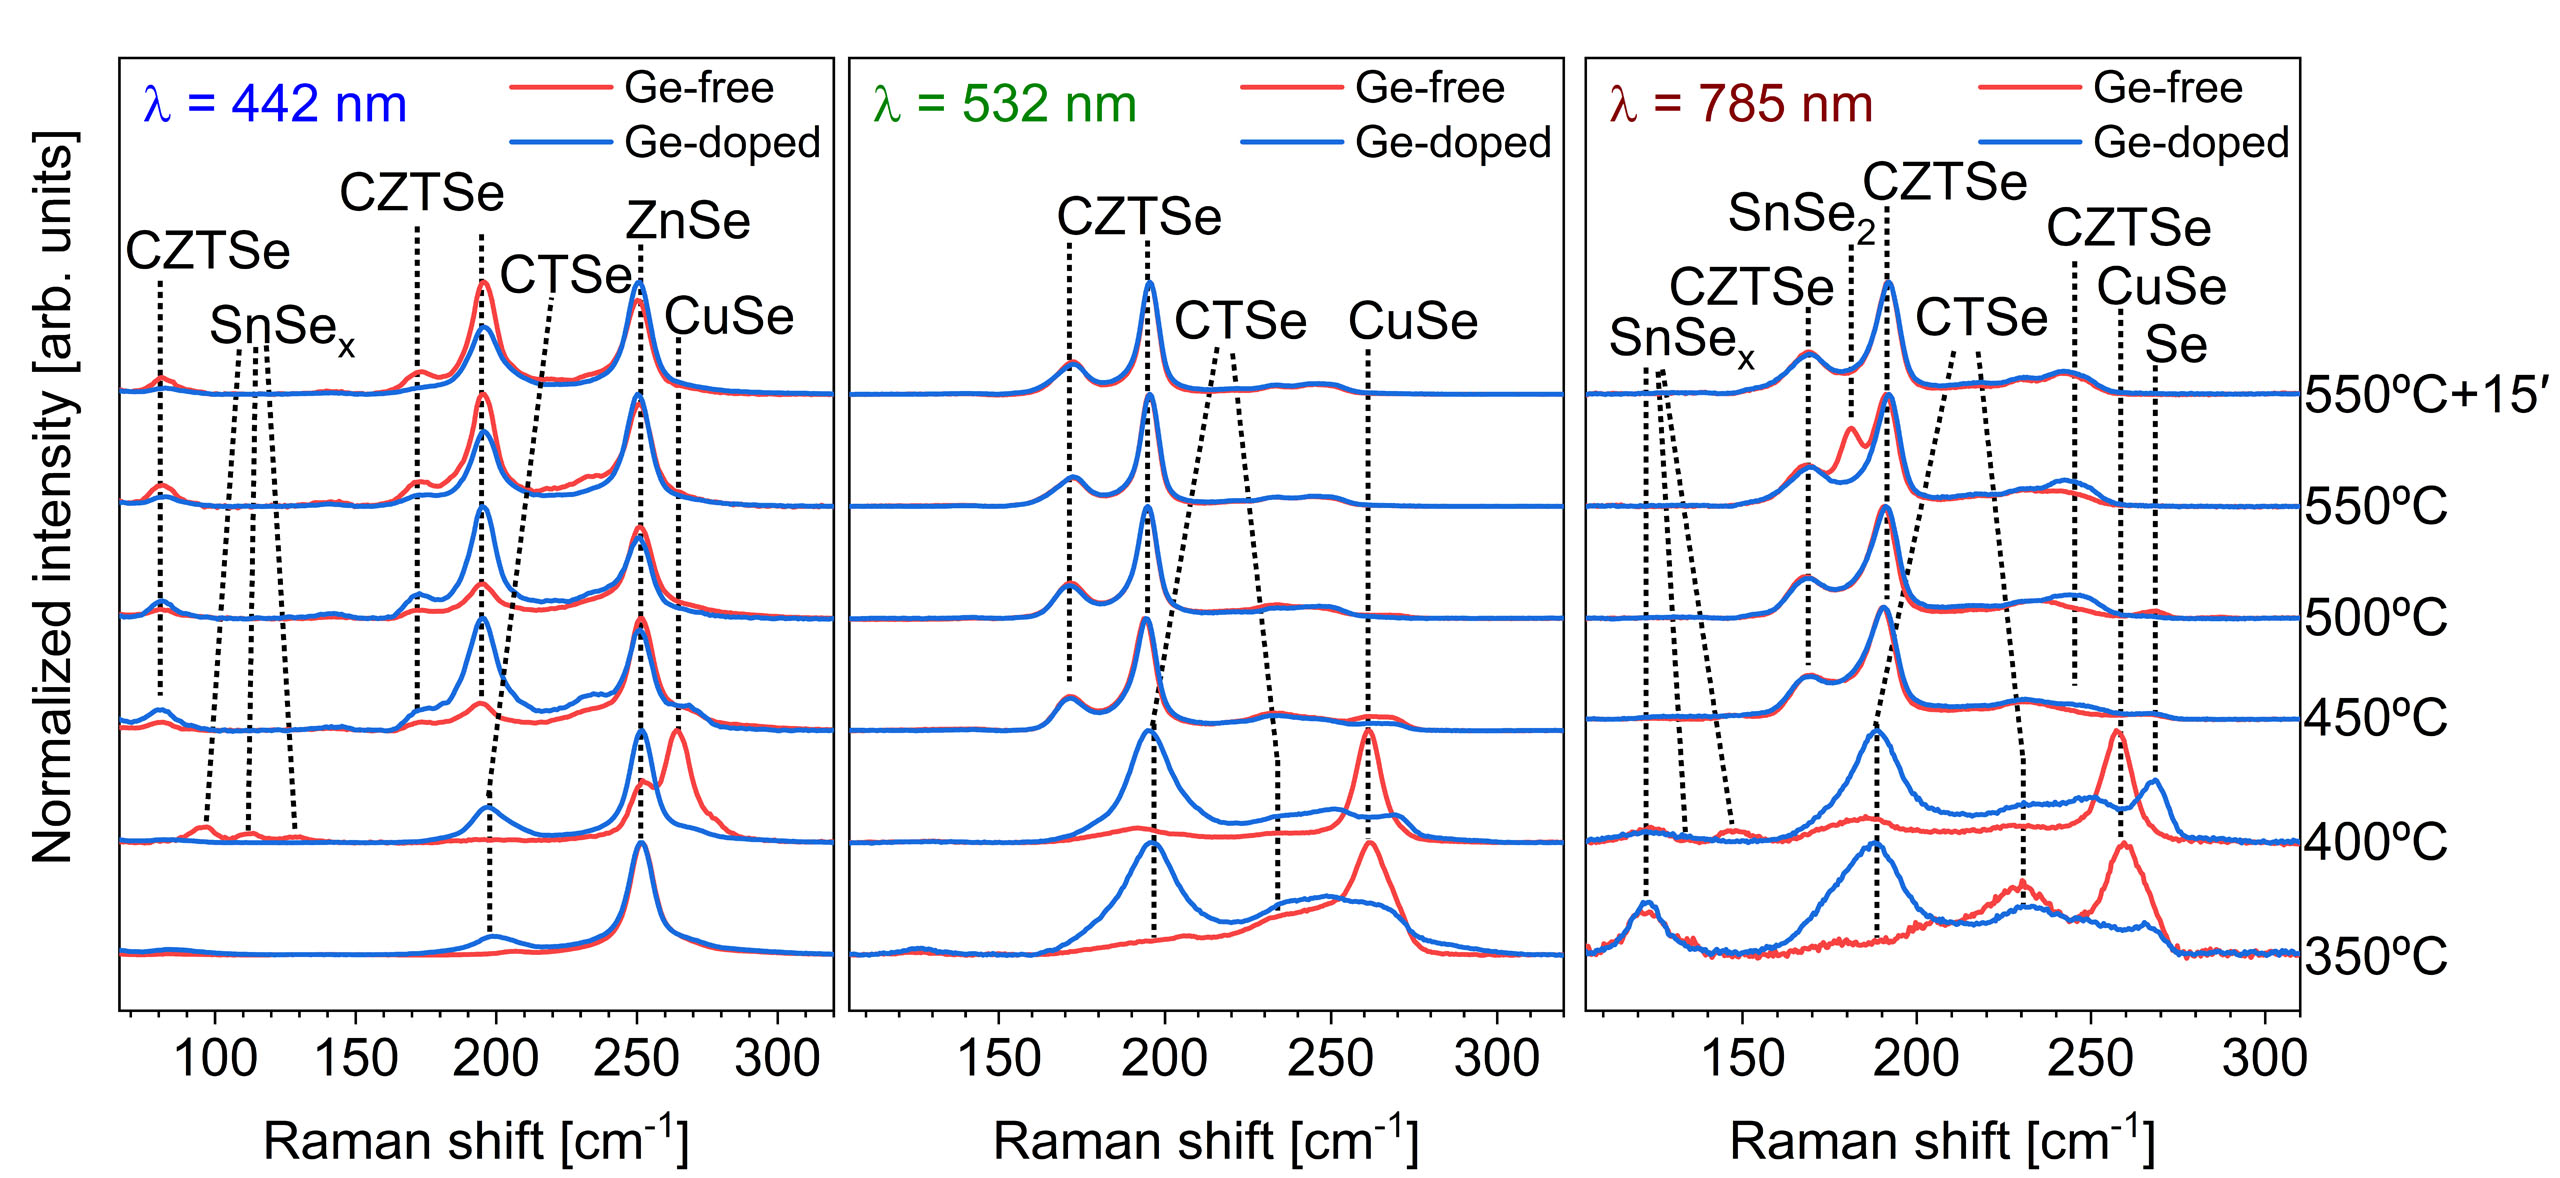
Figure 8. Raman spectra measured under 442 nm, 532 nm, and 785 nm excitation wavelengths of absorbers produced at different stages of a one-step annealing process from Ge-free and Ge-doped bronze-based precursors. Each spectrum is normalized to the maximum peak of the corresponding spectrum.


