fig3

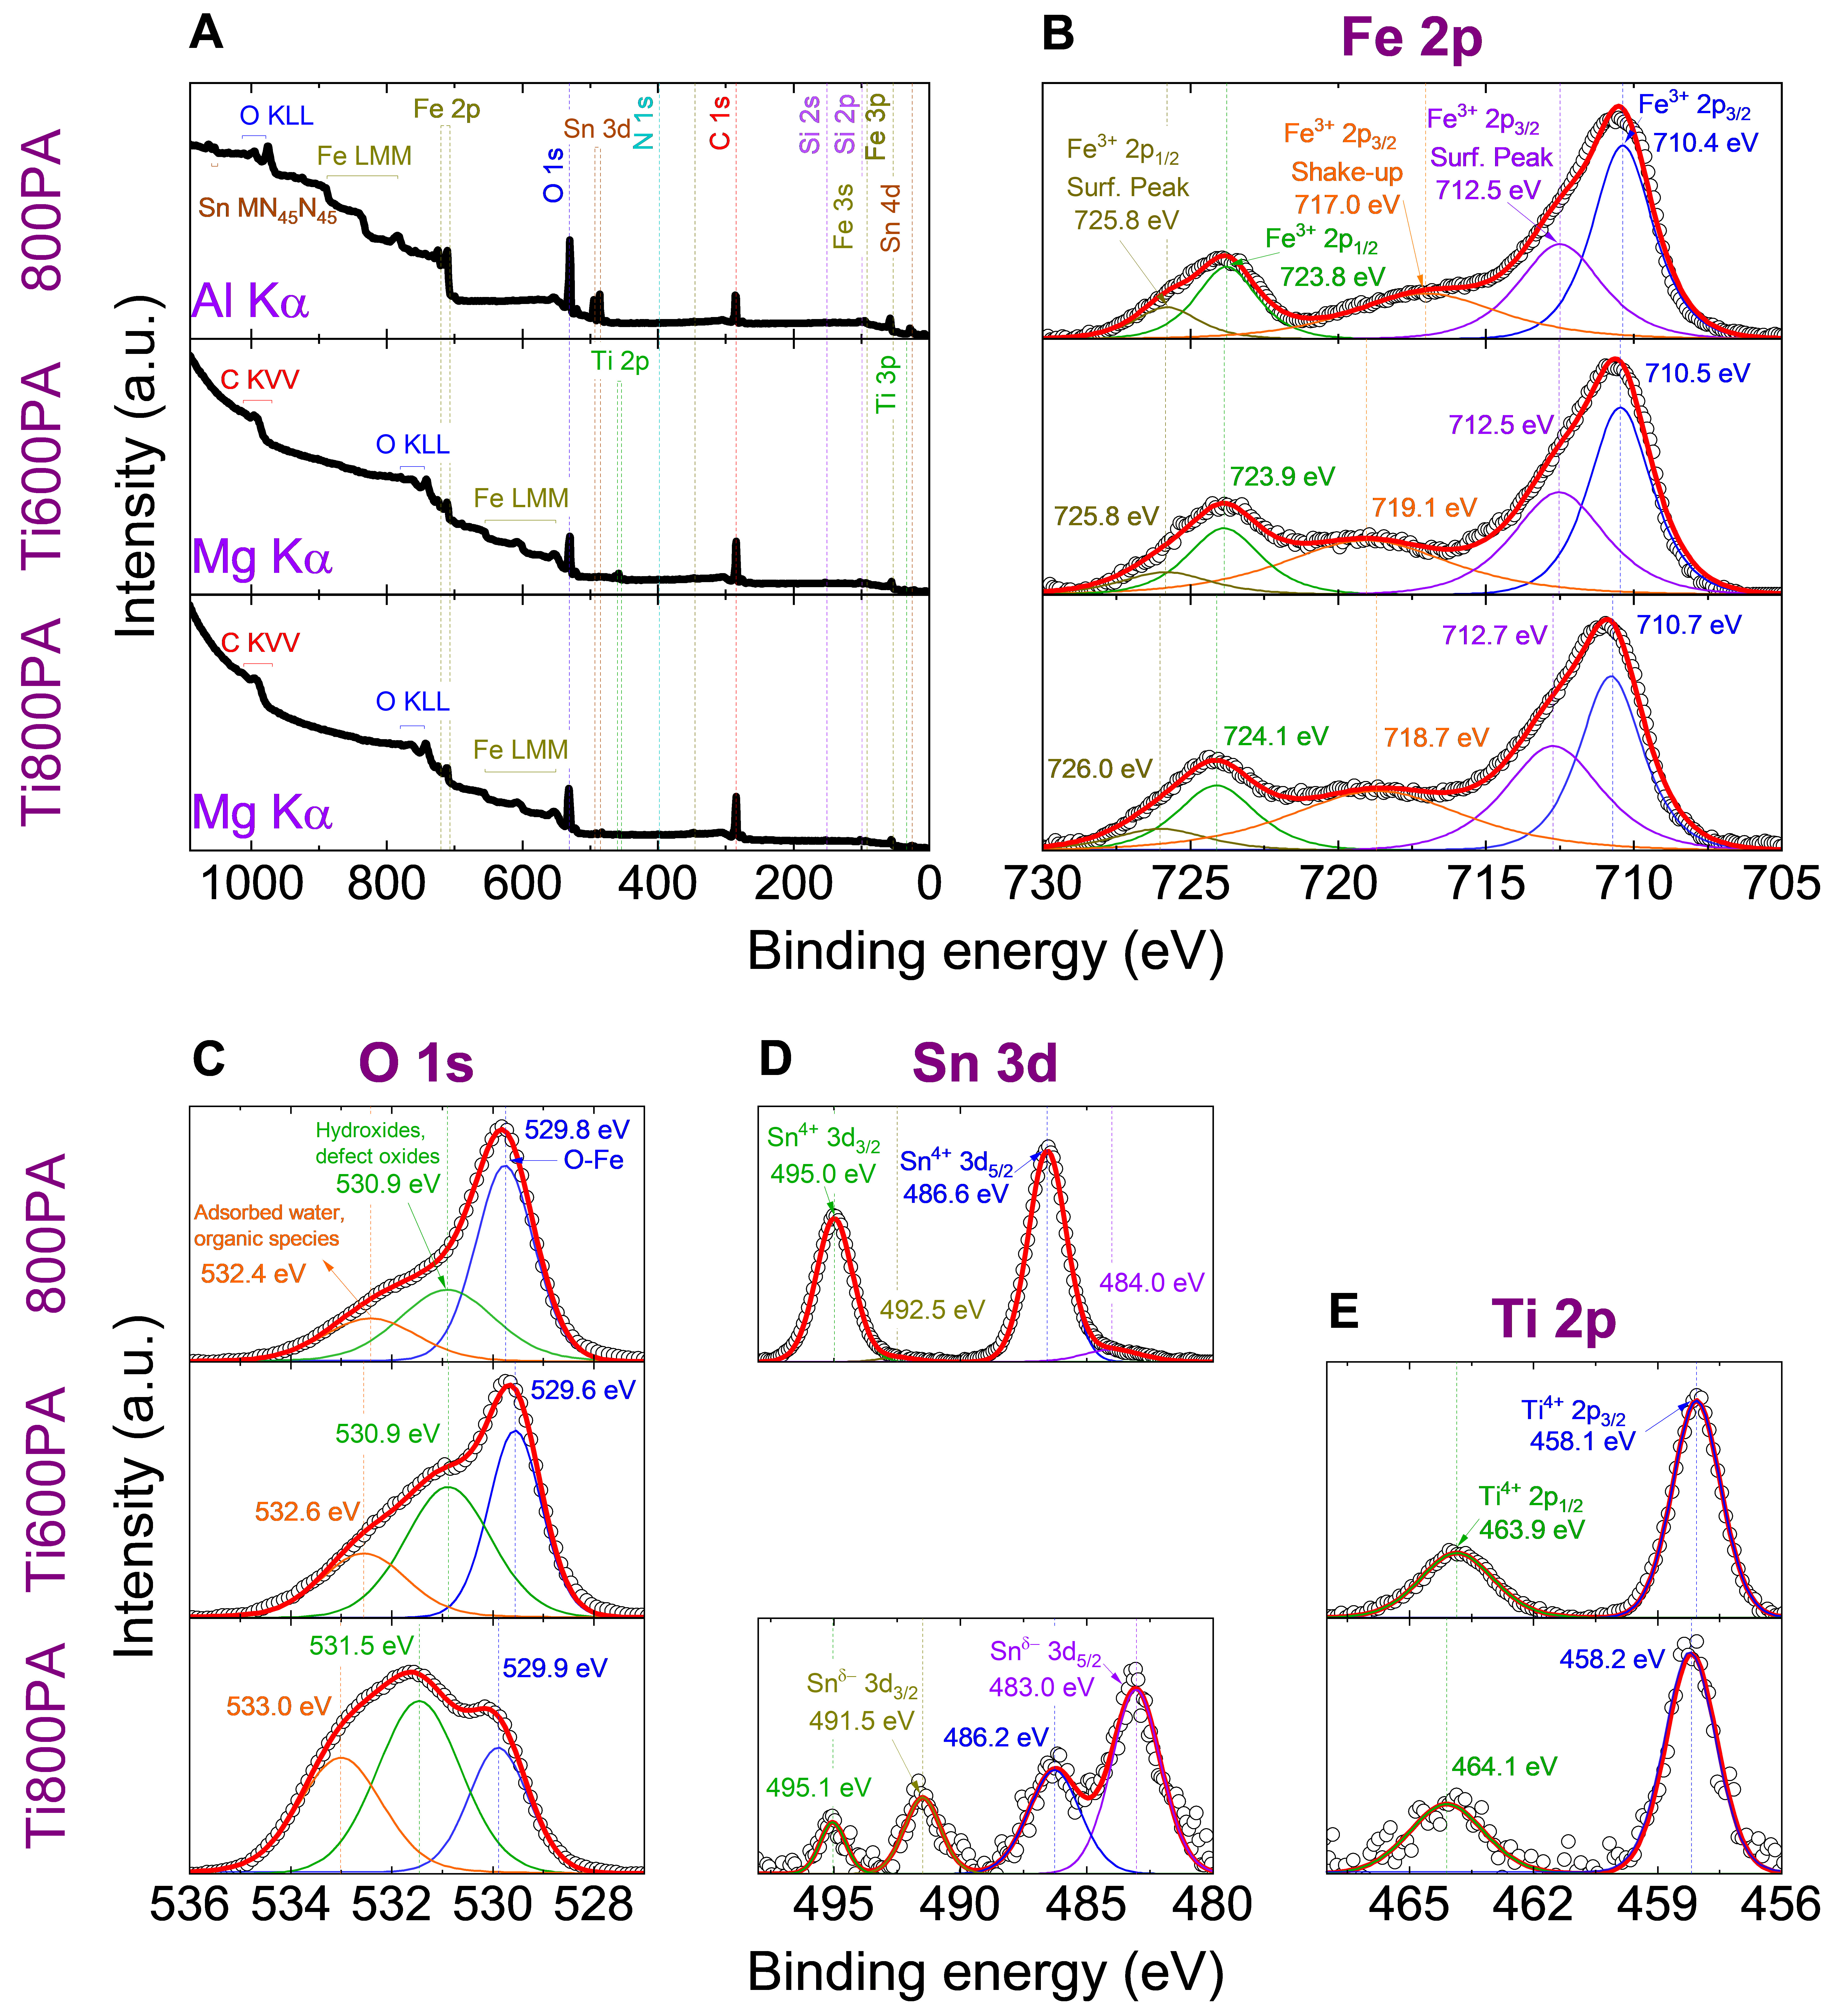
Figure 3. XPS spectra collected from the 800PA, Ti600PA and Ti800PA photoanodes: (A) full survey; (B) Fe 2p; (C) O 1s; (D) Sn 3d; (E) Ti 2p. For high-resolution spectra, the background was deduced by applying a Shirley baseline model. XPS: X-ray photoelectron spectroscopy.


