

fig2
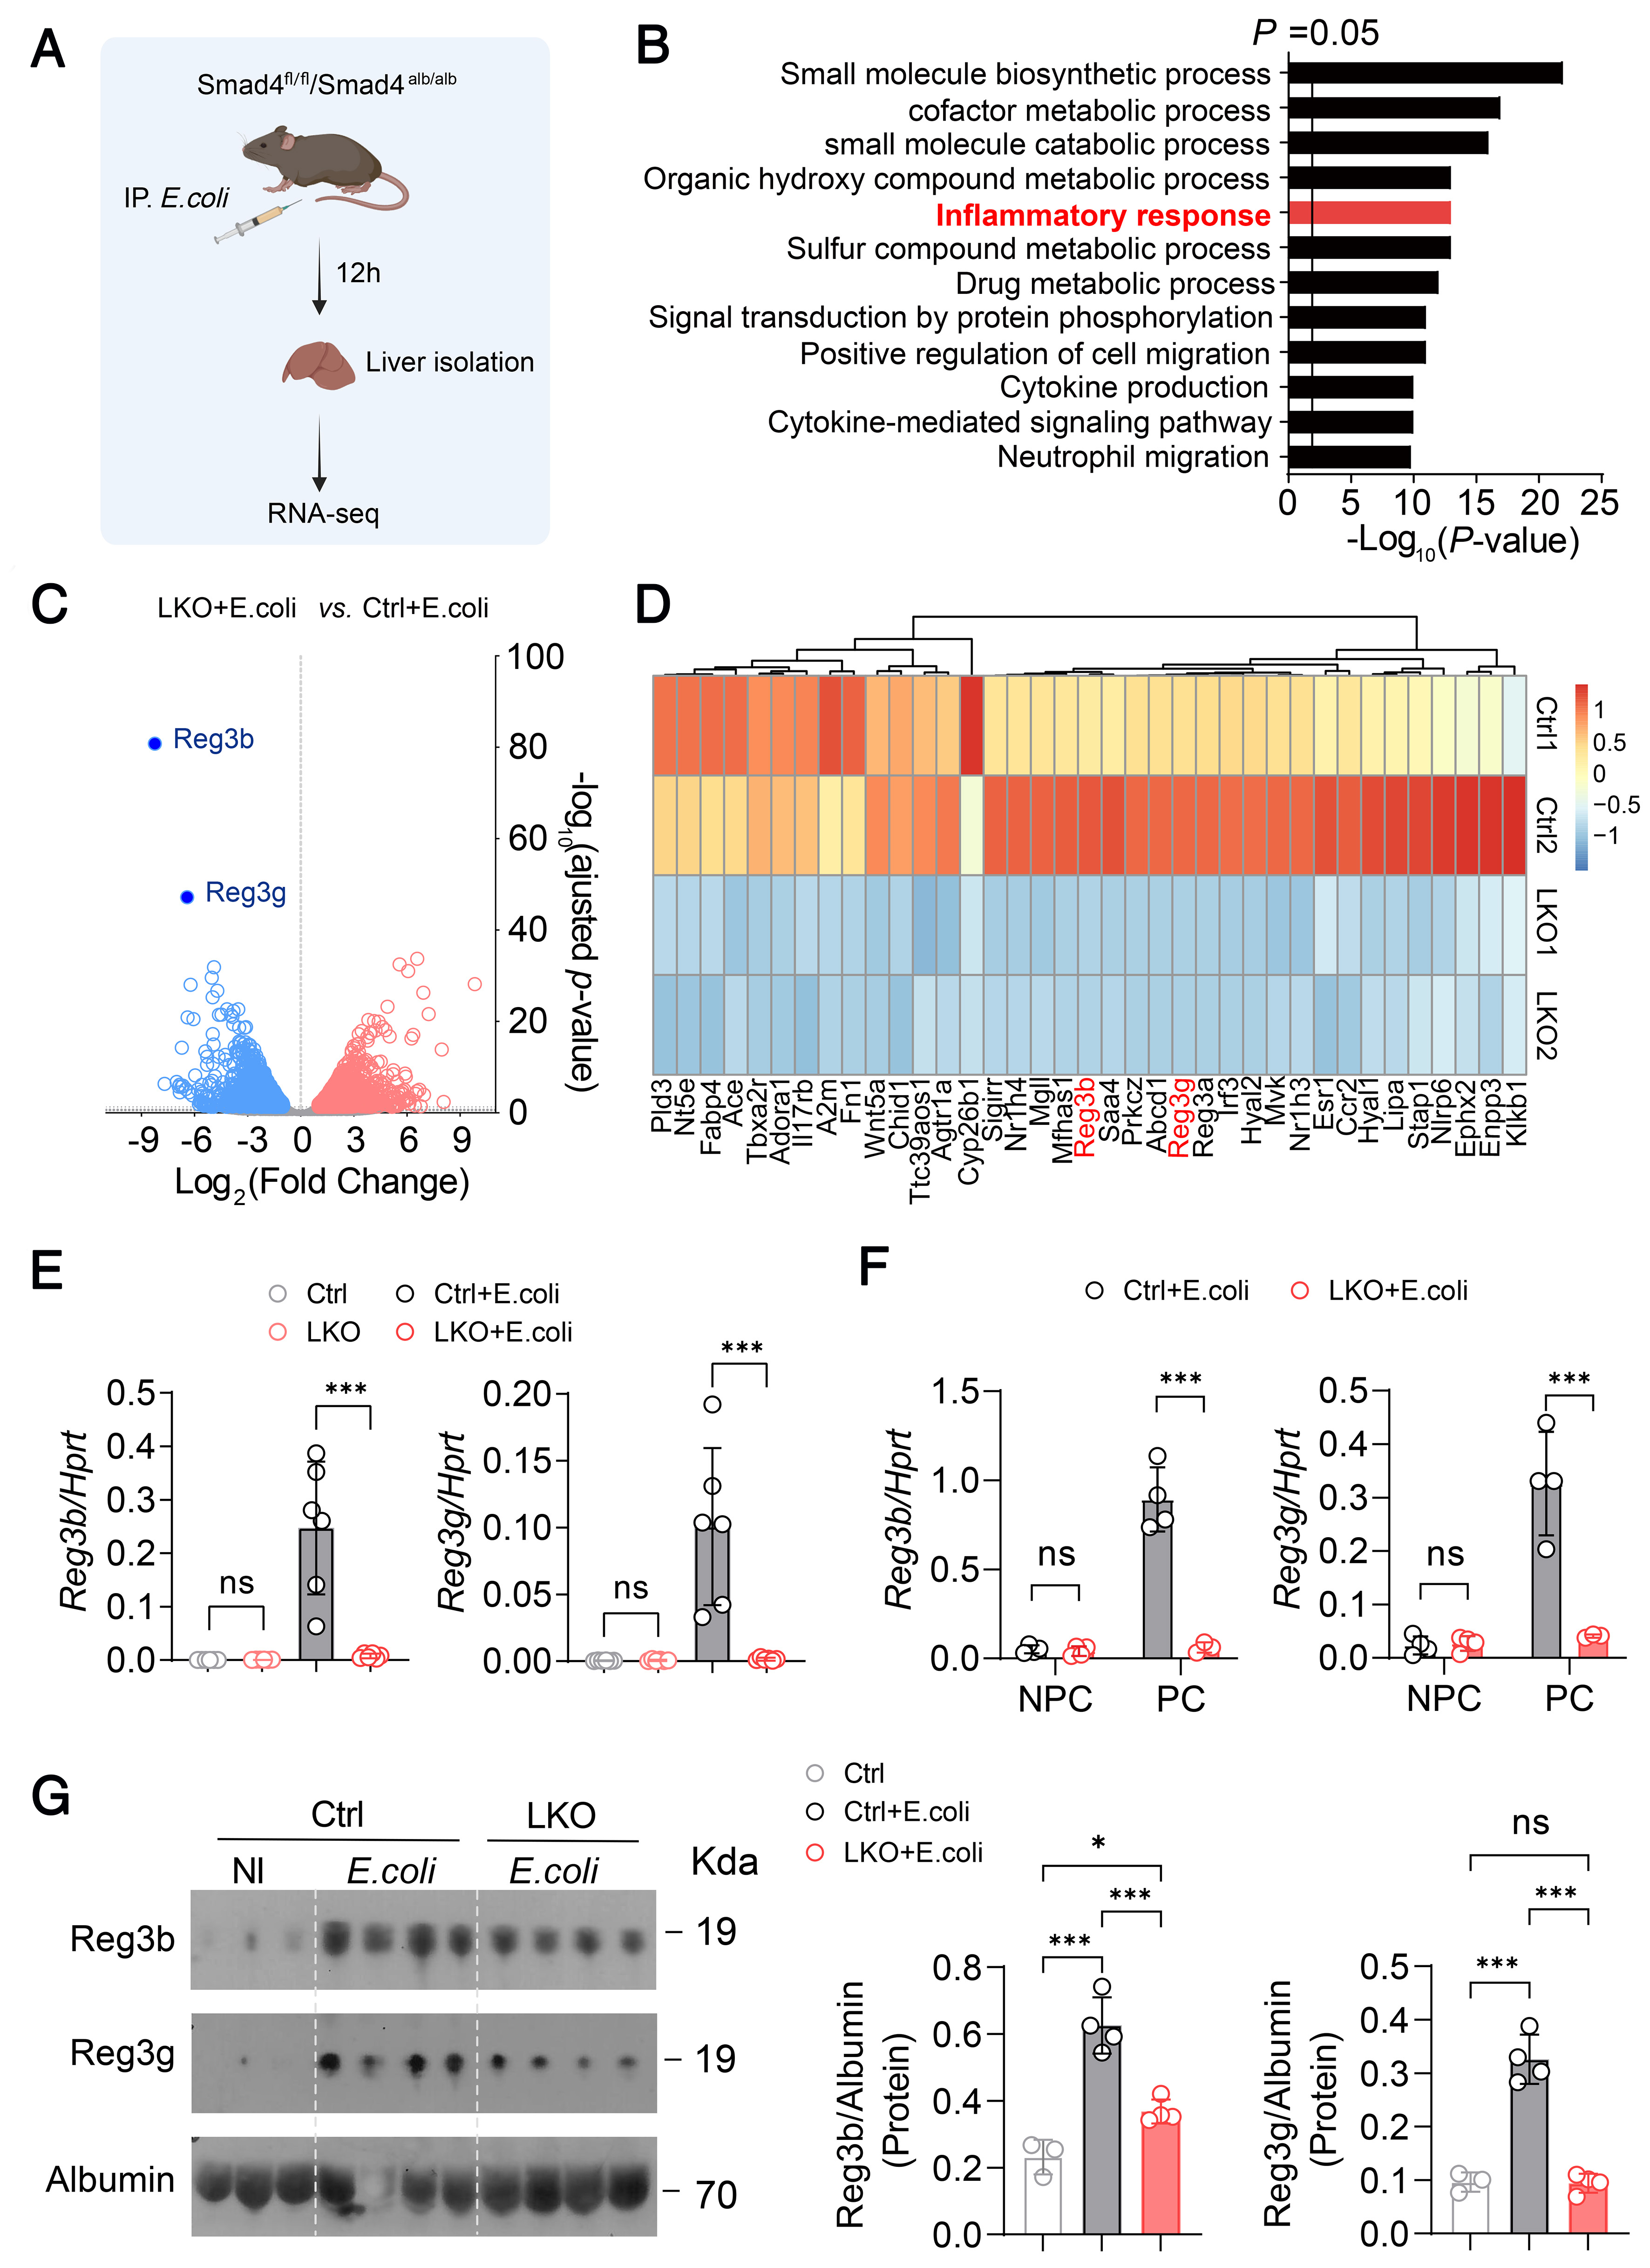
Figure 2. Smad4 deletion in hepatocytes decrease the expression of Reg3b and Reg3g.
(A) Schematic diagram depicting the strategy for the RNA‐seq of control and LKO liver 12 h post infection; (B) KEGG Pathway enrichment analysis of genetic programs differentially expressed in the liver from control and LKO mice 12 h post infection; (C) Volcano plot representation of RNA sequencing data of genes upregulated (red) or downregulated (blue) in the liver from control and LKO mice 12 h post infection. Gray dots indicate genes that were not significantly upregulated or downregulated; (D) Heat map representation of inflammatory response-related genes differentially expressed in the liver of control and LKO mice 12 h post infection; (E) Quantitative PCR of Reg3b and Reg3g in the liver samples taken from control and LKO mice (non-infected and 12 h post E. coli infection, respectively) (n = 6 per group); (F) The mRNA level of Reg3b and Reg3g in the parenchymal cell and non-parenchymal cell of control (n = 4) and LKO mice (n = 4) 12 h postinfection; (G) The protein levels and respective quantification of Reg3b and Reg3g in the serum of untreated (n = 3), control + E. coli (n = 4) and LKO + E. coli mice (n = 4). Circles correspond to individual mouse. Results are represented as mean ± SD and are obtained at 6 weeks of age. The membrane only detects a single protein and the area outside the target band is blank or has no effective signal. The P values in (E and F) were determined using unpaired Student’s t-tests. The P values in (G) were determined using one-way ANOVA. *P < 0.05; ***P < 0.001. NS: Not significant; IP: intraperitoneal injection; E. coli: Escherichia coli; NI: non-infected; KEGG: Kyoto Encyclopedia of Genes and Genomes; LKO: liver-specific Smad4 knockout.

