


fig3
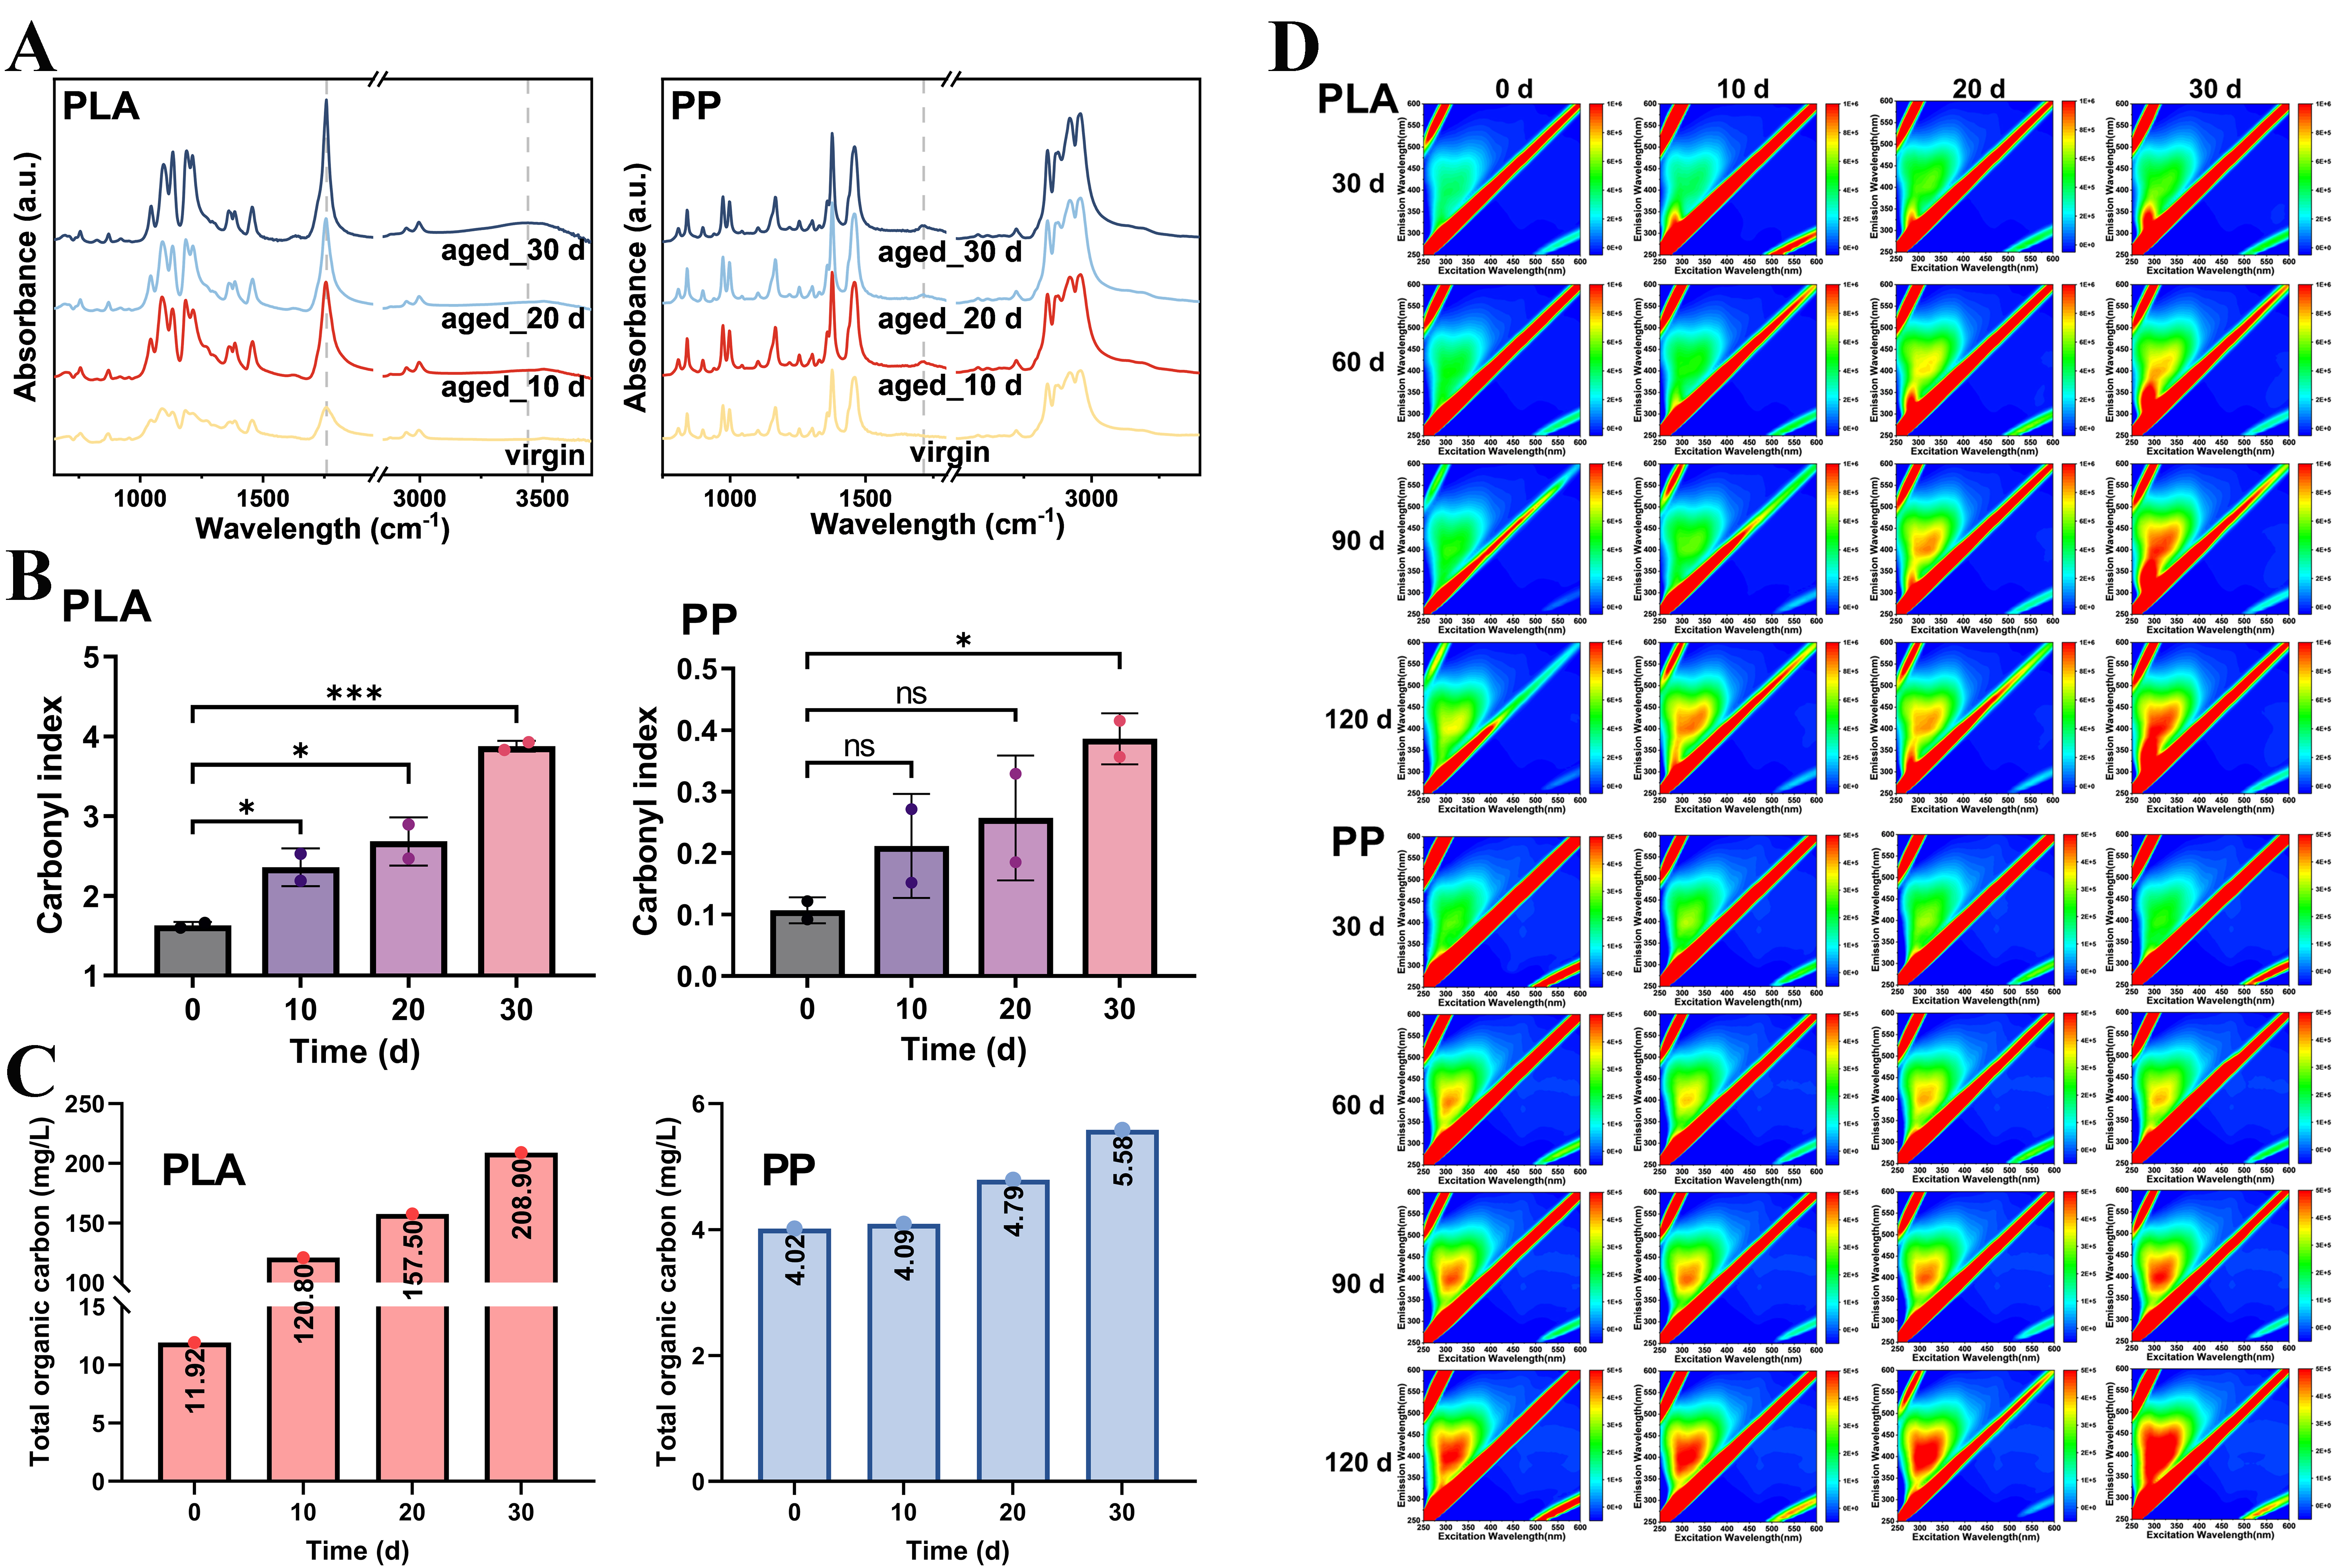
Figure 3. (A) FTIR spectra, (B) CI values of PLA and PP after 0, 10, 20 and 30 days of photoaging; (C) The concentration of TOC leached from PLA and PP with different photoaging degrees; (D) EEM spectra of water samples collected at 30, 60, and 90 days of microcosm incubation experiments of PLA and PP with different photoaging degrees. *P < 0.05 and ***P < 0.001. NS indicates no significant difference. FTIR: Fourier transform infrared; CI: carbonyl index; PLA: polylactic acid; PP: polypropylene; TOC: total organic carbon; EEM: excitation-emission matrix.


