
fig6
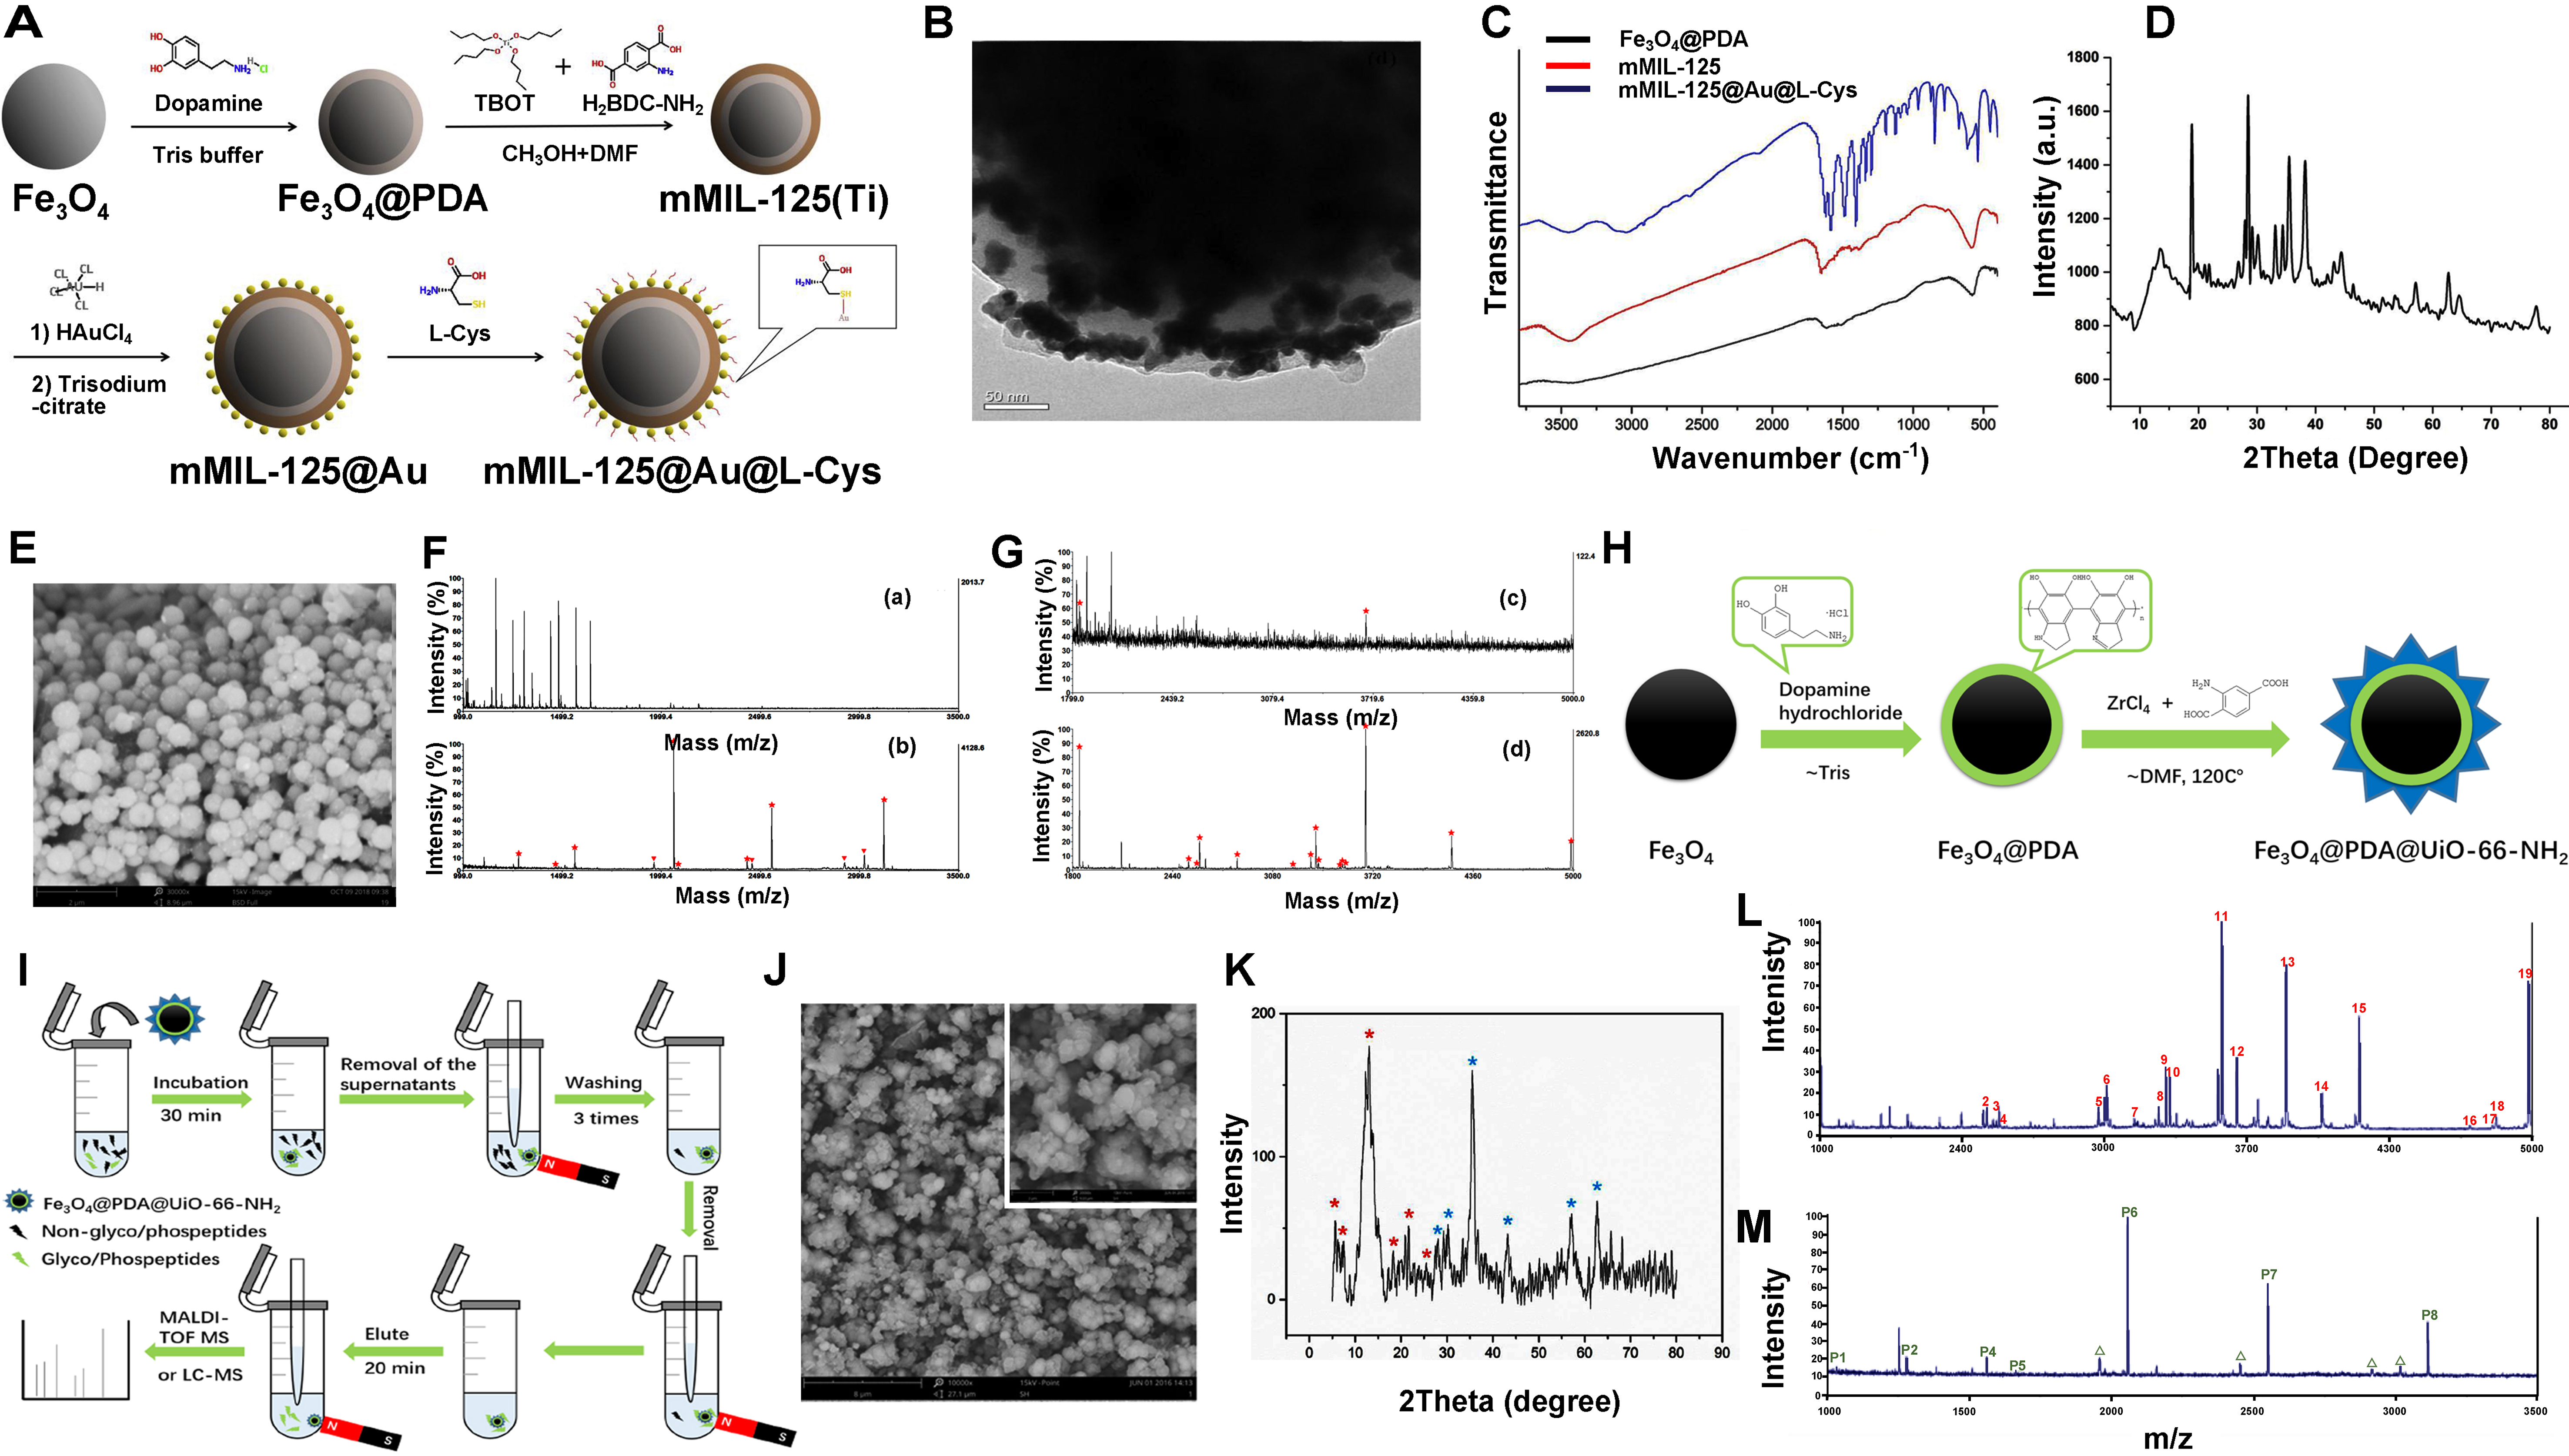
Figure 6. (A) The synthetic strategy of mMIL-125@Au@L-Cys and (B) TEM images of mMIL-125@Au@L-Cys; (C) FT-IR spectra of Fe3O4@PDA, mMIL-125 and mMIL-125@Au@L-Cys; (D) XRD of mMIL-125@Au@L-Cys; (E) SEM images of mMIL-125@Au@L-Cys: magnified for 30,000 times; (F and G) MALDI-TOF MS for the phosphopeptides from a mixture of β-casein and BSA tryptic digests with a mass ratio of 1:100: (a) before enrichment, (b) after enrichment. for the glycopeptides from a mixture of HRP and BSA tryptic digests with a mass ratio of 1:100: (c) before enrichment, (d) after enrichment; Peaks of glycopeptides and phosphopeptides are marked with red stars and red triangles indicate the losses of phosphoric acid (For interpretation of the references to color in this figure legend, the reader is referred to the Web version of this article); (H) The Synthetic route for Fe3O4@PDA@UiO-66-NH2; (I) Workflow of glycopeptide or phosphopeptide enrichment from biological samples using Fe3O4@PDA@UiO-66-NH2; (J) SEM images of Fe3O4@PDA@UiO-66-NH2; (K) XRD patterns of Fe3O4@PDA@UiO-66-NH2. MALDI-TOF MS for the glycopeptide enrichment from 250 fmol/mL; HRP tryptic digest: (L) after treatment with the first-time Fe3O4@PDA@UiO-66-NH2; (M) for the phosphopeptide enrichment from 200 fmol/mL β-casein tryptic digest: after treatment with the first-time Fe3O4@PDA@UiO-66-NH2. (A-G) are reprinted with permission from Ref.[109], Copyright © 2019 by Elsevier B.V. (H-M) are reprinted with permission from Ref.[110], Copyright © 2017 by Springer Nature. TEM: Transmission electron microscope; FT-IR: Fourier transform infrared spectroscopy; XRD: X-ray diffraction; SEM: scanning electron microscope; MALDI-TOF MS: matrix-assisted laser desorption/ionization time-of-flight mass spectrometry; BSA: bovine serum albumin; HRP: horseradish peroxidase.