

fig12
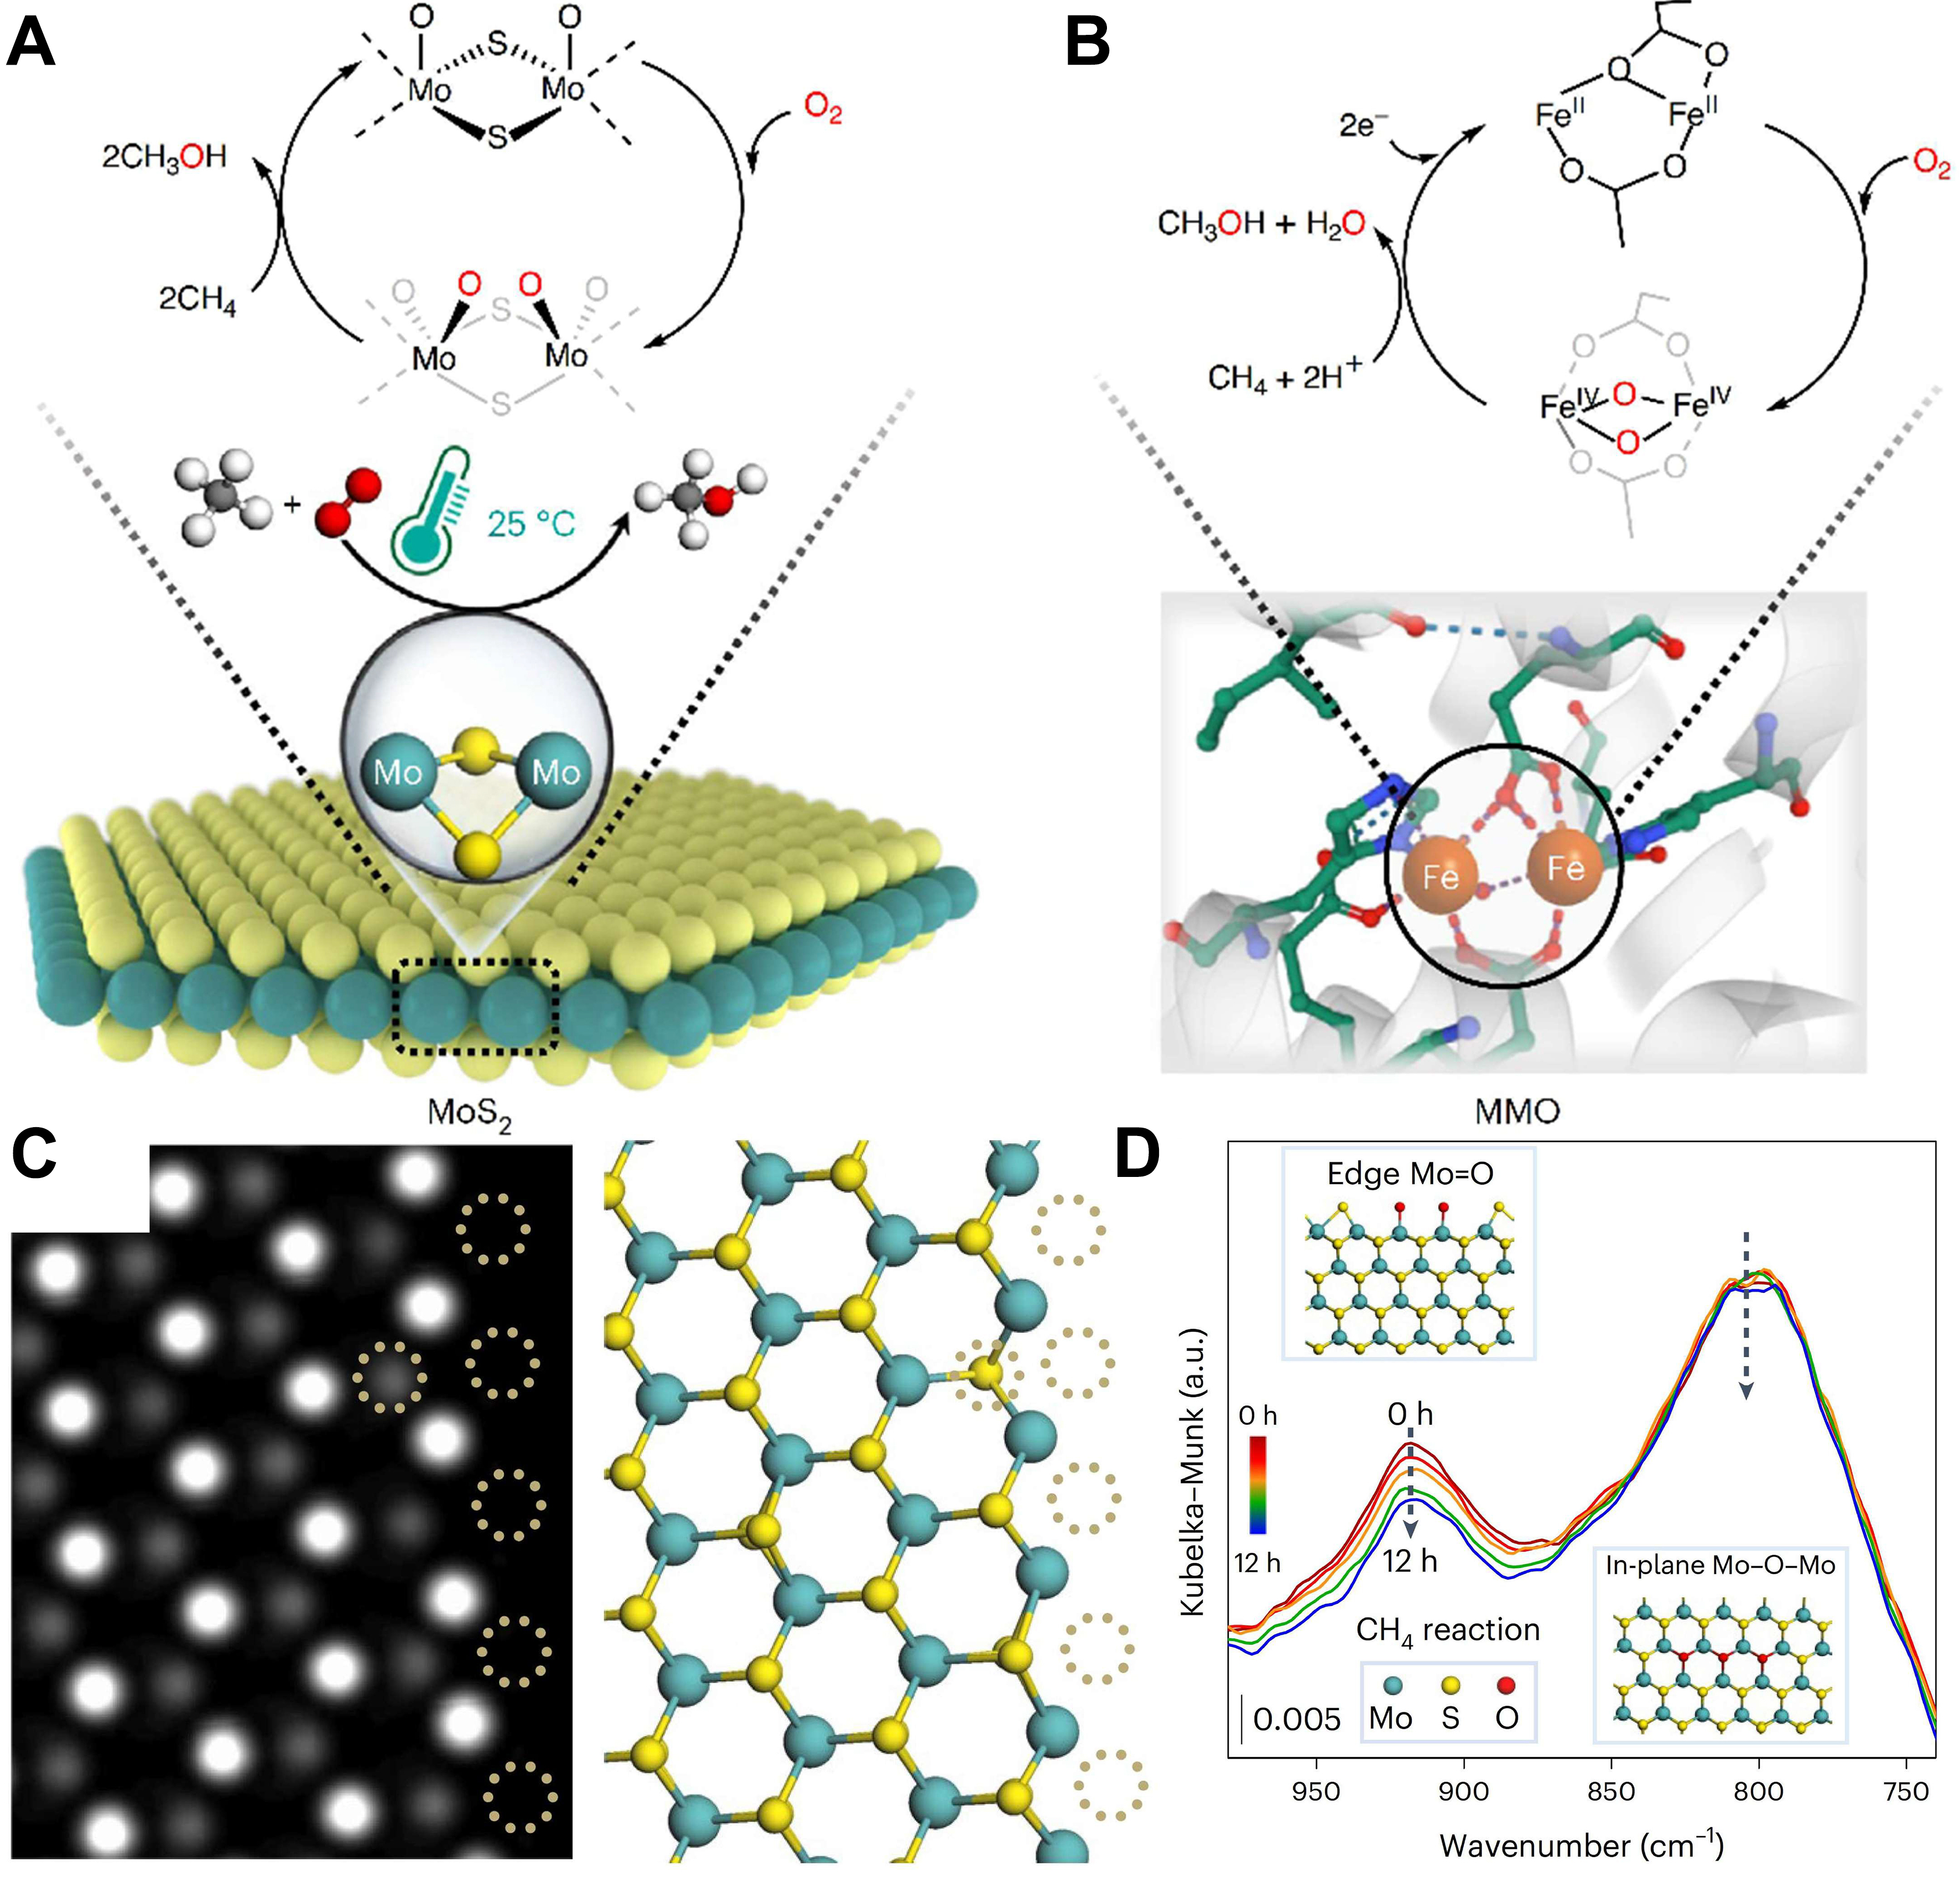
Figure 12. Room-temperature CH4 conversion by O2 over the MoS2 and MMO catalysts. Schematic illustration for the reaction cycle over the bi-Mo sites of SVs at the MoS2 edge (A) and the bi-Fe sites in the hydroxylase of MMO (Protein Data Bank 1FYZ) (B). Mo: cyan; S: yellow; O: red; C: grey (A) or green (B); H: white; Fe: orange; N: blue; (C) Simulated image and the corresponding atomic configurations of MoS2 showing the quintuple SVs at the edge denoted by dotted circles; (D) In situ DRIFTS spectra showing the variation of relative intensities of the Mo = O and Mo-O-Mo peaks when CH4 passes through the O2-pretreated and H2O-pretreated MoS2 catalyst at


