

fig4
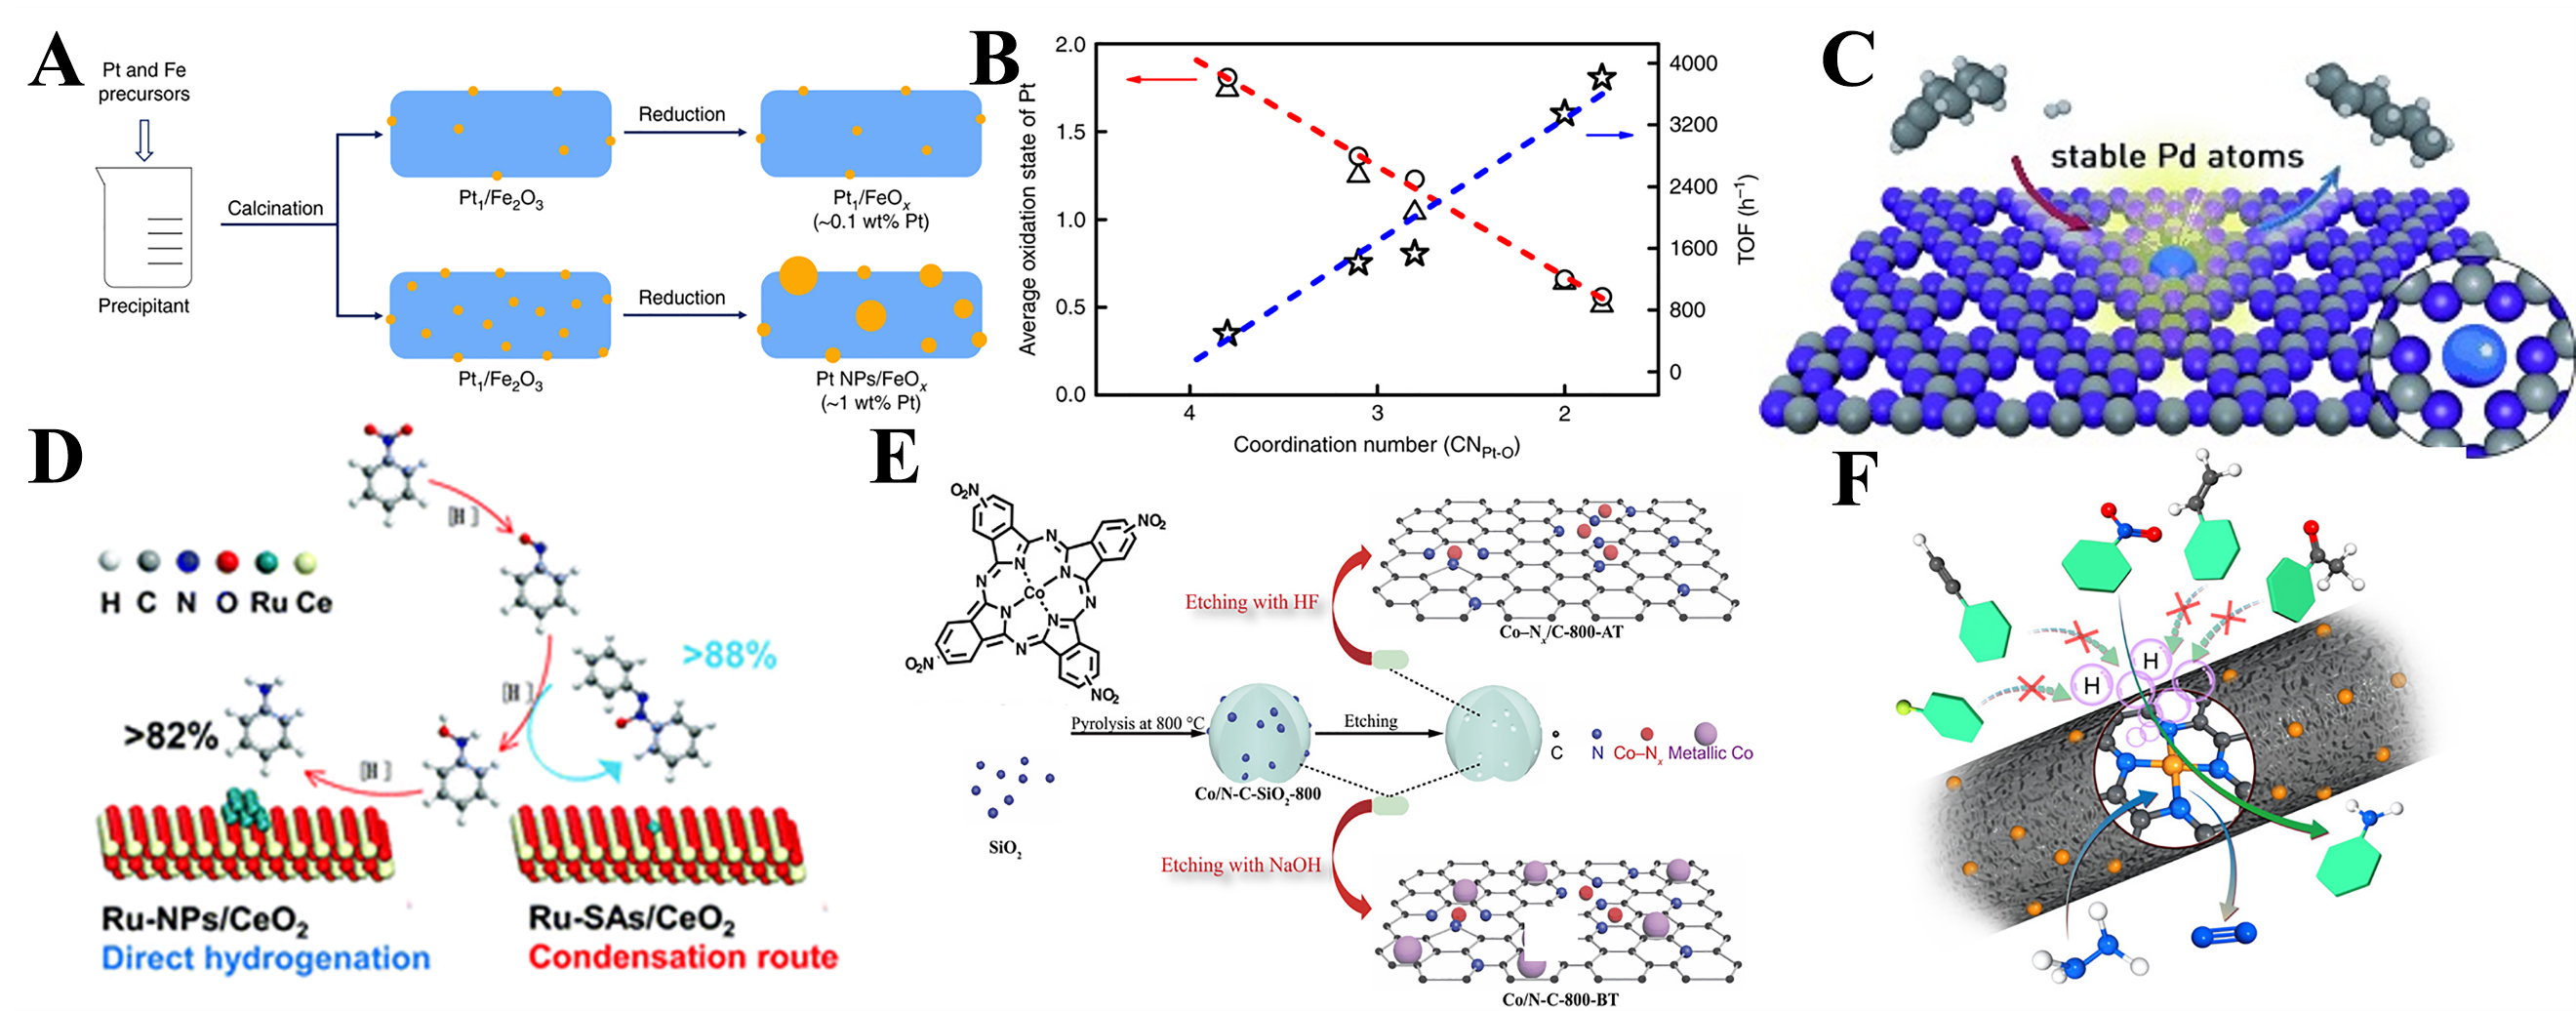
Figure 4. (A) Synthetic procedure of Pt1/FeOx[85]; (B) The correlation between coordination structure and catalytic performance. The star, triangle, and circle represent TOF, the average oxidation state of Pt determined from XPS and XANES, respectively. Linear correlations are obtained between the CN of Pt-O and the average oxidation state (red line), and between CN of Pt-O and the hydrogenation activity (blue line)[85]; (C) Schematic illustration for the Pd SACs[86]; (D) Structure of the Ru-SACs/CeO2[93]; (E) Schematic illustration for the preparation of the Co-Nx/C-800-AT catalyst[100]; (F) Schematic illustration for the Fe1/N-C[111]. Pt1: Single Pt atoms; TOF: turnover frequency; XPS: X-ray photoelectron spectroscopy; SAC: single-atom catalyst.


