

fig9
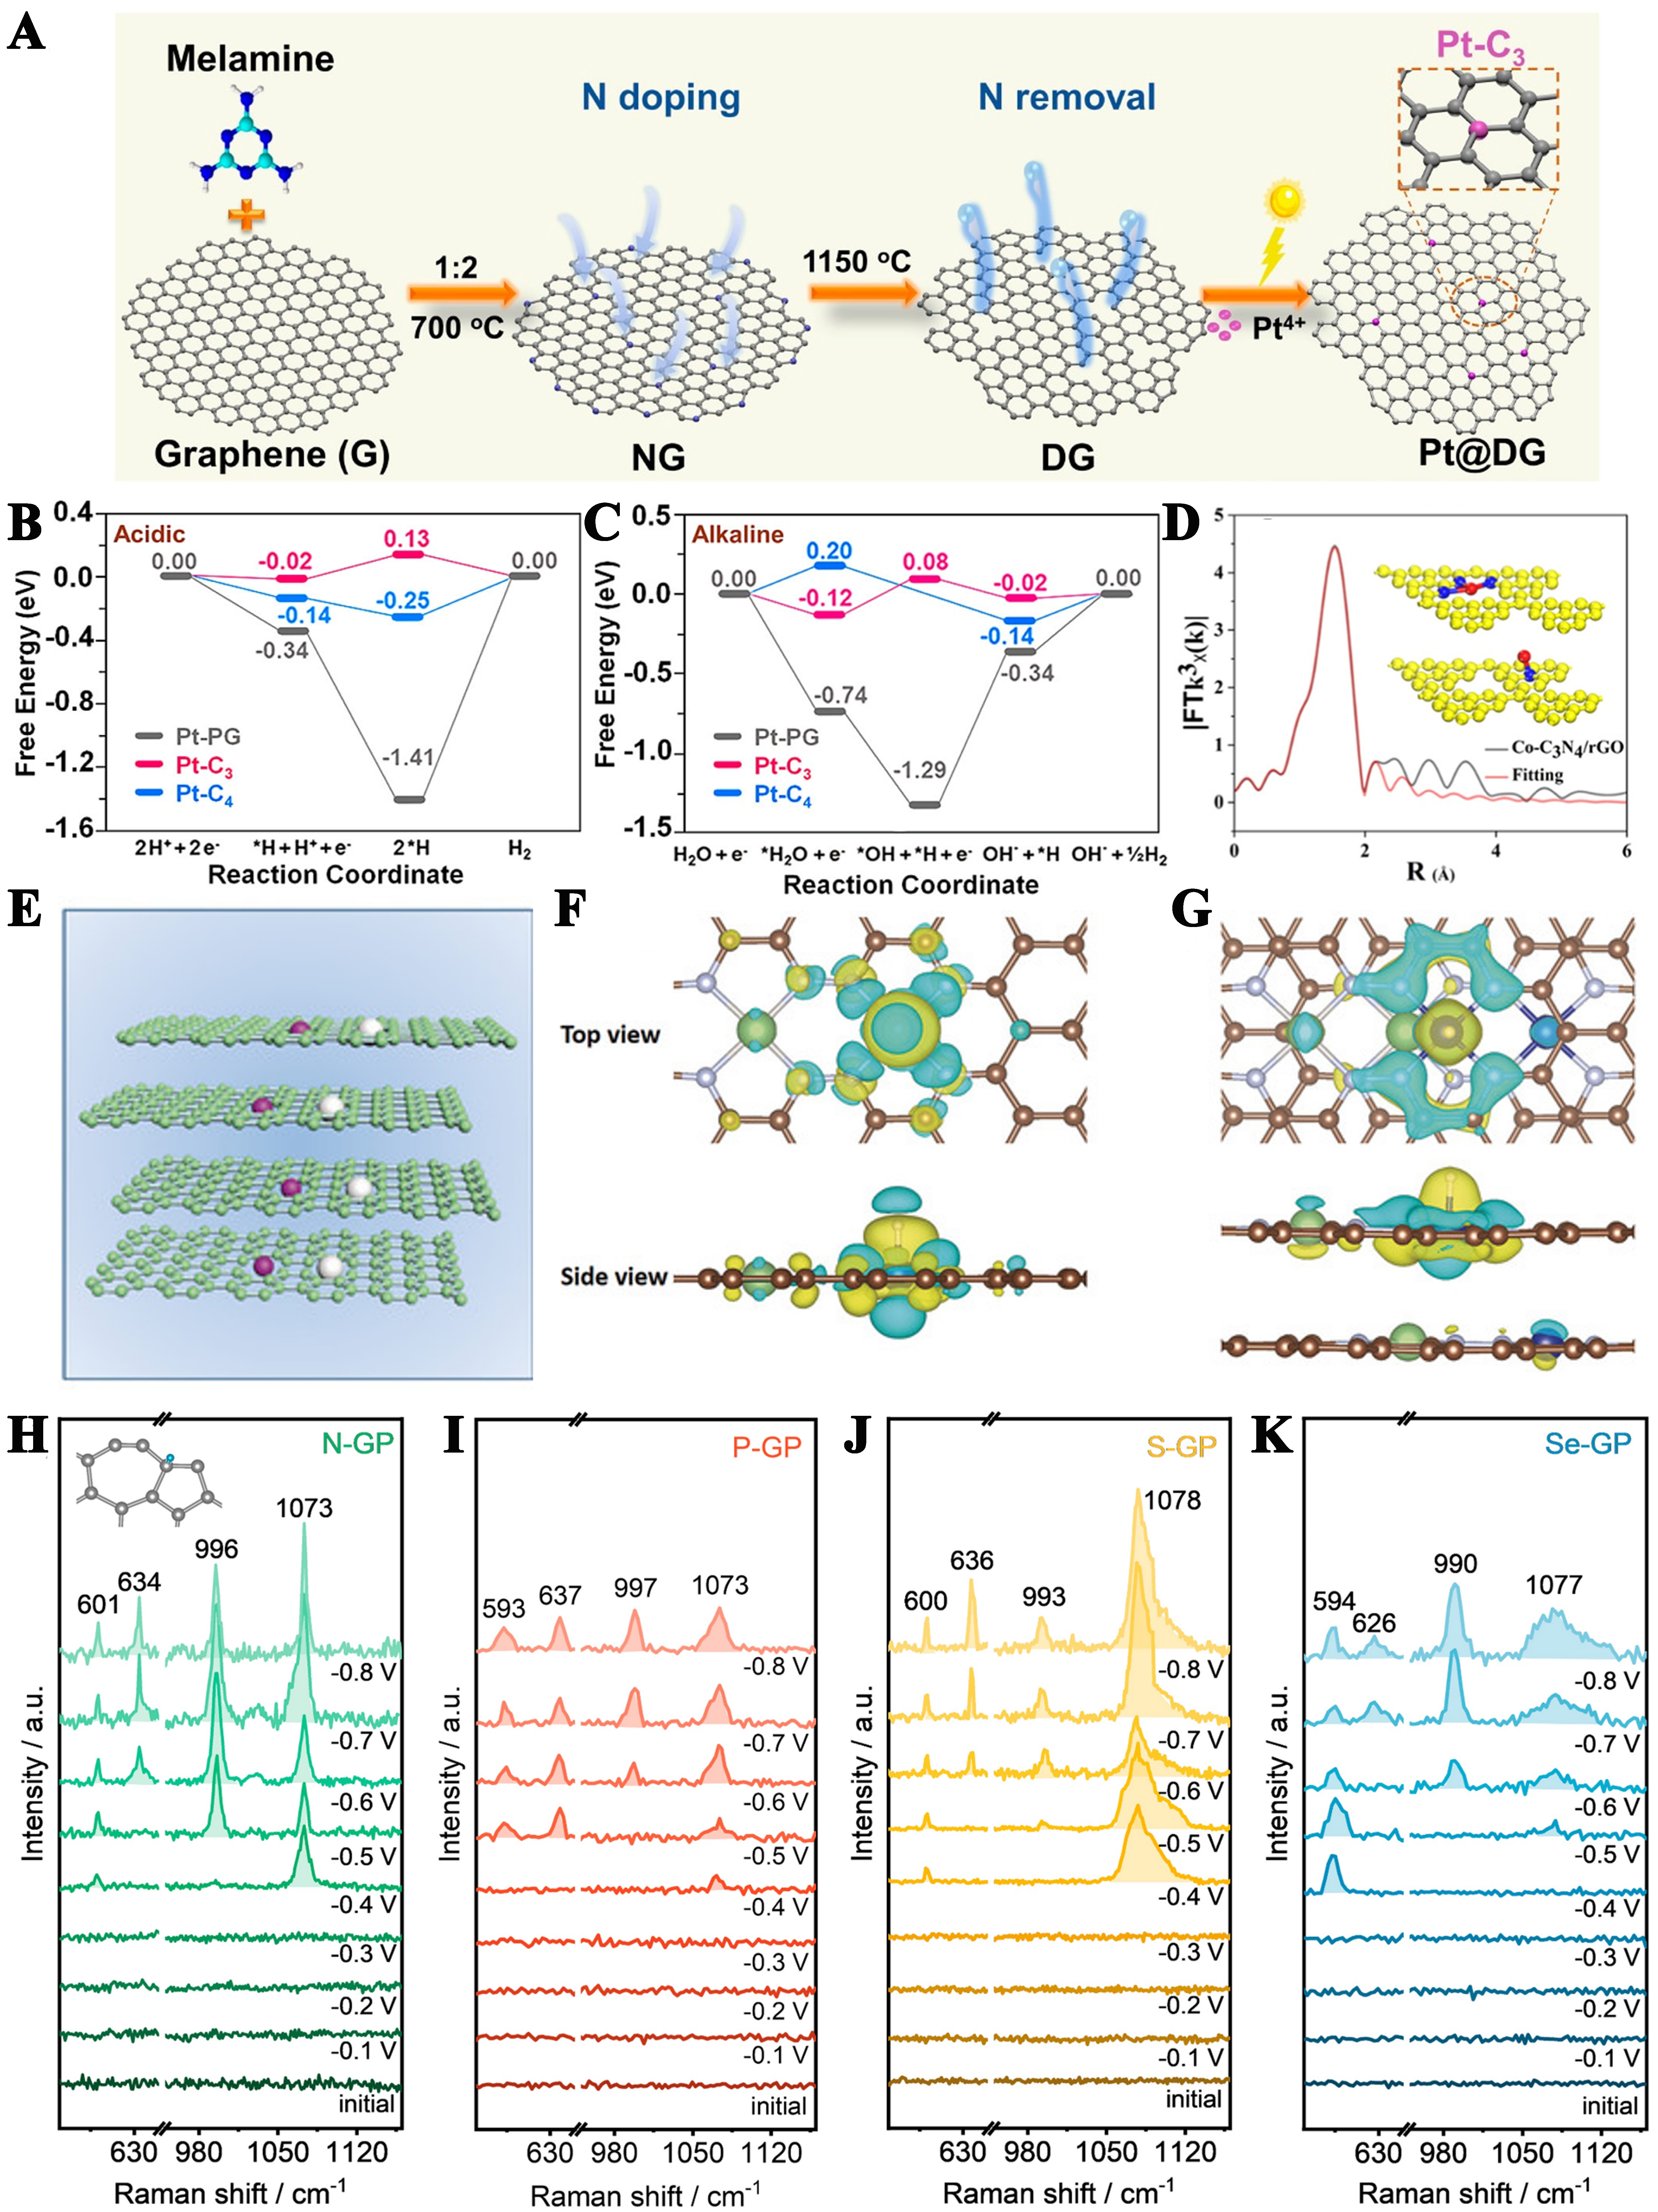
Figure 9. (A) Schematic representation of the Pt@DG synthesis process; Reaction potential energy of the HER process of different active sites under (B) acidic conditions and (C) alkaline conditions. This figure is quoted with permission from Yang et al.[184]; (D) EXAFS fitting analysis of Co-C3N4/rGO in R-space, with insets illustrating schematic models of Co-N1 and Co-N3 coordination environments. This figure is quoted with permission from Liu et al.[186]; (E) Schematic representation of the graphitic structure of A-CoPt-NC; pink: Co, white: Pt; (F and G) Side view and top view of the charge distribution of single-layered/double-layered model a(Co-Pt) @N8V4; (brown: C, green: N, white: Pt, blue: Co. the colors yellow and blue represent the increase and decrease of charge density, respectively). This figure is quoted with permission from Zhang et al.[187]; Universal formation of G5-7 topological rings as HER active sites. In situ Raman spectra of (H) N-GP, (I) P-GP, (J) S-GP, and (K) Se-GP during the HER process [The Inset in (H) shows the structure of H-G5-7; gray: C, blue: H]. This figure is quoted with permission from Liu et al.[189]. HER: Hydrogen evolution reaction; EXAFS: extended X-ray absorption fine structure.


