

fig7
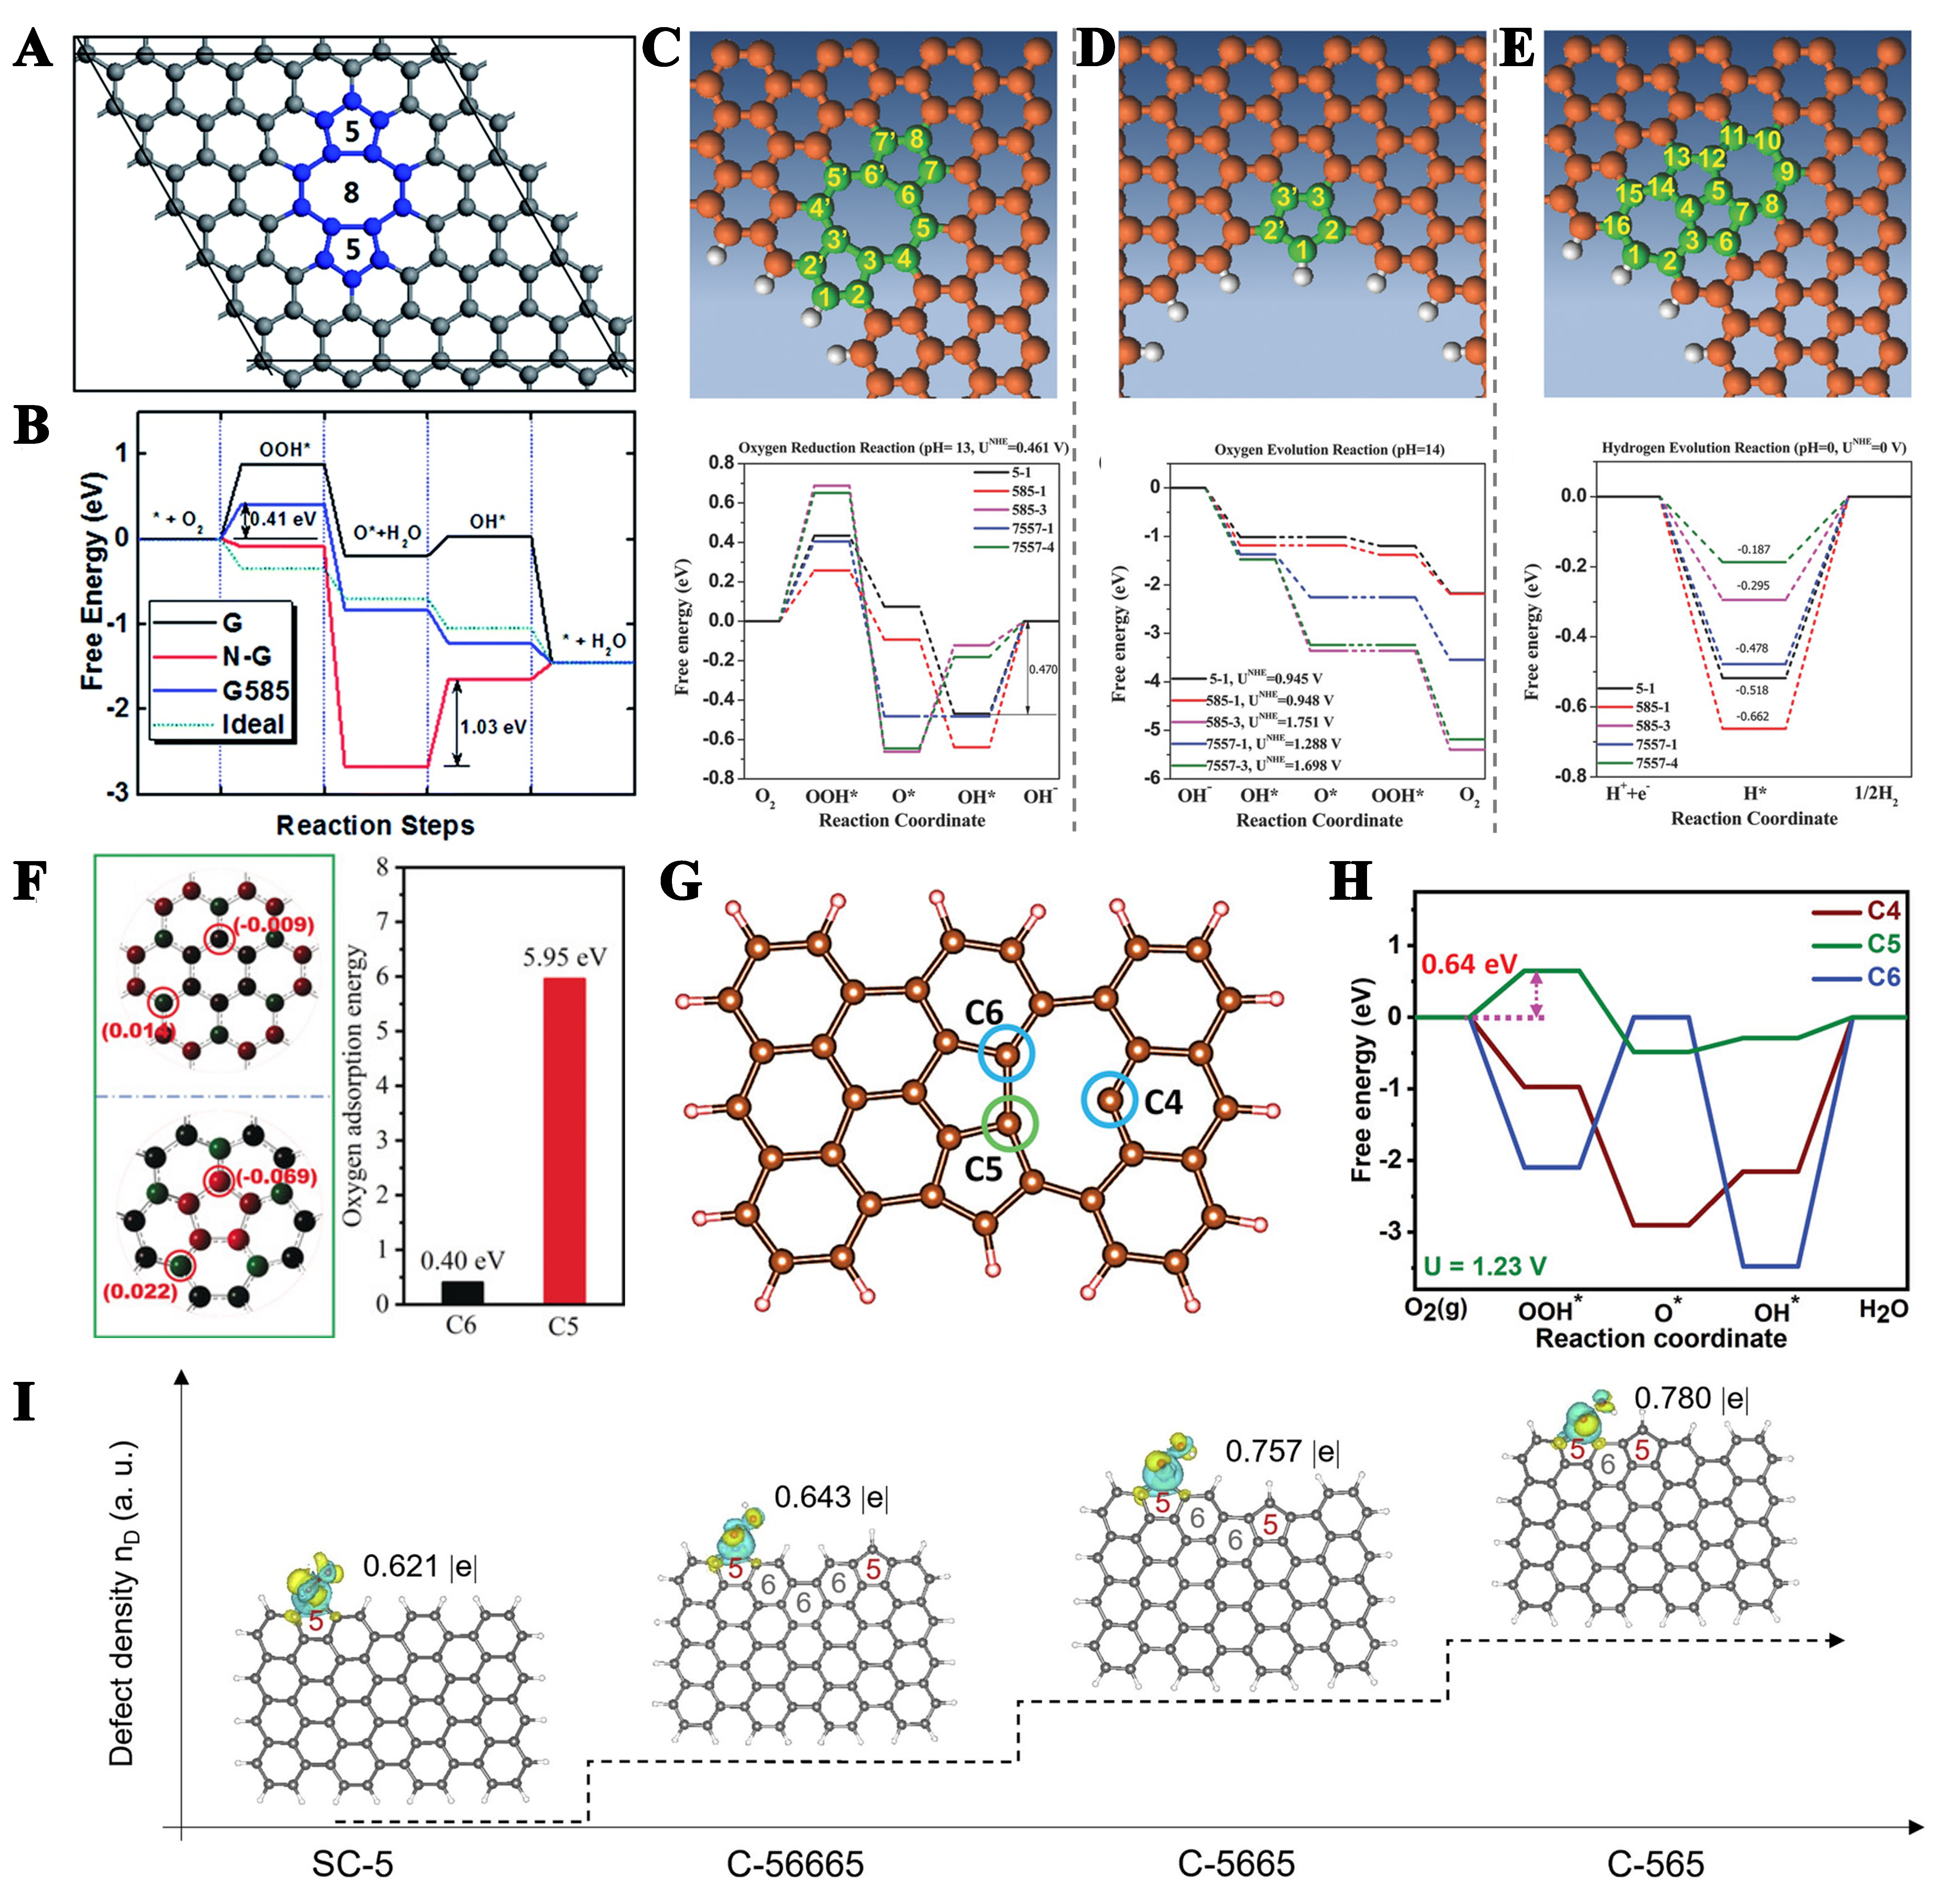
Figure 7. (A) Schematic diagram of G585 defects in graphene; (B) Computationally derived free energy profiles for ORR at equilibrium potential, comparing pristine monolayer graphene (G), NG, G585-defected graphene (G585), and an ideal catalyst (Ideal). This figure is quoted with permission from Zhao et al.[159]. Comparative energy maps of defect configurations of ORR, OER, and HER reaction pathways on DG under alkaline and acidic conditions: (C) edge pentagon, (D) 5-8-5 defect, (E) 7-55-7; This figure is quoted with permission from Jia et al.[166]; (F) Charge densities and oxygen adsorption energies of C6 and C5. This figure is quoted with permission from Zhu et al.[168]; (G) Theoretical models, and (H) the free energy diagram of typical ORR pathway of C4, C5 and C6. This figure is quoted with permission from Srinivas et al.[172]; (I) The electron density corresponding to adsorbed *OOH on different sites. This figure is quoted with permission from Wu et al.[165]. ORR: Oxygen reduction reaction; NC: nitrogen-doped graphene; OER: oxygen evolution reaction; HER: hydrogen evolution reaction; DG: defective graphene.


