

fig5
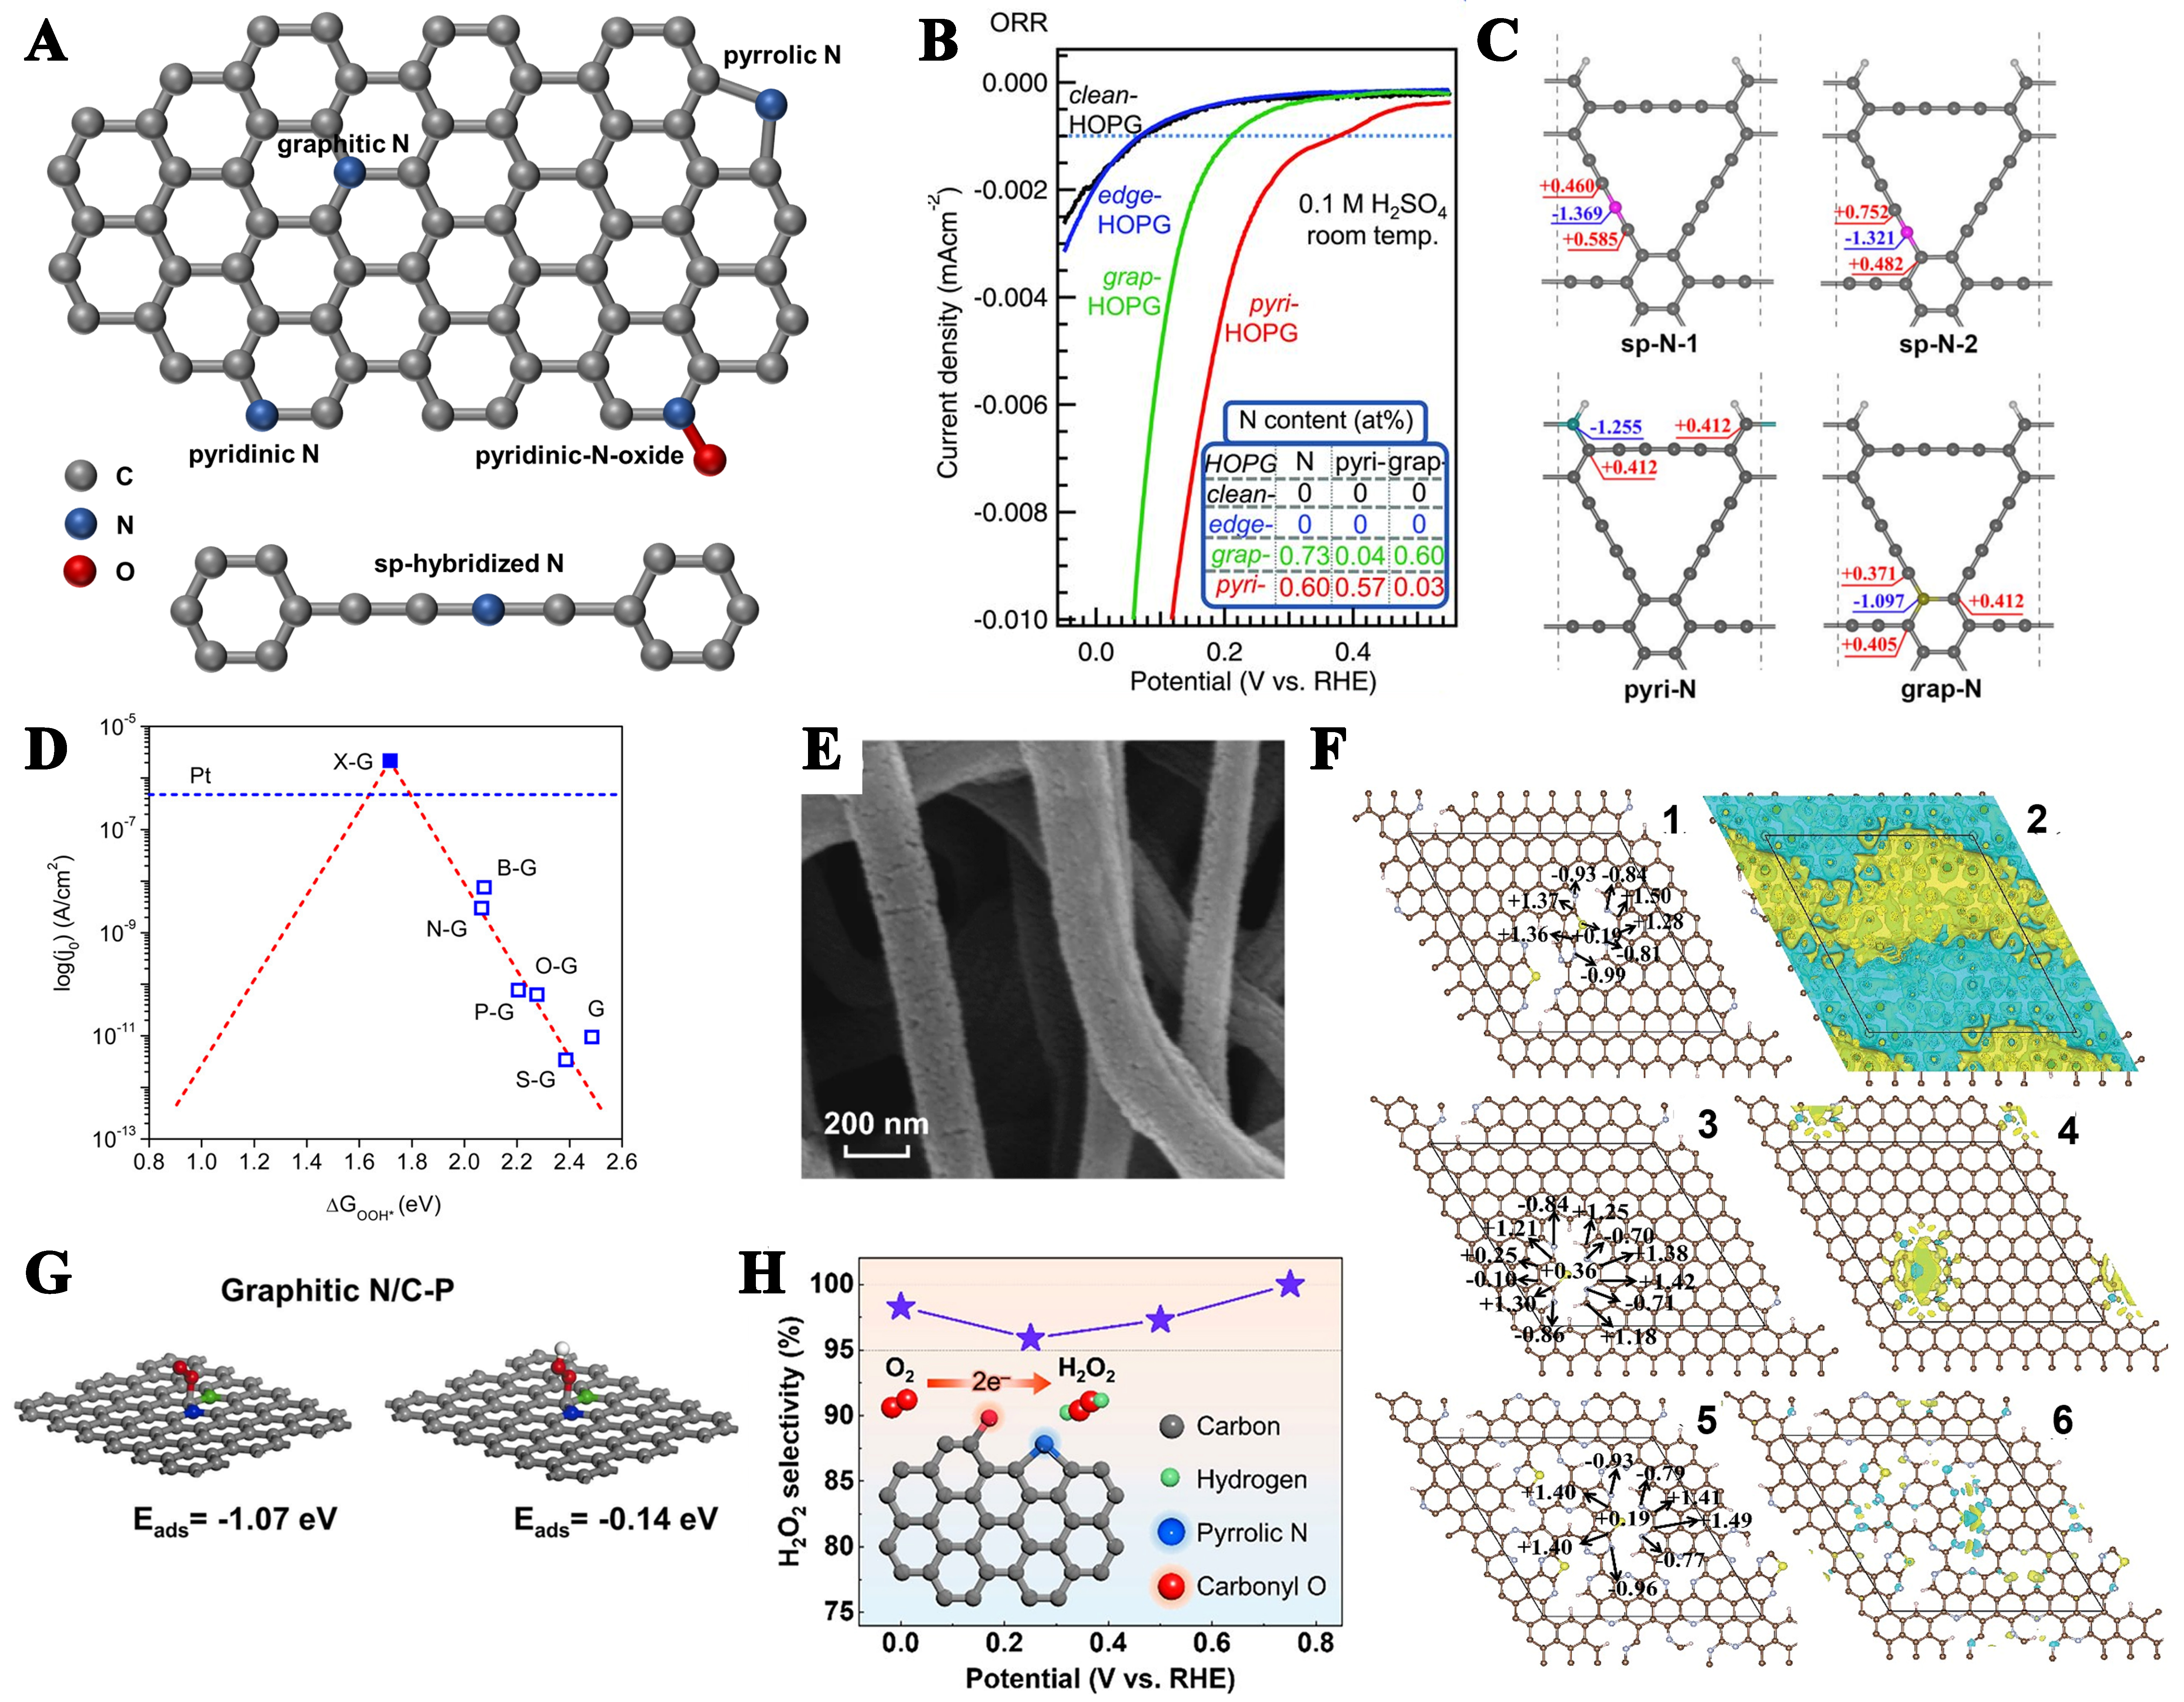
Figure 5. (A) Schematic diagram of different types of N; (B) The ORR performance of the model catalysts was evaluated, and the corresponding quantification of the nitrogen content is shown in the inset. This figure is quoted with permission from Guo et al.[142]; (C) Bader effective charges of N and adjacent C in N-doped graphdiyne (sp-N, pyri-N, grap-N). This figure is quoted with permission from Zhao et al.[144]; (D) Volcano plot from Tafel and DFT-calculated ΔGOOH* for doped graphene catalysts. This figure is quoted with permission from Jiao et al.[145]; (E) SEM images of N, F-MCFs. This figure is quoted with permission from Gong et al.[149]; (F) The impact of doping concentration on the electronic properties of a sulfur and pyridine nitrogen co-doped graphitic carbon system was studied for three compositions: (1,2) C:N:S = 112:8:2 (SN/C-900), (3,4) C:N:S = 120:4:1 (SN/C-1000), and (5,6) C:N:S = 91:23:3 (SN/C-400). The color coding represents the atomic species (dark brown: C, gray: N, yellow: S, pink: H). This figure is quoted with permission from Li et al.[151]; (G) Computationally optimized structural configurations and corresponding adsorption energies of O2 and *OOH intermediates on graphite N/C-P model systems. This figure is quoted with permission from Cheng et al.[156]; (H) Selectivity of the 2e- reaction of the coupling of pyrrolic N with carbonyl O. This figure is quoted with permission from Koh et al.[158]. ORR: Oxygen reduction reaction; DFT: density functional theory; SEM: scanning electron microscopy.


