

fig10
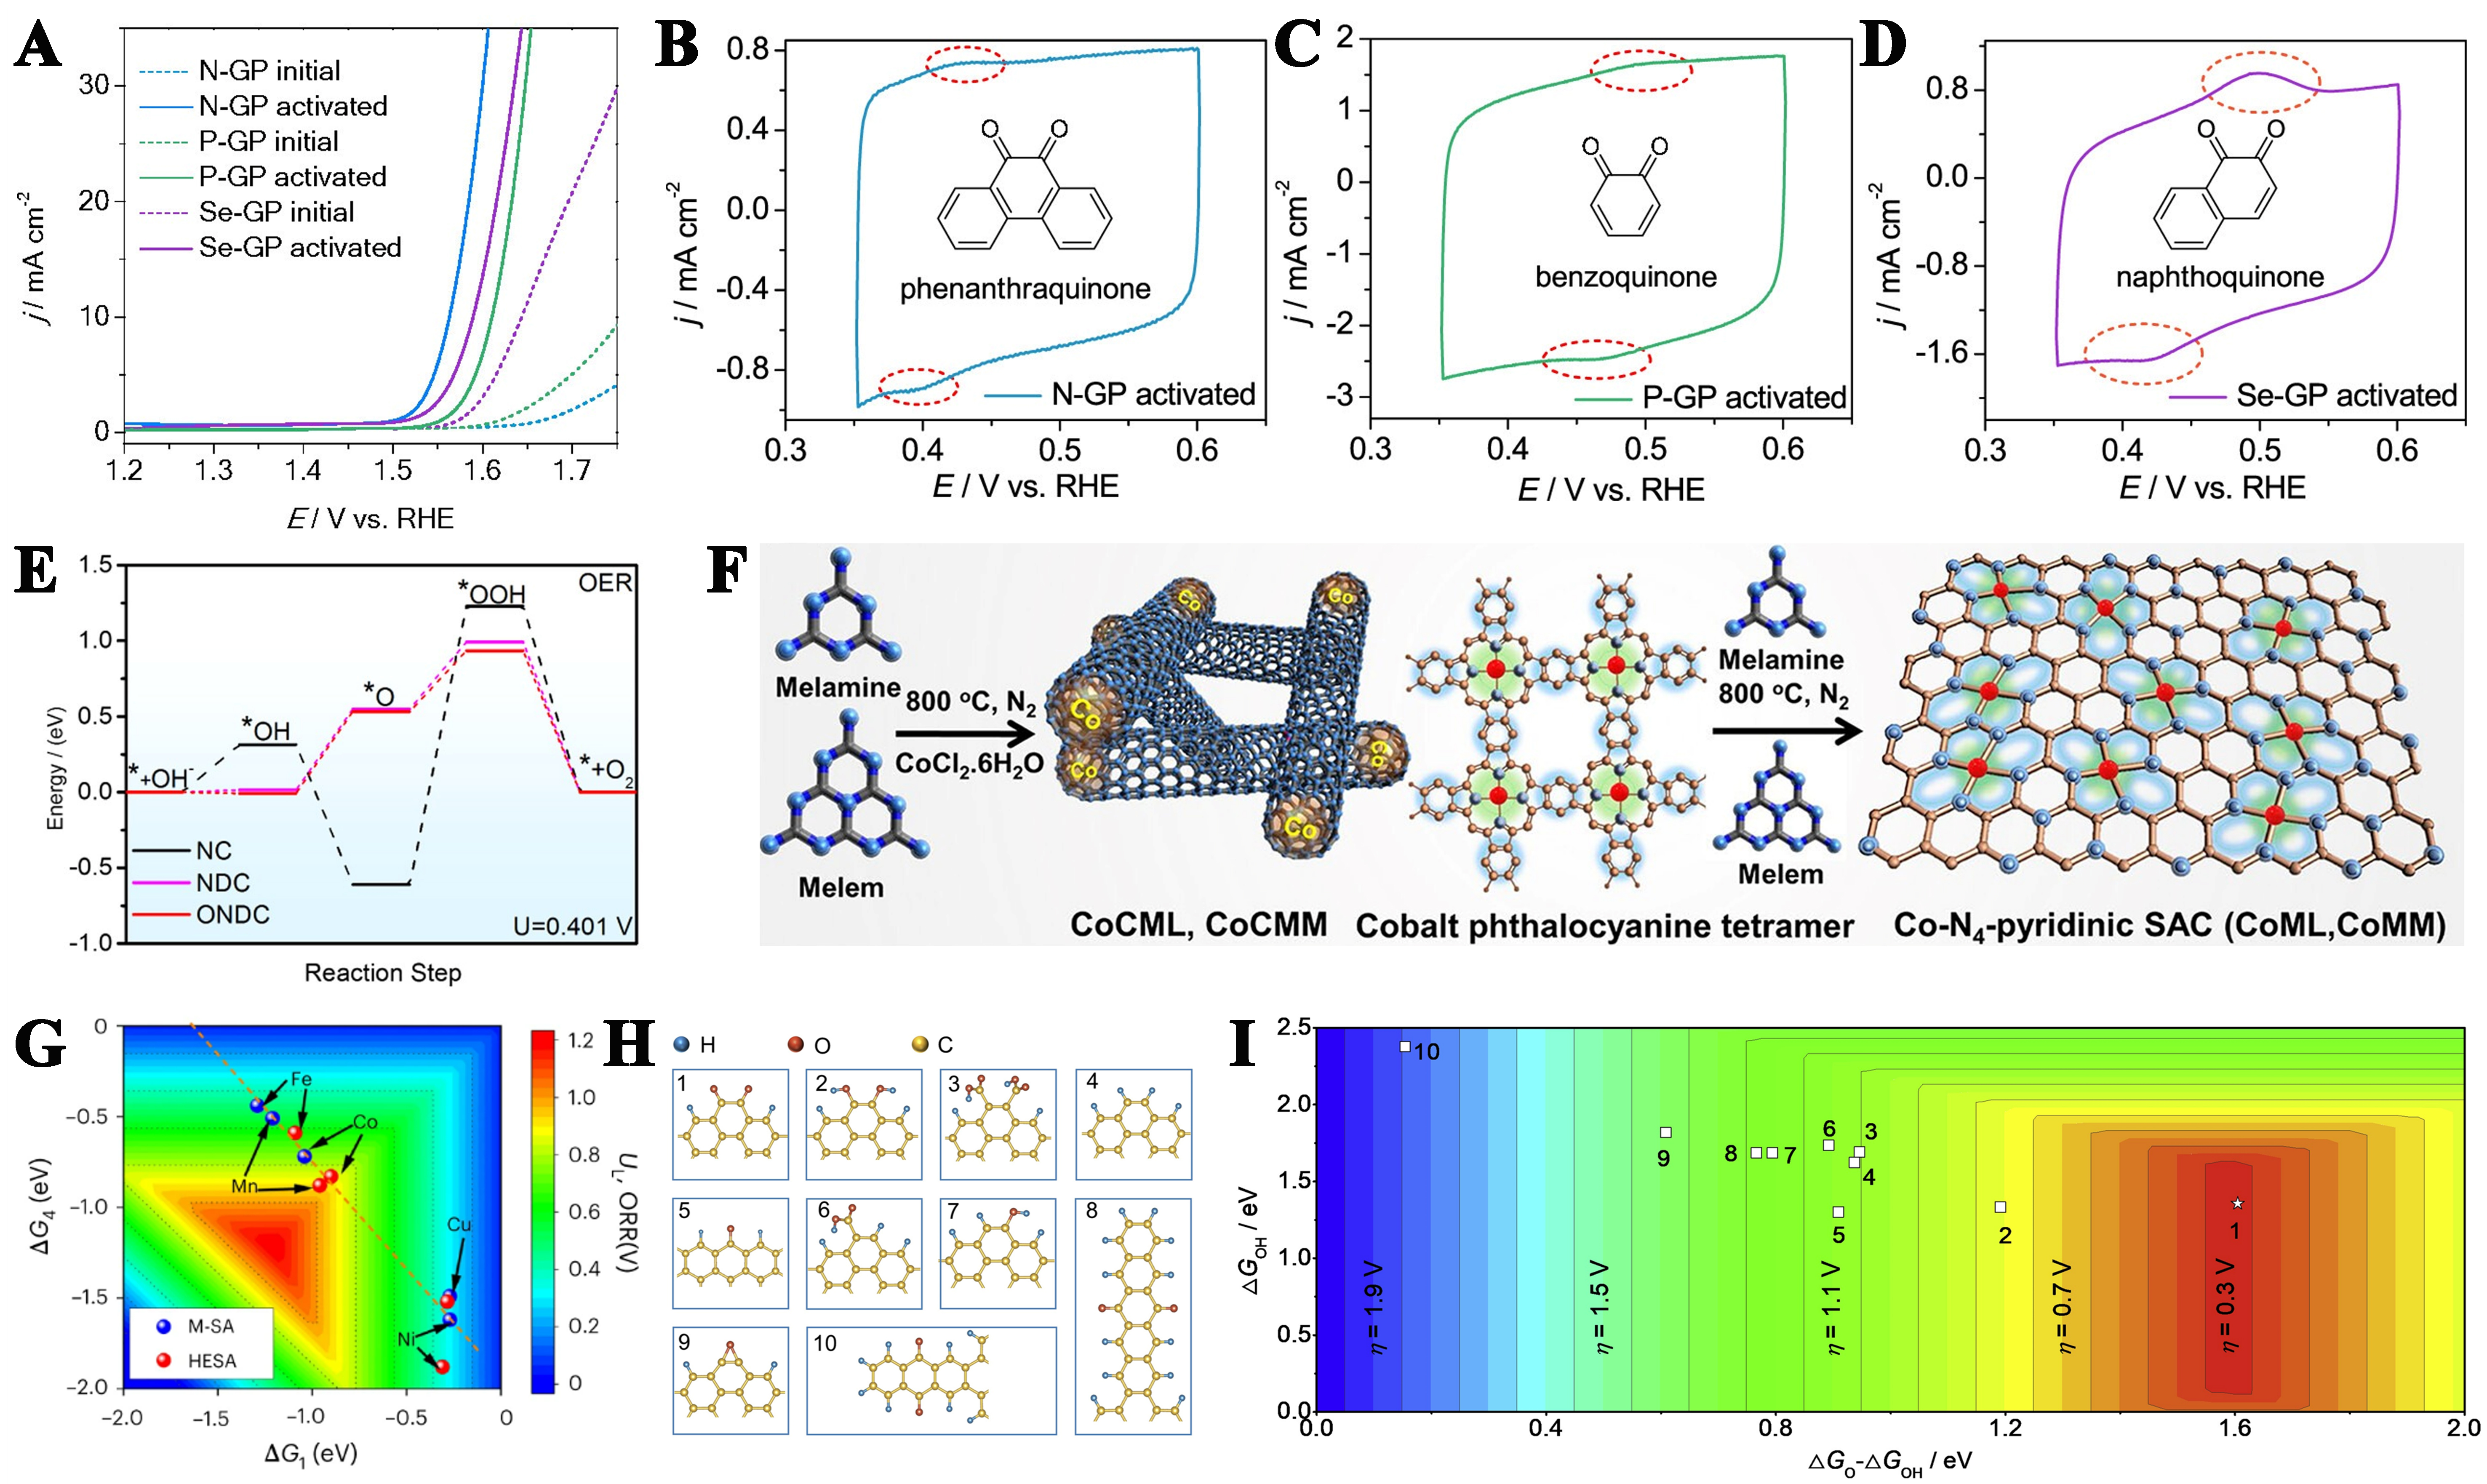
Figure 10. (A) Comparative analysis of catalytic activity in heteroatom-doped GPs pre- and post-activation; CV of (B) N-GP, (C) P-GP, and (D) Se-GP after the activation (Insets illustrate corresponding ortho-quinone structures). This figure is quoted with permission from Liu et al.[193]; (E) Gibbs free energy profiles for OER pathways on three distinct catalytic models at the thermodynamic equilibrium potential (U = 0.401 V). This figure is quoted with permission from Qiang et al.[194]; (F) Schematic illustration of CoCML and CoCMM nanocluster synthesis via thermal condensation at 800 °C using melamine and formamide as precursors. This figure is quoted with permission from Kumar et al.[196]; (G) Color-mapped contour plots illustrating the correlation between limiting potential and Gibbs free energy parameters (ΔG1 and ΔG4). This figure is quoted with permission from Lei et al.[197]; (H) Computational models of graphene incorporating various oxygen-containing functional groups; (I) Computationally derived overpotential volcano plots utilizing O* and OH* adsorption energies as catalytic descriptors. This figure is quoted with permission from Lu et al.[199]. GPs: Graphite flakes; CV: cyclic voltammetry; OER: oxygen evolution reaction.


