

fig1
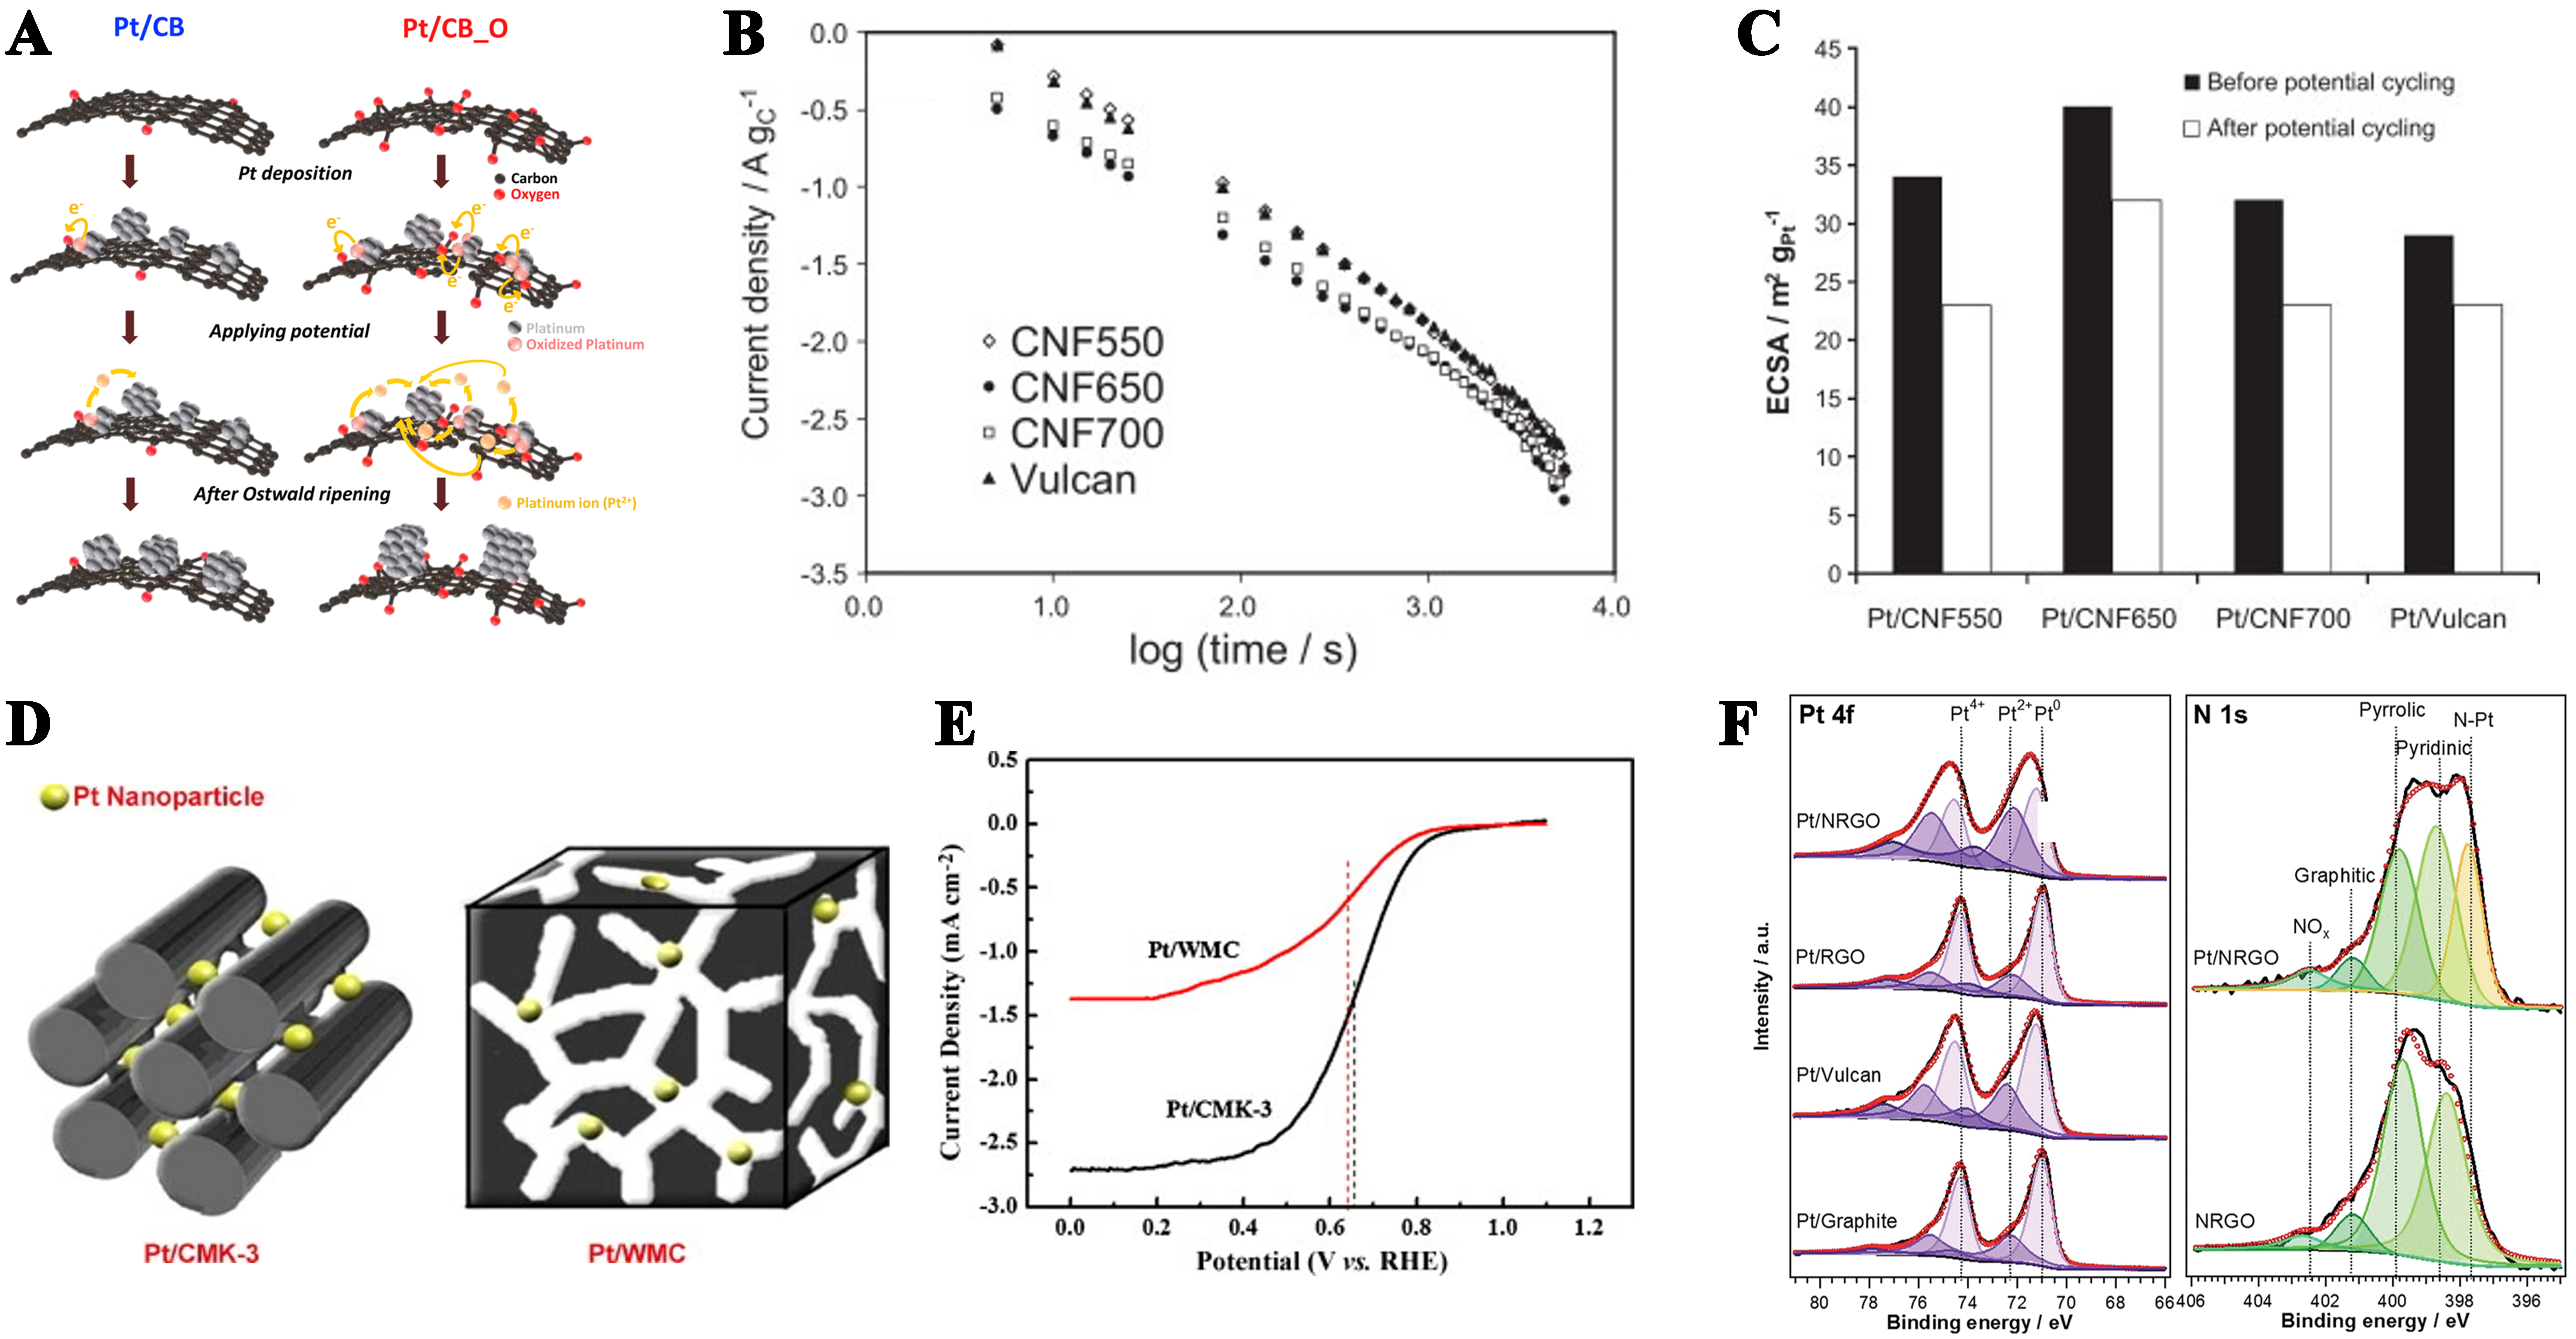
Figure 1. (A) Schematic diagram of the variations in Pt particle size distribution in Pt/CB and Pt/CB_O catalysts before and after accelerated durability tests. This figure is quoted with permission from Kim et al.[44]; (B) Current density-time curves illustrating the corrosion of carbon samples on a double logarithmic scale, conducted in a half-cell at 1.2 V vs. RHE; (C) Comparison of ECSA for the electrodes before and after Pt degradation tests. This figure is quoted with permission from Sebastián et al.[52]; (D) Schematic of carbon support pore morphology effect on Pt NP catalytic activity; (E) Polarization curves of Pt/WMC and Pt/CMK-3 catalysts. This figure is quoted with permission from Song et al.[55]; (F) Pt 4f and N 1s spectra deconvoluted into components for carbon supports and Pt/C catalysts. This figure is quoted with permission from Ma et al.[63]. RHE: Reversible hydrogen electrode; ECSA: electrochemical active surface area; NP: nanoparticle.


