

fig7
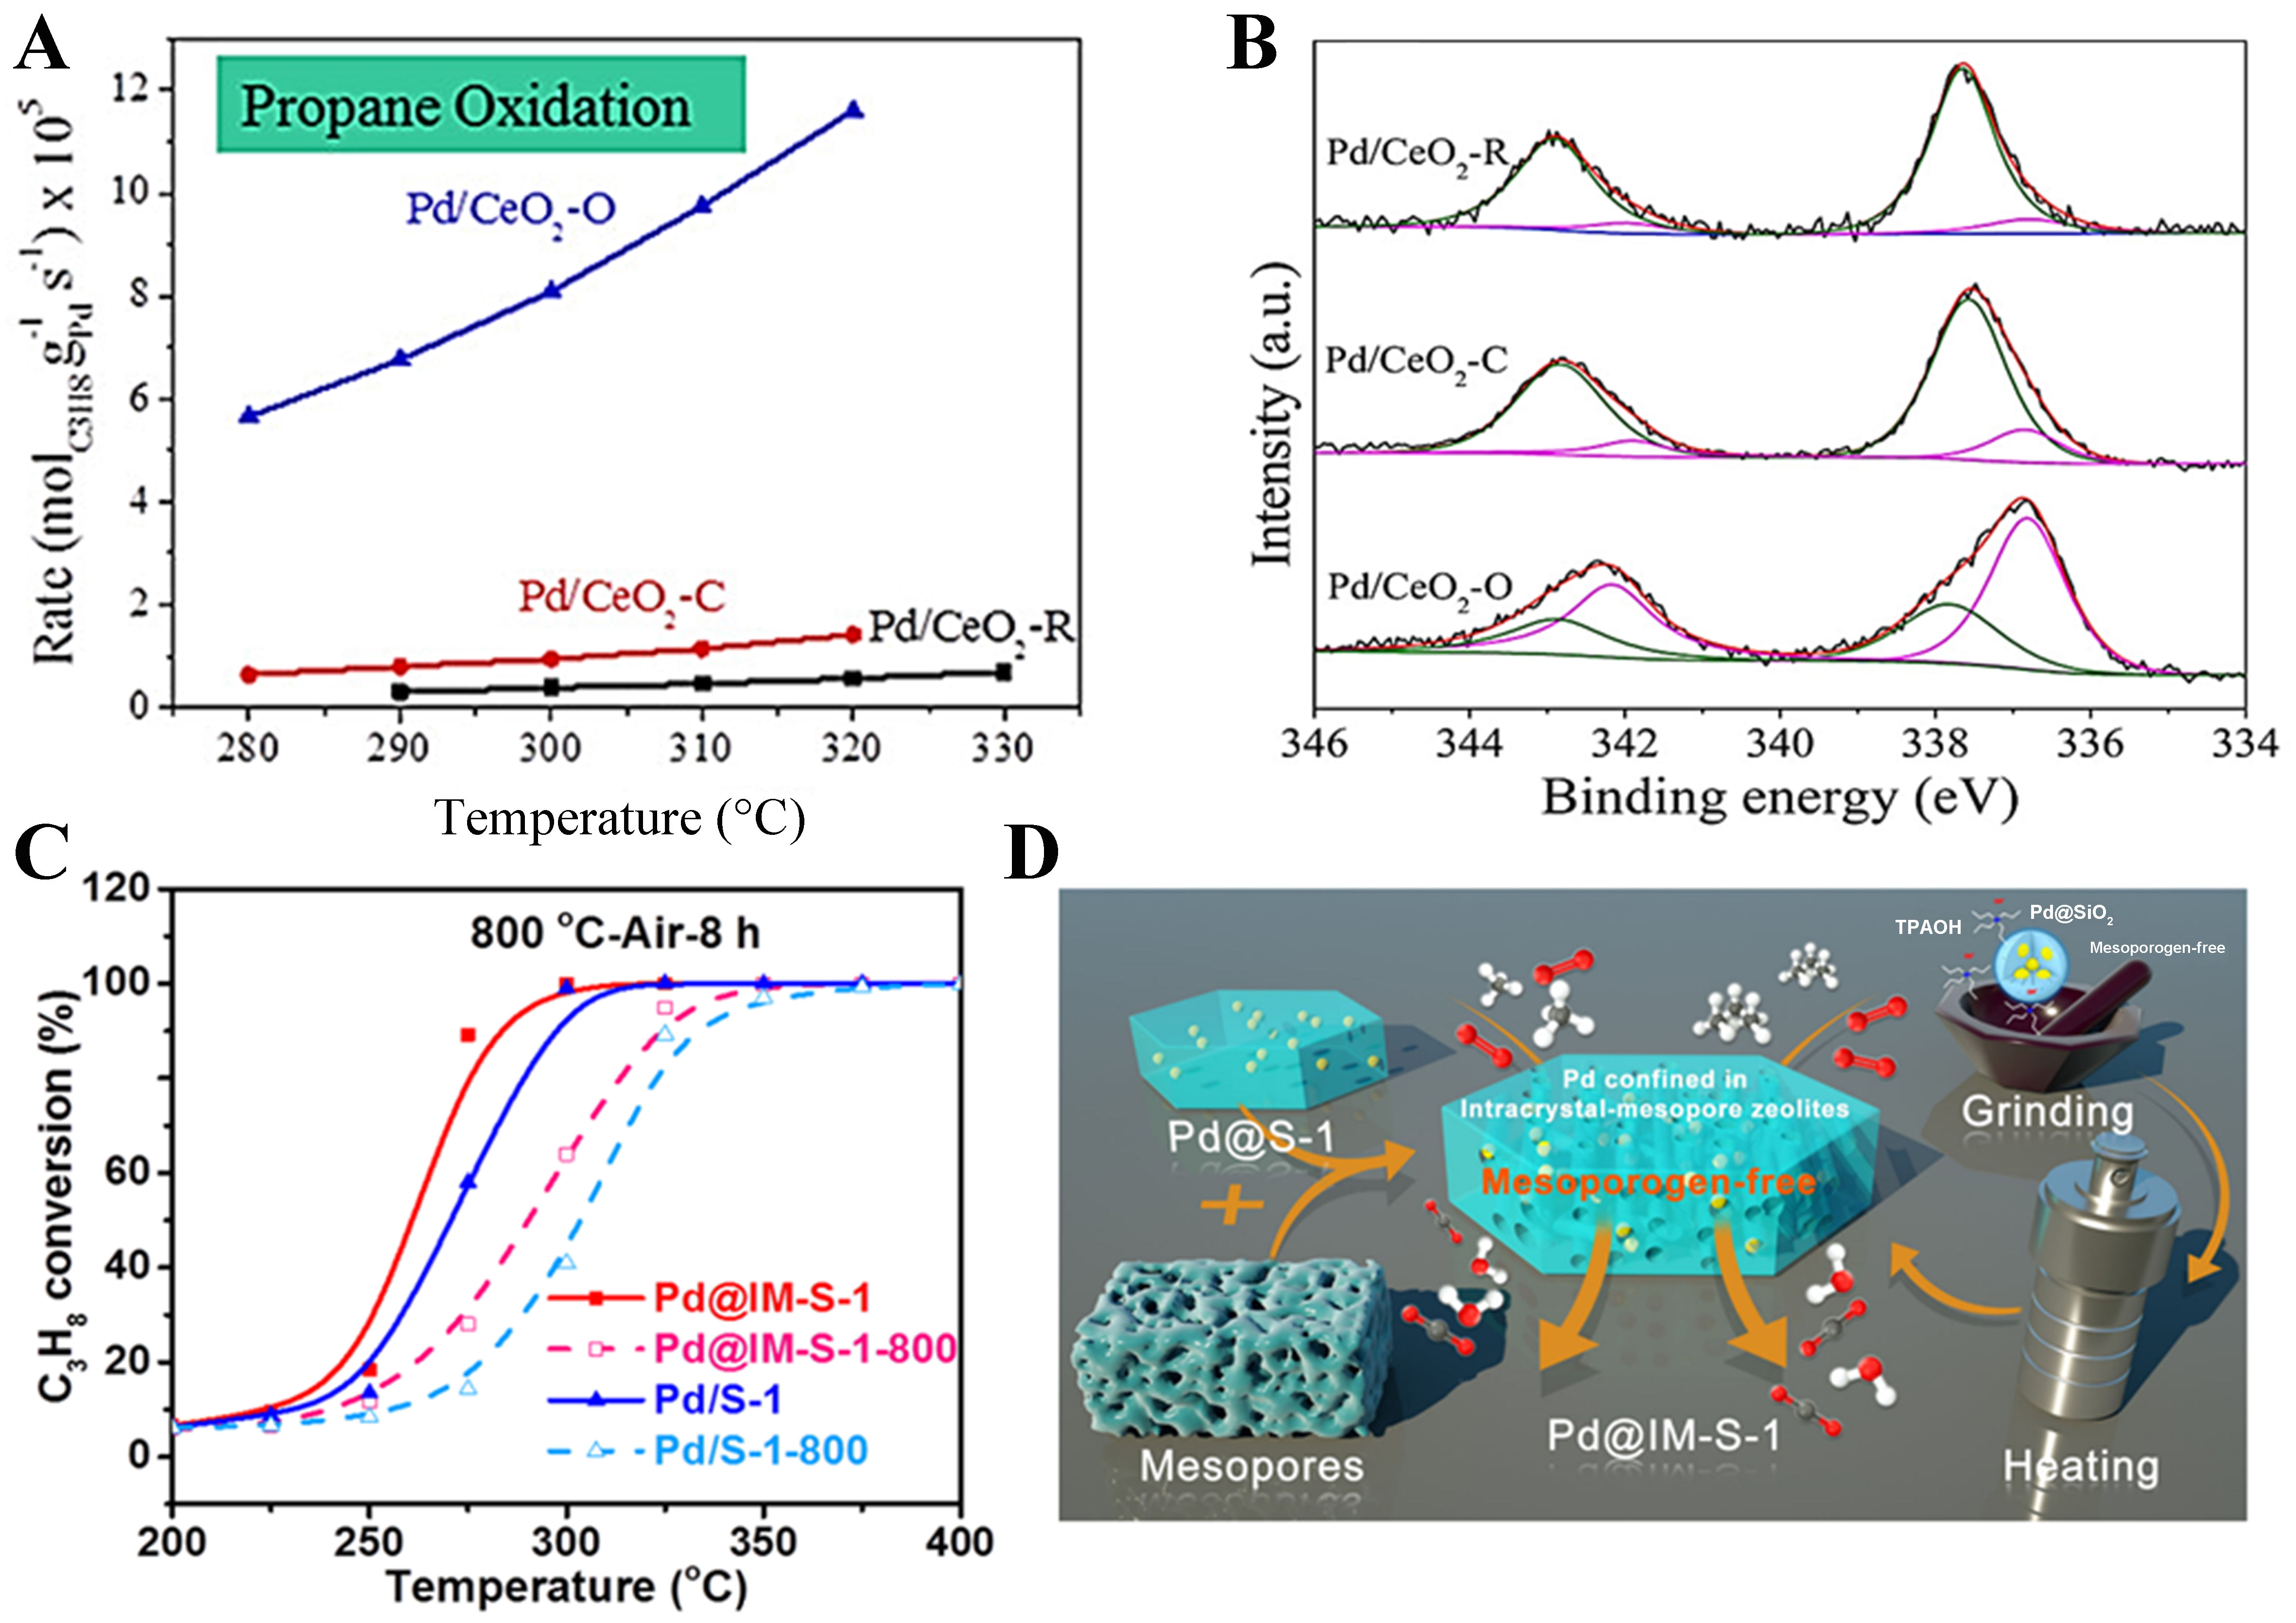
Figure 7. (A and B) Reaction rate in propane oxidation (A) and Pd 3d XPS spectra (B) of Pd/CeO2 catalysts. Reproduced with permission from Ref.[104]; (C and D) Schematic illustration of the synthesis (C) and catalytic performance in propane oxidation over Pd@IM-S-1 and Pd@S-1 (D). Reproduced with permission from Ref.[106]. XPS: X-ray photoelectron spectroscopy.


