

fig4
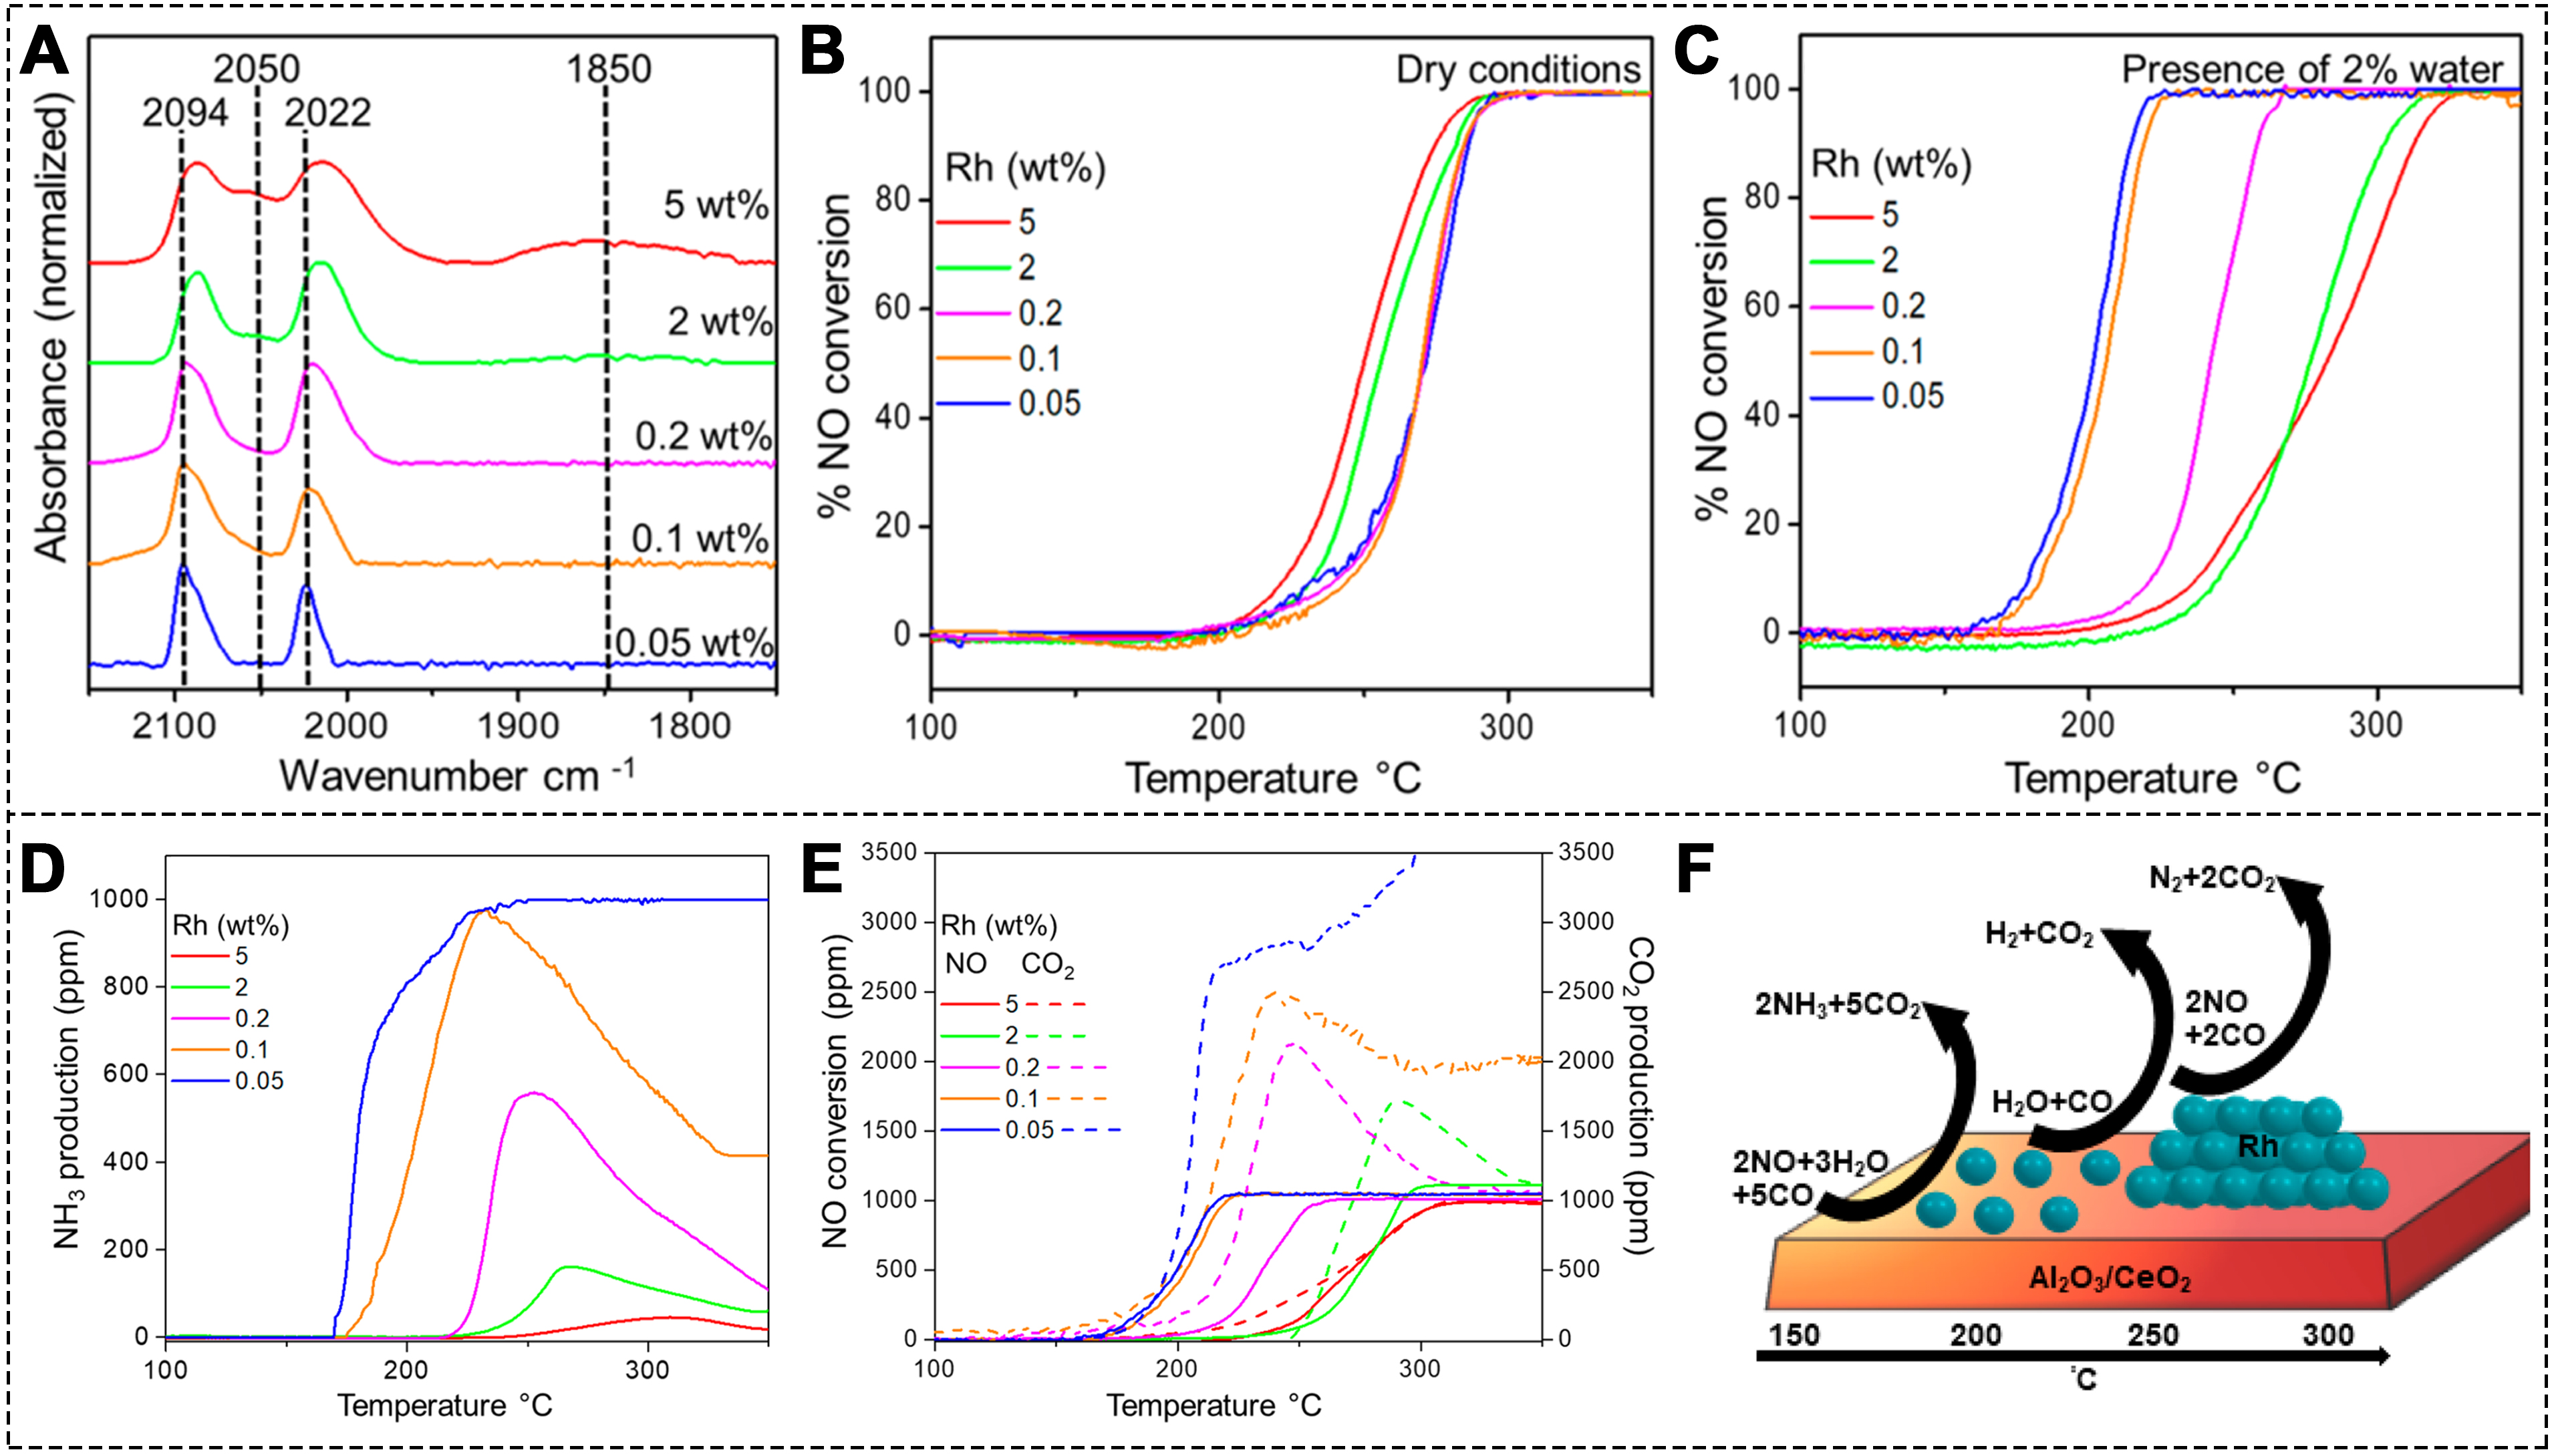
Figure 4. (A) CO-DRIFTS spectra for catalysts with different Rh wt.% contents; (B) NO conversion for different catalysts under dry and (C) wet conditions; (D) NH3 production; (E) NO conversion, and CO2 production for the series of catalysts (1000 ppm NO, 5,000 ppm CO, 2% H2O when used); (F) Schematic of product formation during NO reduction over catalysts with different Rh structures[91]. Copyright 2020, American Chemical Society. CO-DRIFTS: CO diffuse reflectance infrared Fourier transform spectroscopy.


