

fig3
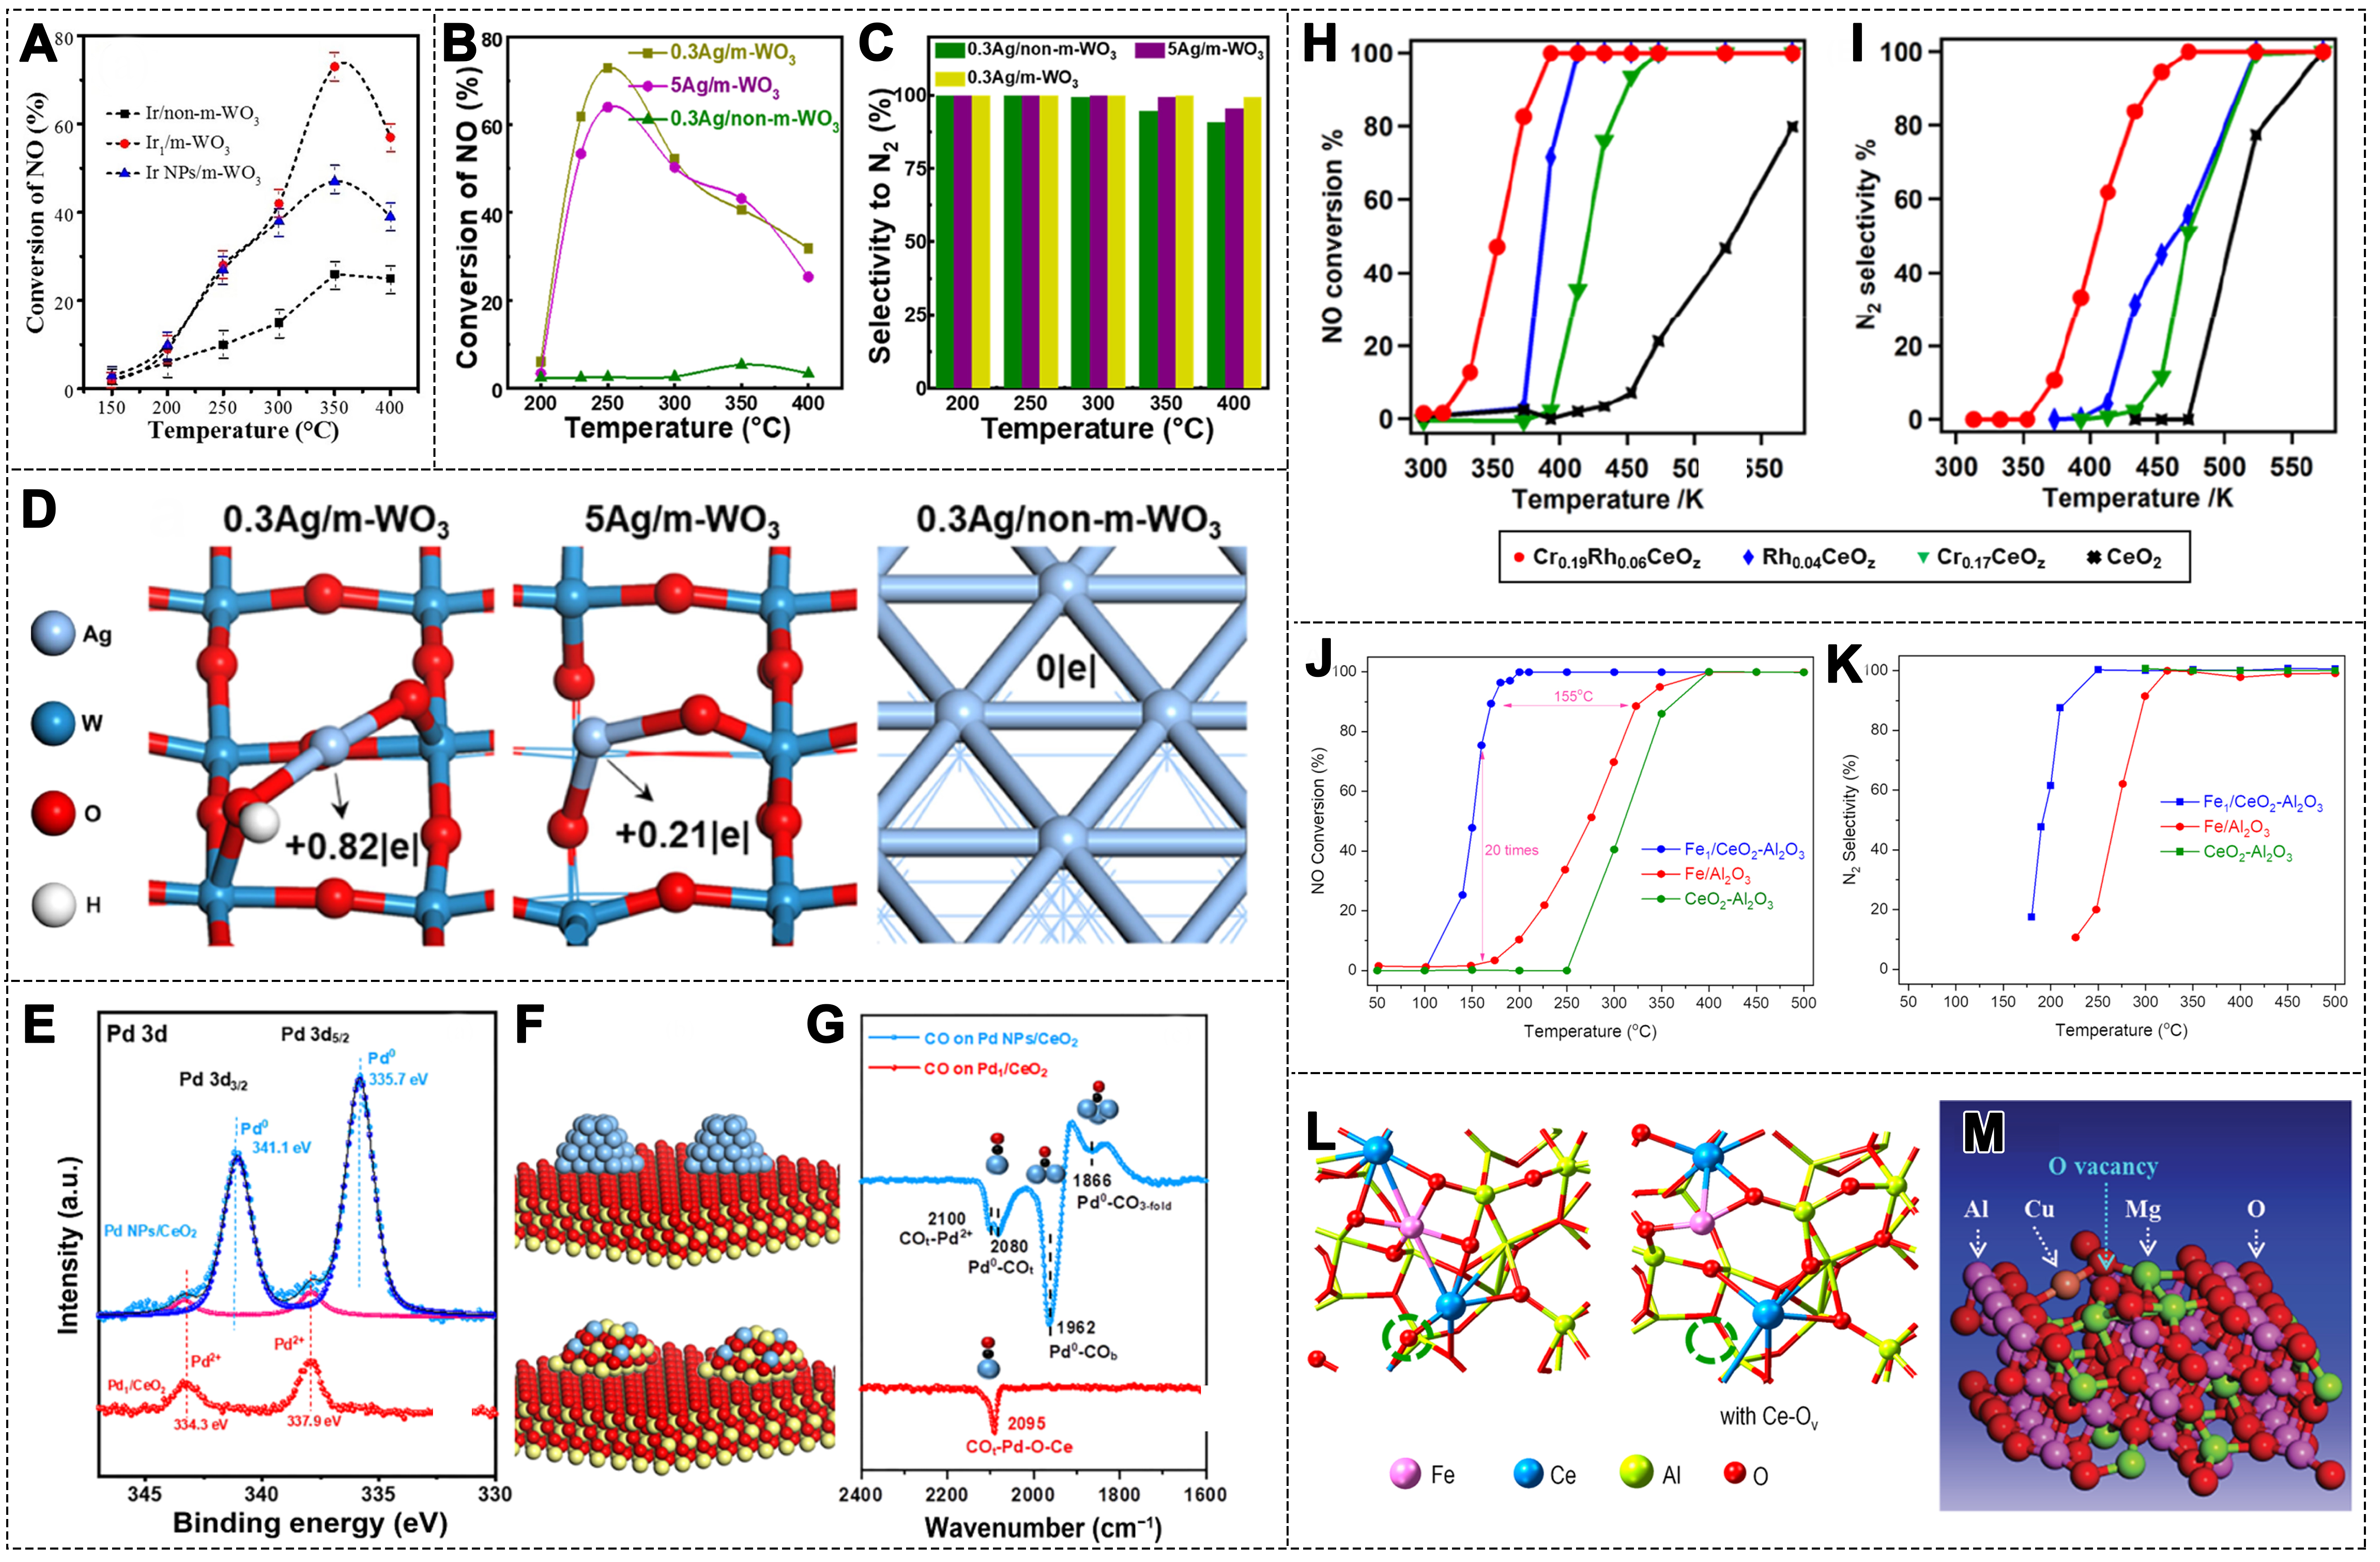
Figure 3. (A) NO conversion over different Ir catalysts (1000 ppm NO, 2,000 ppm CO, 2vol.% O2, N2 balance, GHSV = 50,000 h-1)[74]. Copyright 2021, Wiley-VCH; (B) NO conversion and (C) N2 selectivity over different Ag catalysts; (D) Bader charge values of Ag atoms calculated for different Ag catalysts[79]. Copyright 2023, American Chemical Society; (E) SRPES data for Pd1/CeO2 (red line) and Pd NPs/CeO2 (blue line) samples; (F) The proposed structural models of Pd NPs/CeO2 (top) and Pd1/CeO2 (bottom) catalysts; (G) CO IRAS spectra for Pd1/CeO2 (red line) and Pd NPs/CeO2 (blue line) samples. (color code: yellow, Ce; red, O; blue, Pd; and black, C)[83]. Copyright 2023, Springer; (H) NO conversion and (I) N2 selectivity over Cr0.19Rh0.06CeOz, Rh0.04CeOz, Cr0.17CeOz, and CeO2 (0.5% NO, 1.0% CO, 5% Ar, He balance, GHSV = 65,00 h-1)[84]. Copyright 2021, American Chemical Society; (J) NO conversion and (K) N2 selectivity over Fe1/CeO2-Al2O3, Fe1/Al2O3 and CeO2-Al2O3 (500 ppm NO, 0.6% CO, N2 balance, GHSV 30 000 h-1); (L) Model structure of the catalyst surface with or without Ov[87]. Copyright 2024, American Chemical Society; (M) Model structure of Mg11CuAl24O47 with Ov[90]. Copyright 2019, The Royal Society of Chemistry. Ir: Iridium; GHSV: gas hourly space velocity; SRPES: synchrotron radiation photoemission spectroscopy; Ov: oxygen vacancies.


