

fig4
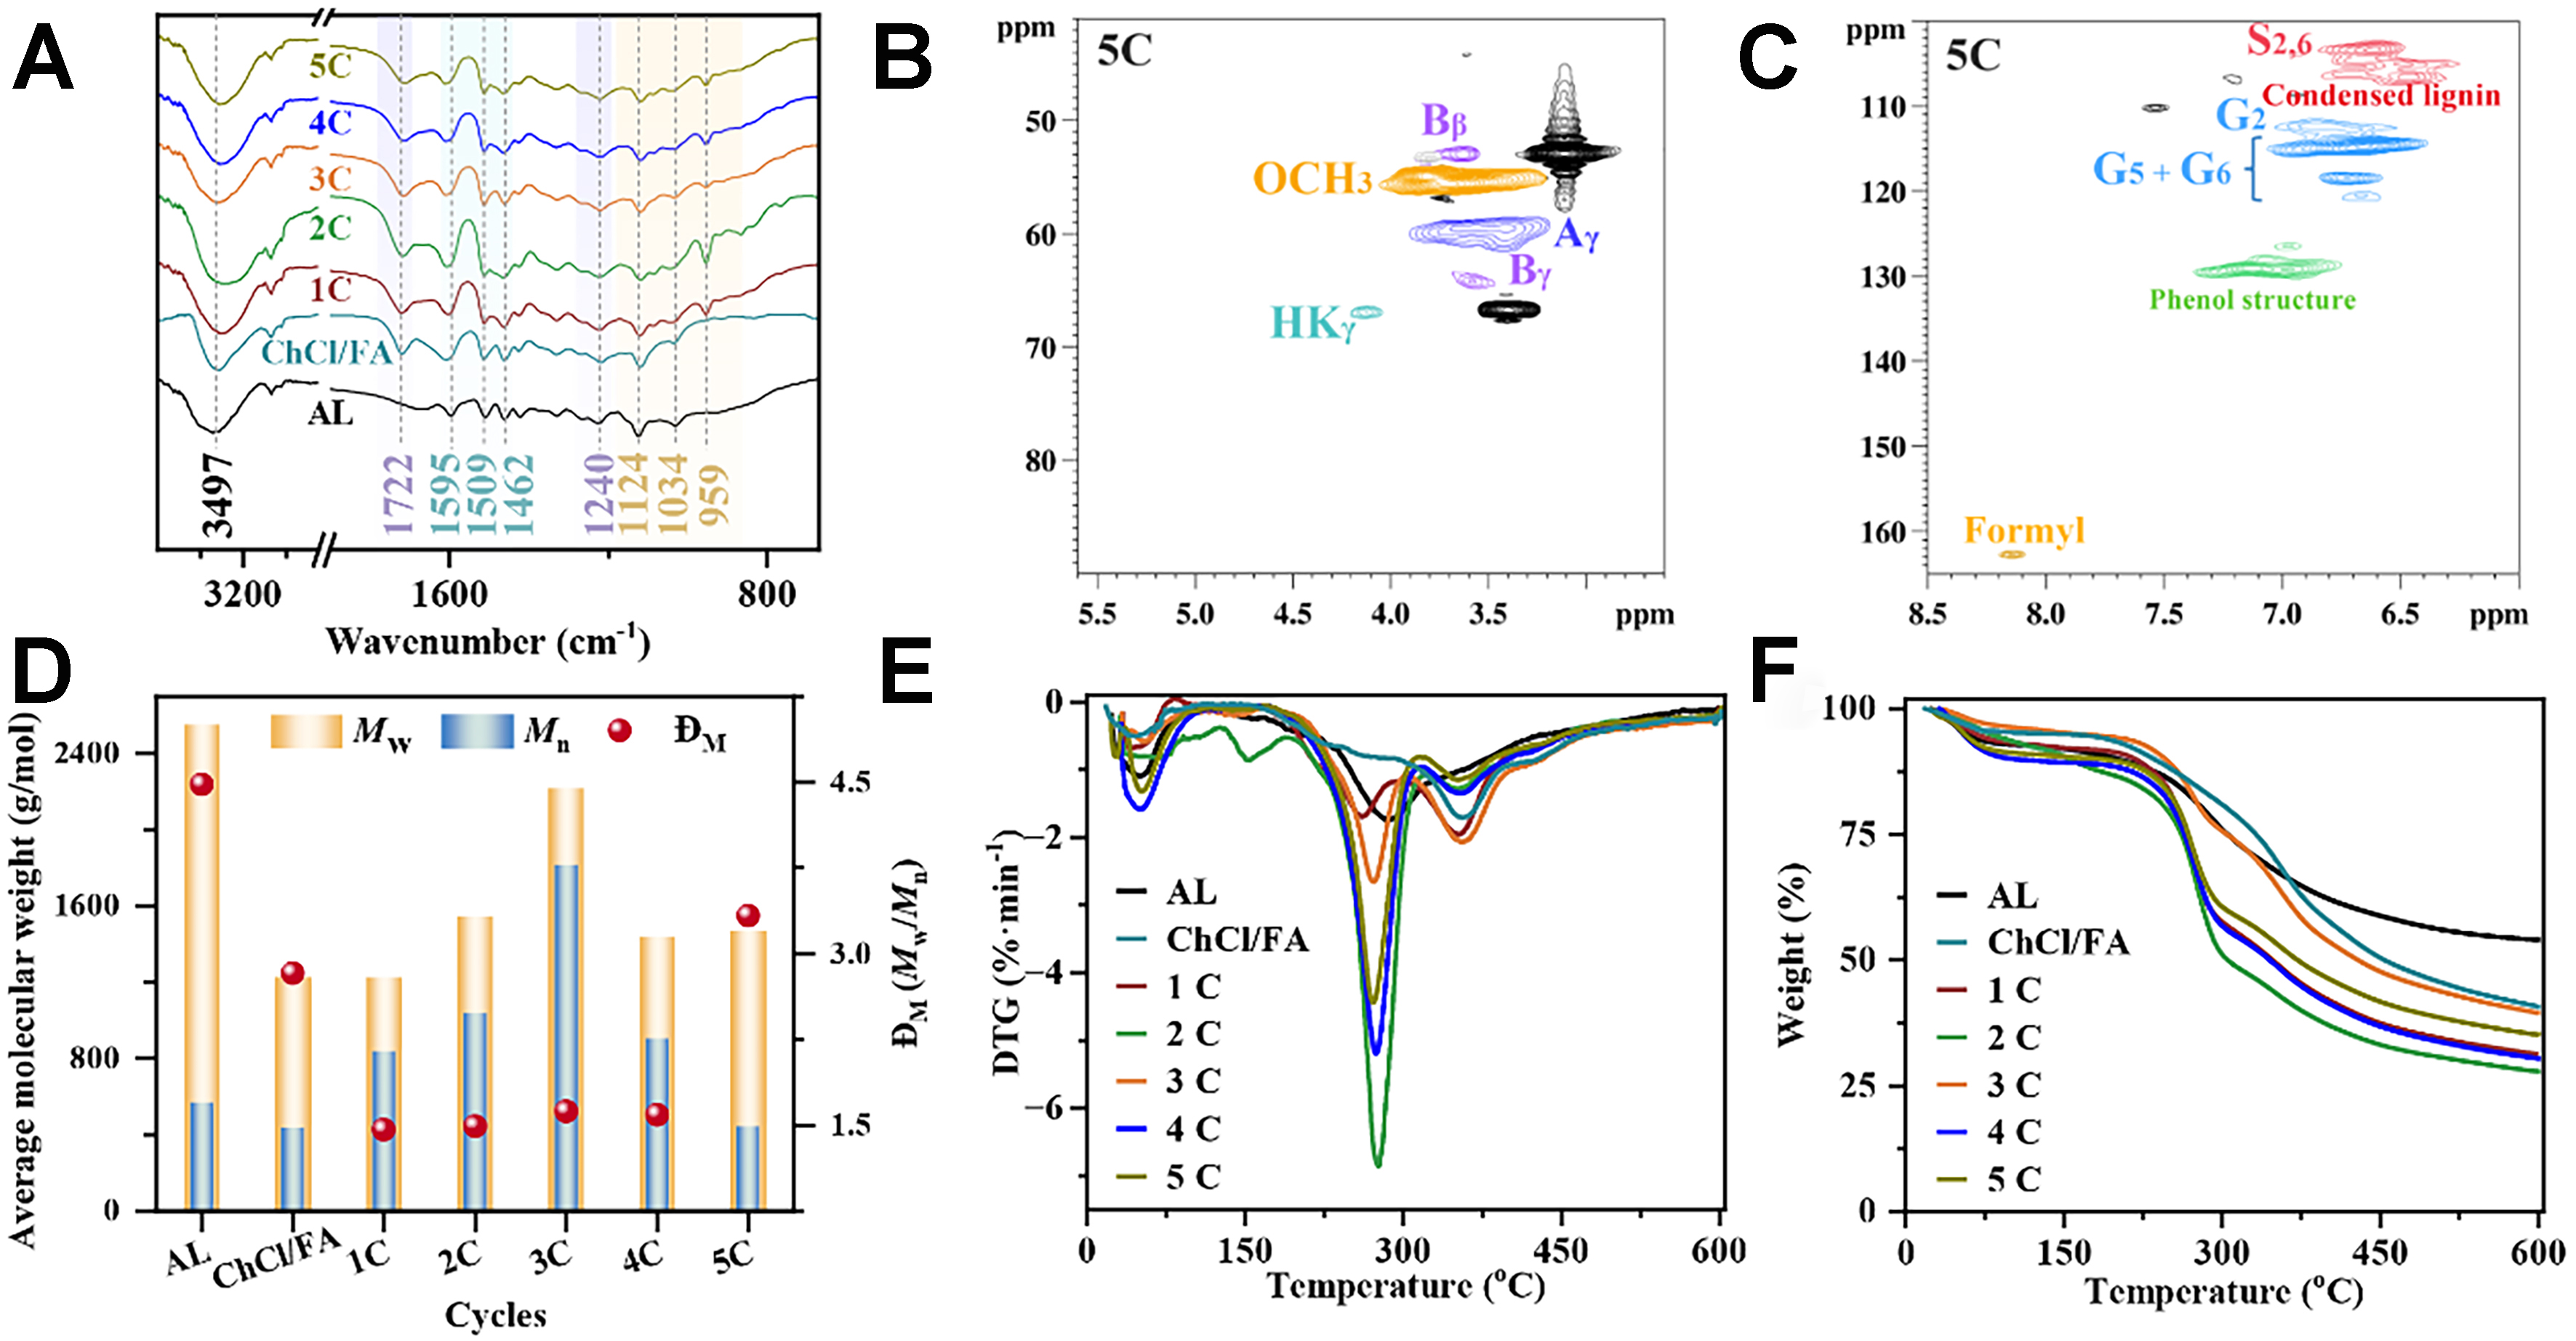
Figure 4. Structure characterization of AL and lignin fractions after cycle. (A) FT-IR curves; (B) aliphatic domain of 2D HSQC spectrum; (C) aromatic domain of 2D HSQC spectrum; (D) molecular weight; (E) DTG curves; (F) TG curves. AL: Alkaline lignin; FT-IR: Fourier transform infrared spectroscopy; HSQC: heteronuclear single quantum coherence; DTG: derivative thermogravimetry; TG: thermogravimetry.


