fig9

Engineering architectures of mesoporous polydopamine and derived carbon: from soft template synthesis to energy applications

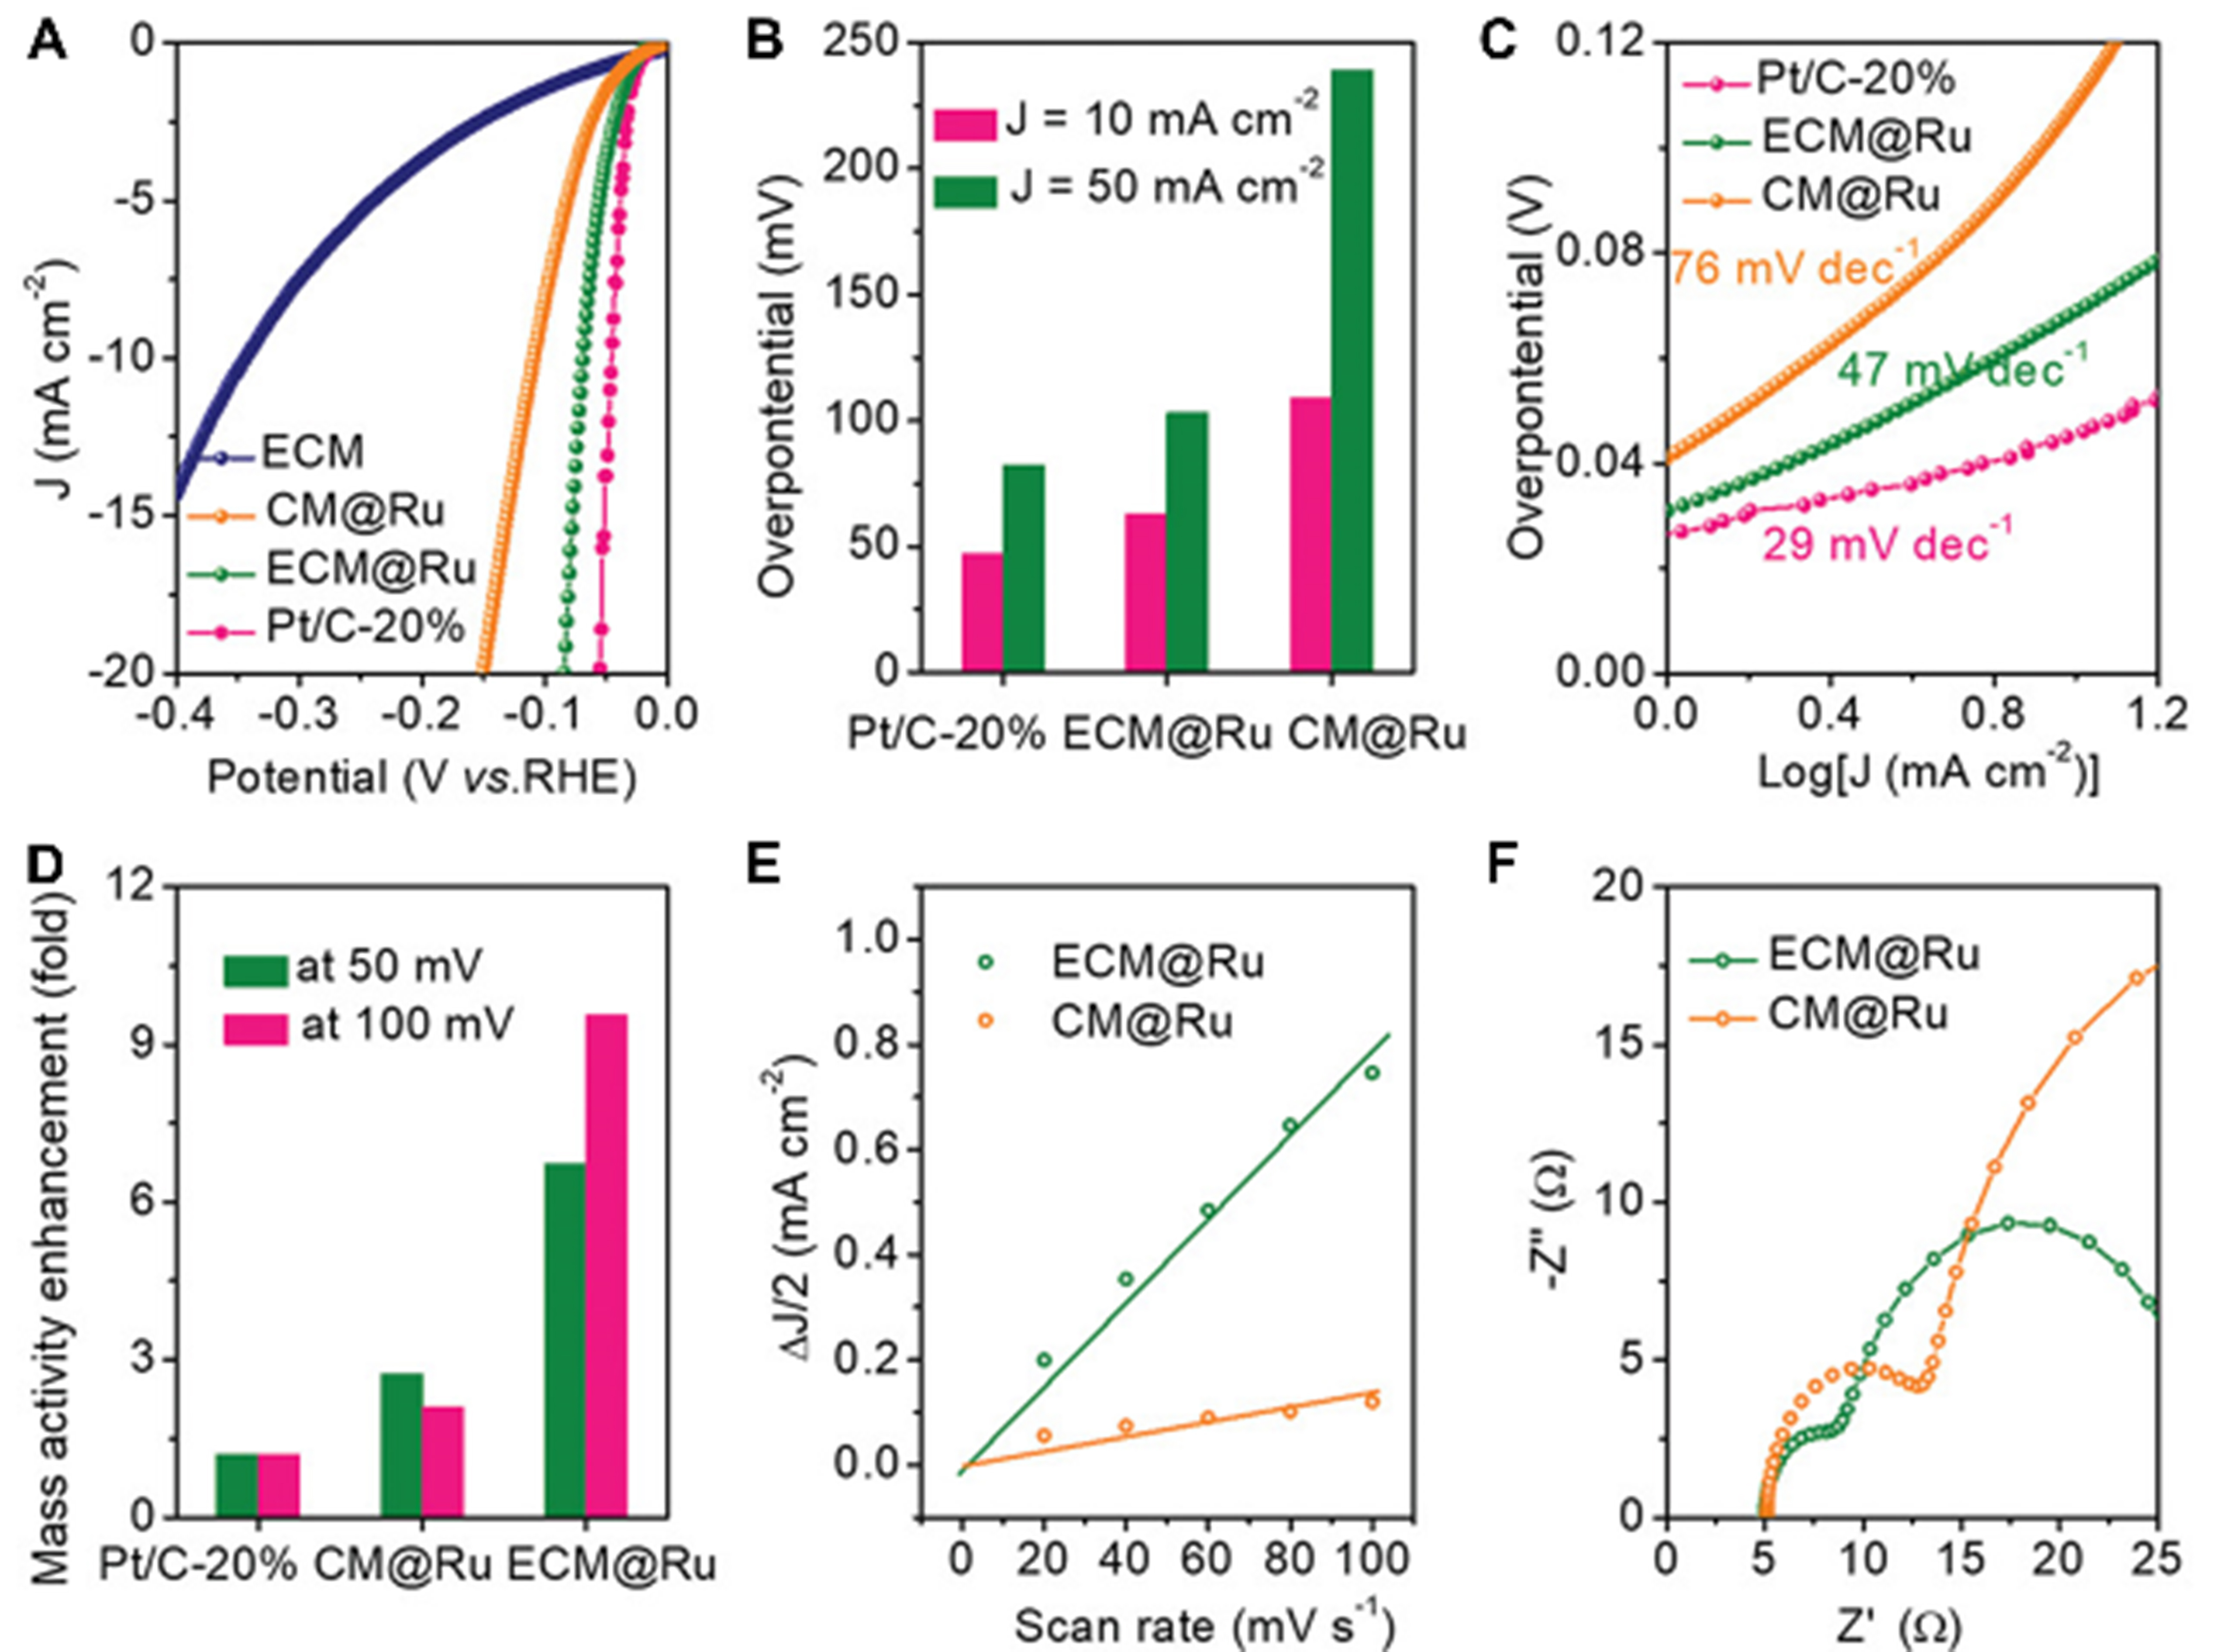
Figure 9. (A) LSV curve and (B) Tafel plot, (C) corresponding overpotentials at J = 10 and 50 mA·cm-2; (D) comparison of mass activity under different overpotentials of the ECM@Ru and compared samples in 0.5 M H2SO4 acid electrolyte; (E) Corresponding capacitive ΔJ/2 as a function of scan rate; (F) Nyquist plots of ECM@Ru and CM@Ru. This figure is quoted with permission from Zhang et al.[108]. LSV: Linear sweep voltammetry; ECM: edge-rich carbon matrix.

Chemical Synthesis
ISSN 2769-5247 (Online)

Portico

All published articles are preserved here permanently:

https://www.portico.org/publishers/oae/

Portico

All published articles are preserved here permanently:

https://www.portico.org/publishers/oae/