

fig2
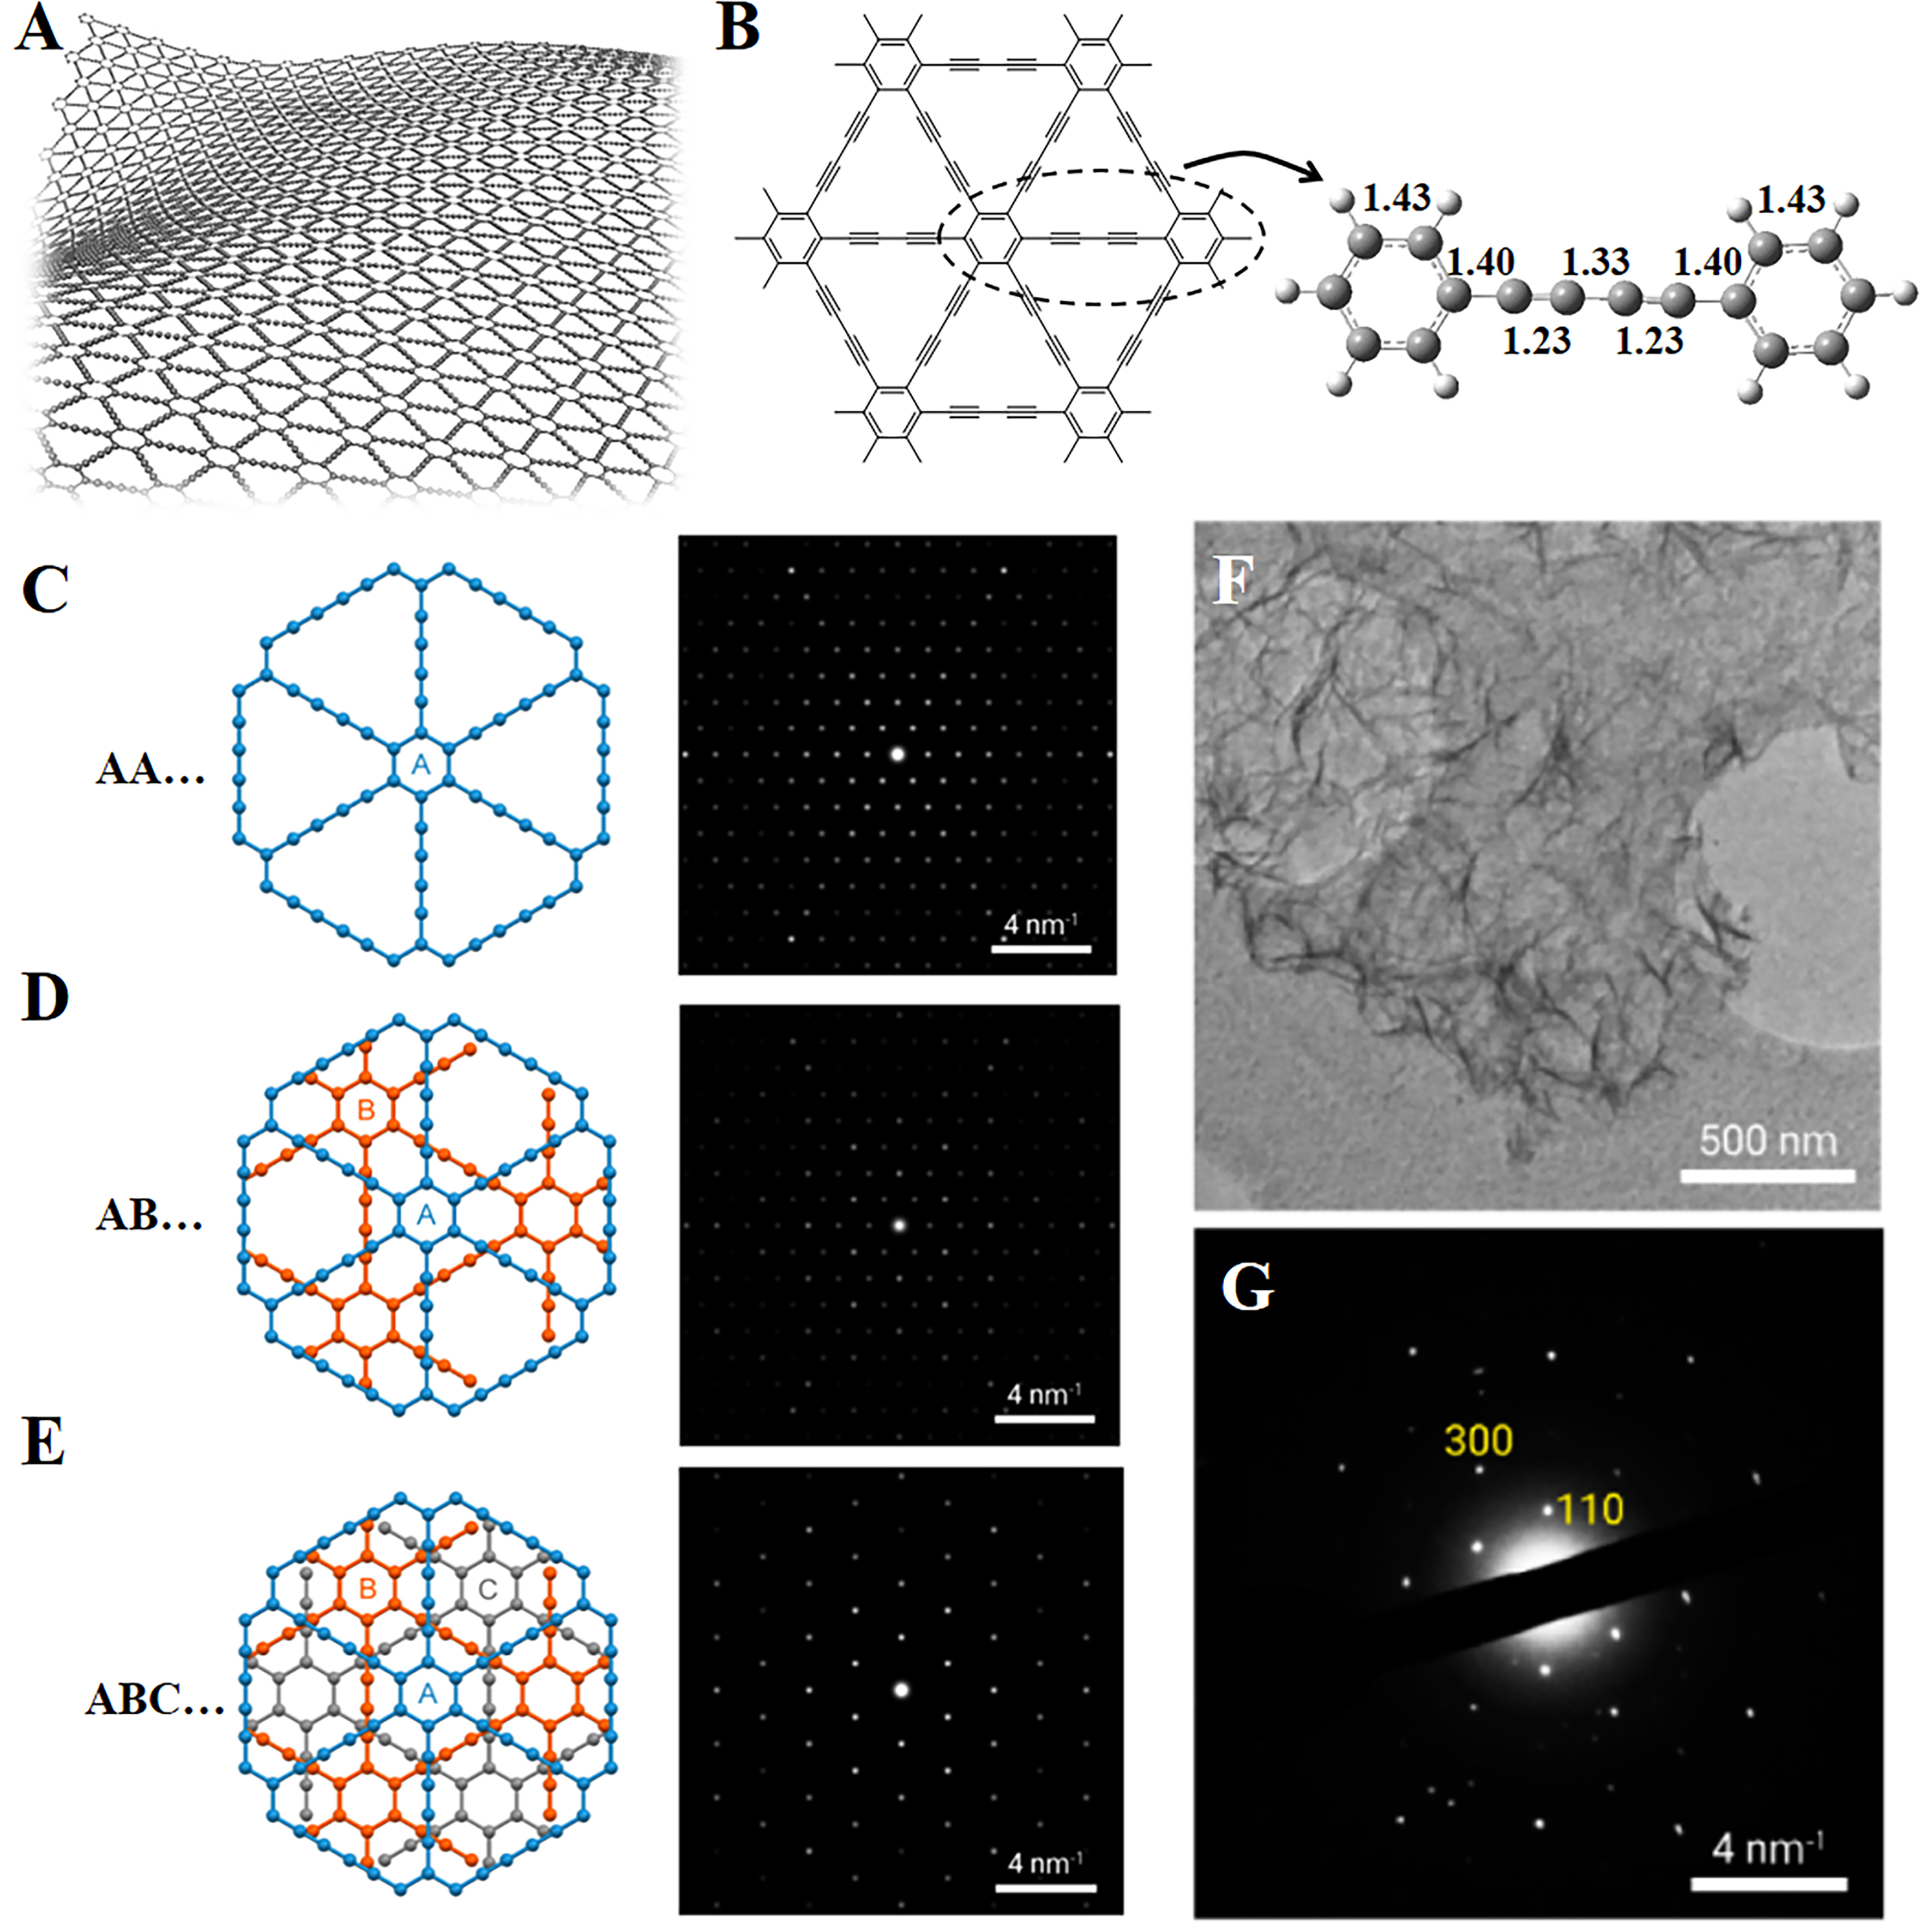
Figure 2. (A) Molecular model of two-dimensional GDY; (B) C–C bond length in GDY; (C-E) Left: three models of interlayer molecular stacking of GDY. Right: SAED; (F) TEM image of GDY nanosheets; (G) SAED pattern of GDY from experiments, and numerical values denote Miller indices. This figure is used with permission from Matsuoka et al.[30]. GDY: Graphdiyne; SAED: selected-area electron diffraction patterns.


