

fig9
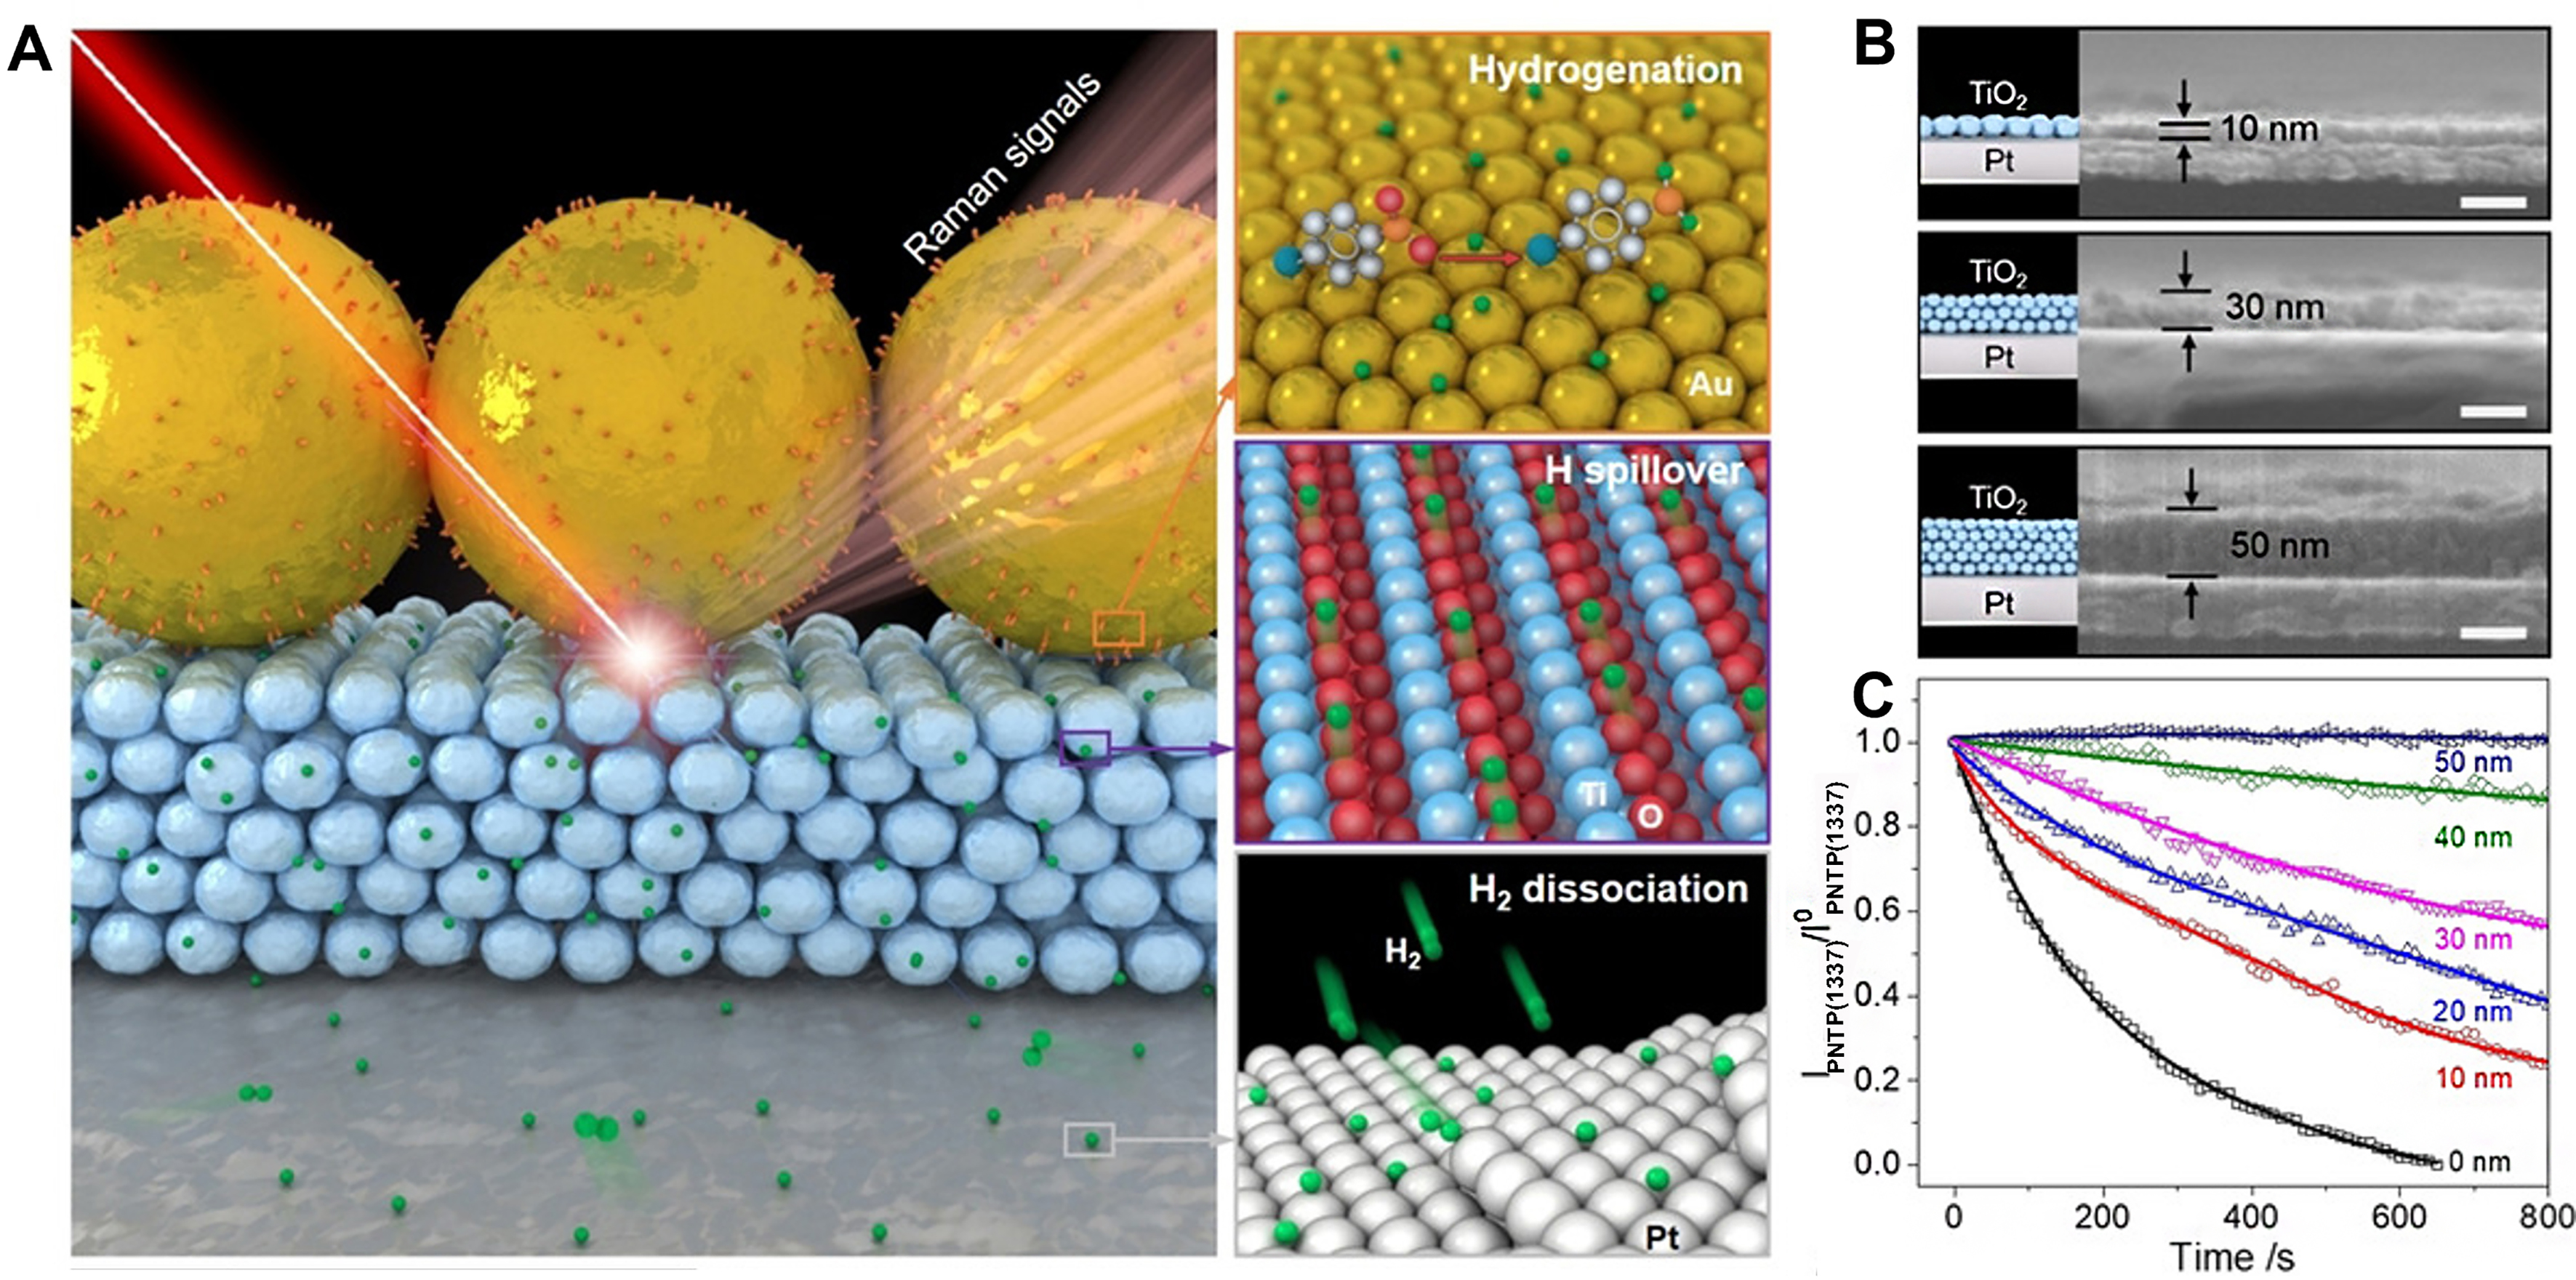
Figure 9. (A) Scheme of hydrogen spillover on Au/TiO2/Pt; (B) Cross-sectional SEM images of TiO2/Pt; (C) Time-dependent intensity of the Raman band (at 1,337 cm-1) for the hydrogenation of p-NTP on Au/TiO2/Pt with different TiO2 layers. Reproduced with permission from Ref.[132]. Copyright 2020, John Wiley and Sons. SEM: Scanning electron microscopy; p-NTP: para-nitrothiophenol.


