

Assessing global carbon mitigation benefits of wind power with spatiotemporal characteristics and production-deployment pathways
 0
0 
Graphical Abstract
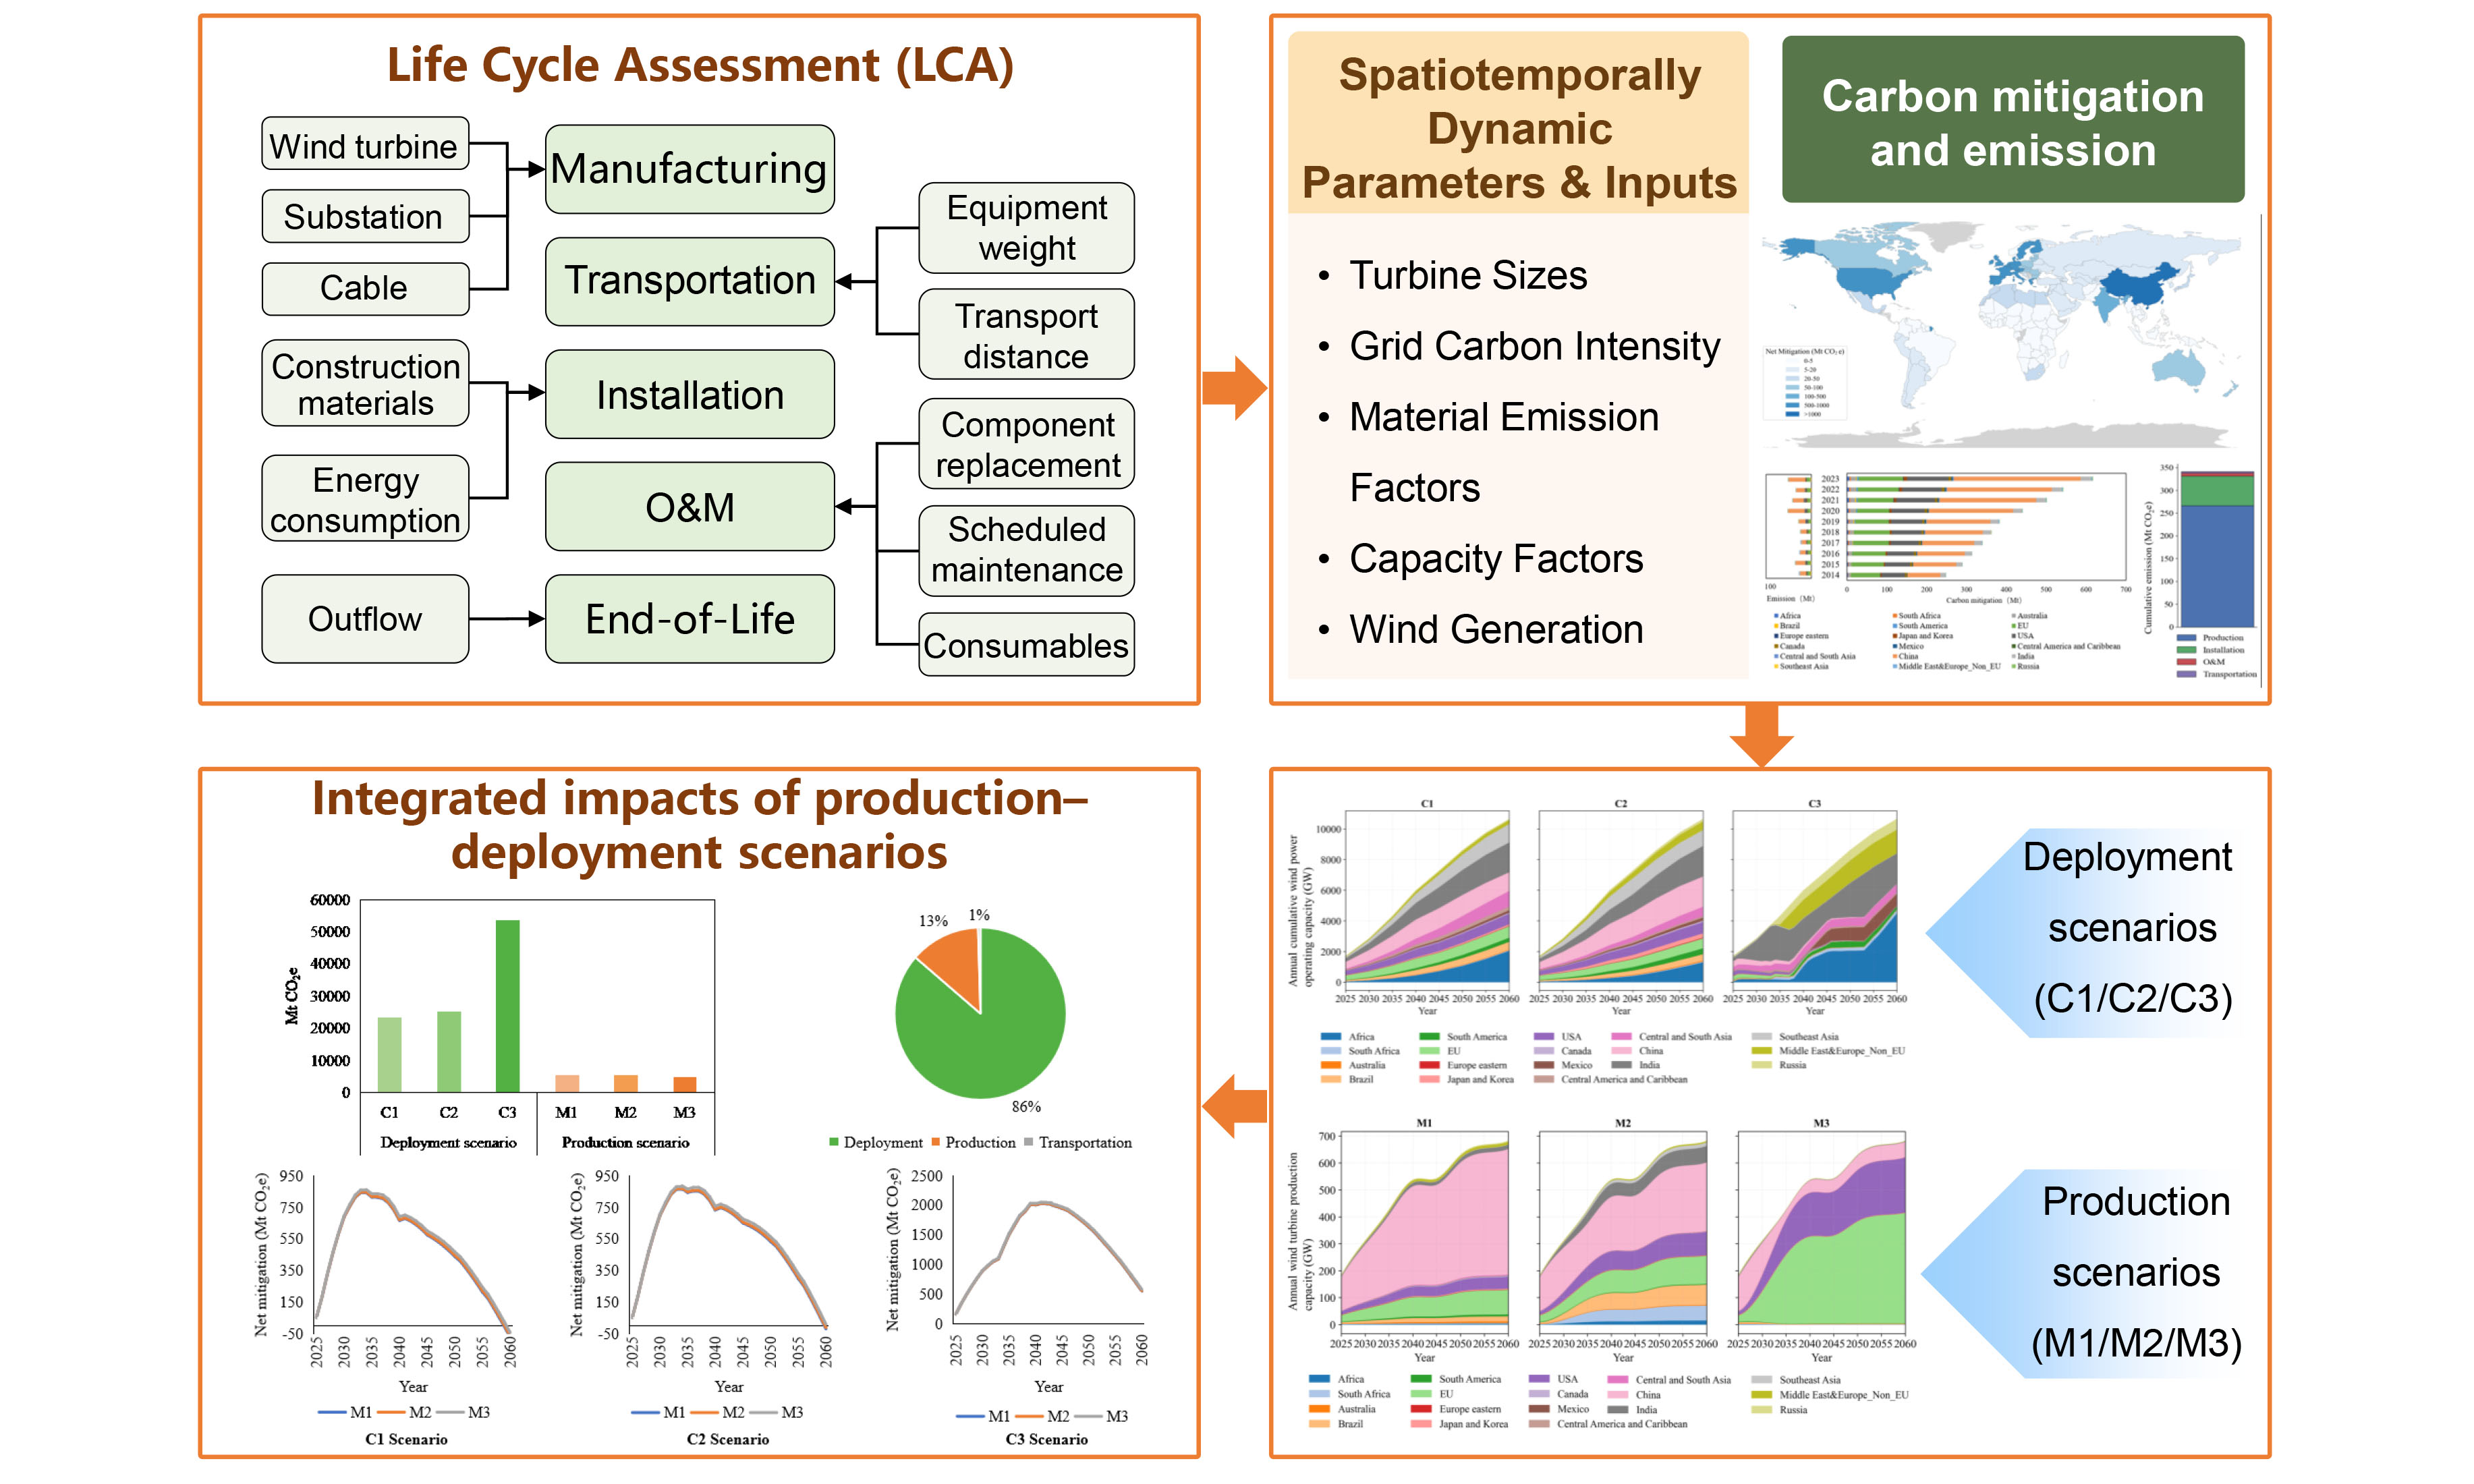
Abstract
As wind power capacity continues expanding, its carbon-reduction effectiveness increasingly hinges on the spatiotemporal alignment of production, deployment, and power systems. However, these dimensions are assessed separately, and the role of spatiotemporal interactions in shaping carbon mitigation benefits remains unclear. Here, we develop a spatiotemporal life cycle assessment framework and systematically evaluate the carbon mitigation benefits of global onshore wind power across historical (2014-2023) and future (2025-2060) periods. We show that global wind power achieved cumulative net carbon mitigation benefits of 3,690 Mt CO2e over 2014-2023, while carbon emissions accounted for 8.5% of the direct carbon mitigation benefits from fossil-fuel electricity displacement. Under counterfactual settings, the climate-priority deployment scenario (C3) increases cumulative mitigation to 53,711 ± 935 Mt CO2e by 2060, approximately 2.3 times that of the baseline deployment scenario (C1). The clean-oriented production scenario (M3) yields comparatively modest gains, reducing carbon emissions by approximately 14% relative to the baseline production scenario (M1). The spatially diversified production scenario (M2) achieves the lowest transportation emissions, with cumulative reductions of approximately 6% and approximately 24% relative to M1 and M3. Under the baseline and balanced deployment scenarios (C1/C2), annual net mitigation peaks around 2034 and then declines persistently. In some production-deployment combinations, it turns negative by 2060 due to grid decarbonization. Conversely, scenario C3 remains positive throughout 2025-2060. The work provides scientific evidence for enhancing the carbon mitigation effectiveness of wind power development and boosting climate benefits through international coordinated planning, alongside decision support for optimizing wind power deployment and supply chain configurations.
Keywords


 Download PDF
INTRODUCTION
Achieving global net-zero greenhouse gas emissions places profound demands on the large-scale deployment of renewable energy technologies[1]. Wind energy has expanded rapidly over the past decade, driven by its technological maturity, continuously declining costs, and increasingly strong policy support. It has now become one of the most important pillar technologies in the global decarbonization process[2]. Global cumulative installed wind power capacity increased sharply from 24 GW in 2000 to 1,299 GW in 2025[3], corresponding to a compound annual growth rate of approximately 17.3%. Currently, wind power generation accounts for around 9.5% of global electricity demand, making a substantial contribution to carbon mitigation in the power sector. Notably, onshore wind remains the dominant component of total installed capacity. At the same time, greenhouse gas emissions from wind turbine production, alongside the climate mitigation benefits derived from substituting fossil-fuel-based electricity, are jointly determined by multiple factors[4,5]. These factors give rise to pronounced spatial heterogeneity and temporal dynamics. Given the significant variations in the development trajectories of wind power supply chains across regions, overlooking the geographical configuration of the supply chains and regional disparities in electricity mix during global wind power expansion could lead to missed opportunities to maximize the carbon mitigation potential of wind energy. This concern grows particularly critical as wind power continues to expand and supply chains become more globally integrated[6].
Life cycle assessment (LCA) has been extensively applied in existing studies to evaluate the environmental impacts of wind power systems[7-15]. Existing studies confirm that wind power is not entirely “zero-emission” at the life cycle level[16]. Empirical evidence from China indicates that the life cycle emission intensity of wind power is approximately 19.88 g CO2e/kWh, which translates into a nearly 98% reduction compared with fossil-fuel-based generation[17]. The manufacturing stage is consistently identified as the primary contributor to environmental burdens[18]. Multiple factors, including turbine size, technology pathway, site conditions, capacity factors, and recycling assumptions, exert substantial impacts on the emission estimates[19,20]. Moreover, most current LCA studies rely on static emission factors for electricity, fuels, and key materials. These factors are derived from the Intergovernmental Panel on Climate Change (IPCC) guidelines, national databases, or published academic literature[21]. However, static grid emission factors may overestimate wind power’s long-term CO2 mitigation benefits, as they neglect the dilution effect of grid decarbonization[22].
The global geography of wind turbine production and deployment has evolved through interactions among technology leadership, industrial competitiveness, and policy support[23]. In the 1990s, Europe and the United States led early market formation. Since around 2010, China has achieved rapid expansion, emerging as both a key manufacturing center and the world’s largest deployment market. Meanwhile, countries such as India and Brazil have strengthened their regional manufacturing roles. As a result, the current supply chains are organized around several major production hubs, including China, Europe, India, the United States, and Brazil[24]. This evolving production-deployment structure directly shapes the geographic distribution of life cycle carbon emissions and the realization of net carbon mitigation benefits.
Given the current concentration of global manufacturing capacity and growing policy intervention, the future spatial configuration of the wind power supply chains remains uncertain. Increasing attention to supply-chain concentration, industrial resilience, trade risks, and carbon leakage has prompted renewed interest in more diversified and regionalized production arrangements. Policies such as the U.S. Inflation Reduction Act (IRA) and the European Union’s Carbon Border Adjustment Mechanism (CBAM) aim to reshape clean energy supply chains. By incentivizing domestic or regional production, these policies potentially alter the current global production landscape[25,26]. Driven by national net-zero targets and the demand for supply chain diversification, the geographical configuration of the global wind power industry may evolve along multiple pathways in the future. Given the substantial variations in electricity mix and emission intensities across production regions, alternative production layout choices will directly affect the spatial distribution of carbon emissions along the wind power supply chains, as well as their overall carbon mitigation performance.
Against the backdrop of rapidly expanding global installed capacity and evolving supply chain configurations, it is crucial to understand how the production and deployment patterns of the global wind power industry shape net carbon mitigation benefits. Nevertheless, studies on the spatiotemporally dynamic characterization of carbon emissions and mitigation intensities at the global scale - particularly across production and deployment stages - remain insufficient[27-30]. These intensities are affected not only by the emission characteristics of production processes, but also by technological levels, regional wind resource endowments, cumulative electricity generation, and the emission structure of local power systems[31,32]. Furthermore, most mainstream future scenario projections rely on inertial assumptions rooted in electricity demand growth and historical trends. These assumptions fail to adequately consider how alternative production-deployment scenario choices may reshape the global mitigation landscape. This oversight may lead to missed opportunities to enhance the climate benefits of wind power through coordinated international planning. Therefore, it is essential to conduct quantitative analyses of different production-deployment scenarios on the basis of projected installation scales and regional allocations in existing mainstream scenarios.
Here, this study develops a spatiotemporal LCA framework that integrates multi-source heterogeneous data to construct dynamic grid emission factors, historical activity levels, and future activity projections. The framework is applied to quantify regional carbon emissions and carbon mitigation benefits during the historical period (2014-2023). This process identifies evolutionary trends and regional disparities in both carbon mitigation and emission intensity. For the future period (2025-2060), the study further incorporates Global Change Analysis Model (GCAM) scenario data and material flow analysis. It compares baseline scenarios with counterfactual scenarios across production and deployment, examining how different pathway combinations shape global and regional carbon emissions and mitigation benefits. The findings provide scientific evidence for enhancing the carbon mitigation effectiveness of wind power development and for improving climate benefits through international coordinated planning. They also offer decision support for optimizing global wind power deployment and supply chain configurations.
METHODS
Life cycle assessment
This study employs a process-based life cycle assessment (LCA) approach to systematically evaluate the life cycle carbon emissions and net carbon mitigation benefits of global onshore wind power systems during the historical (2014-2023) and future (2025-2060) periods [Figure 1]. The system boundary encompasses the entire life cycle from material production, component production, international transportation, construction and installation, operation and maintenance, as well as decommissioning and recycling. The framework adheres to ISO 14040/14044 standards[33,34]. The functional unit is defined as the life cycle carbon emissions per MW of installed onshore wind power capacity. Carbon mitigation benefits are measured by the greenhouse gas reductions achieved by substituting fossil-fuel-based electricity during the operational phase. The lifespan of wind turbines follows a Weibull distribution[35], with a mean lifespan of 20 years, as an assumption widely recognized in the wind industry[36]. This study quantifies four core indicators, namely life cycle carbon emissions, direct carbon mitigation benefits, net carbon mitigation benefits, and regional contributions. Life cycle carbon emissions refer to the emissions associated with wind turbine production, transportation, installation, and related life cycle stages. Direct carbon mitigation benefits represent the emission reductions from substituting non-renewable electricity generation with wind power. Net carbon mitigation benefits are derived by subtracting life cycle carbon emissions from carbon mitigation benefits. Regional contributions reflect the variations in mitigation benefits associated with regional deployment and production patterns.
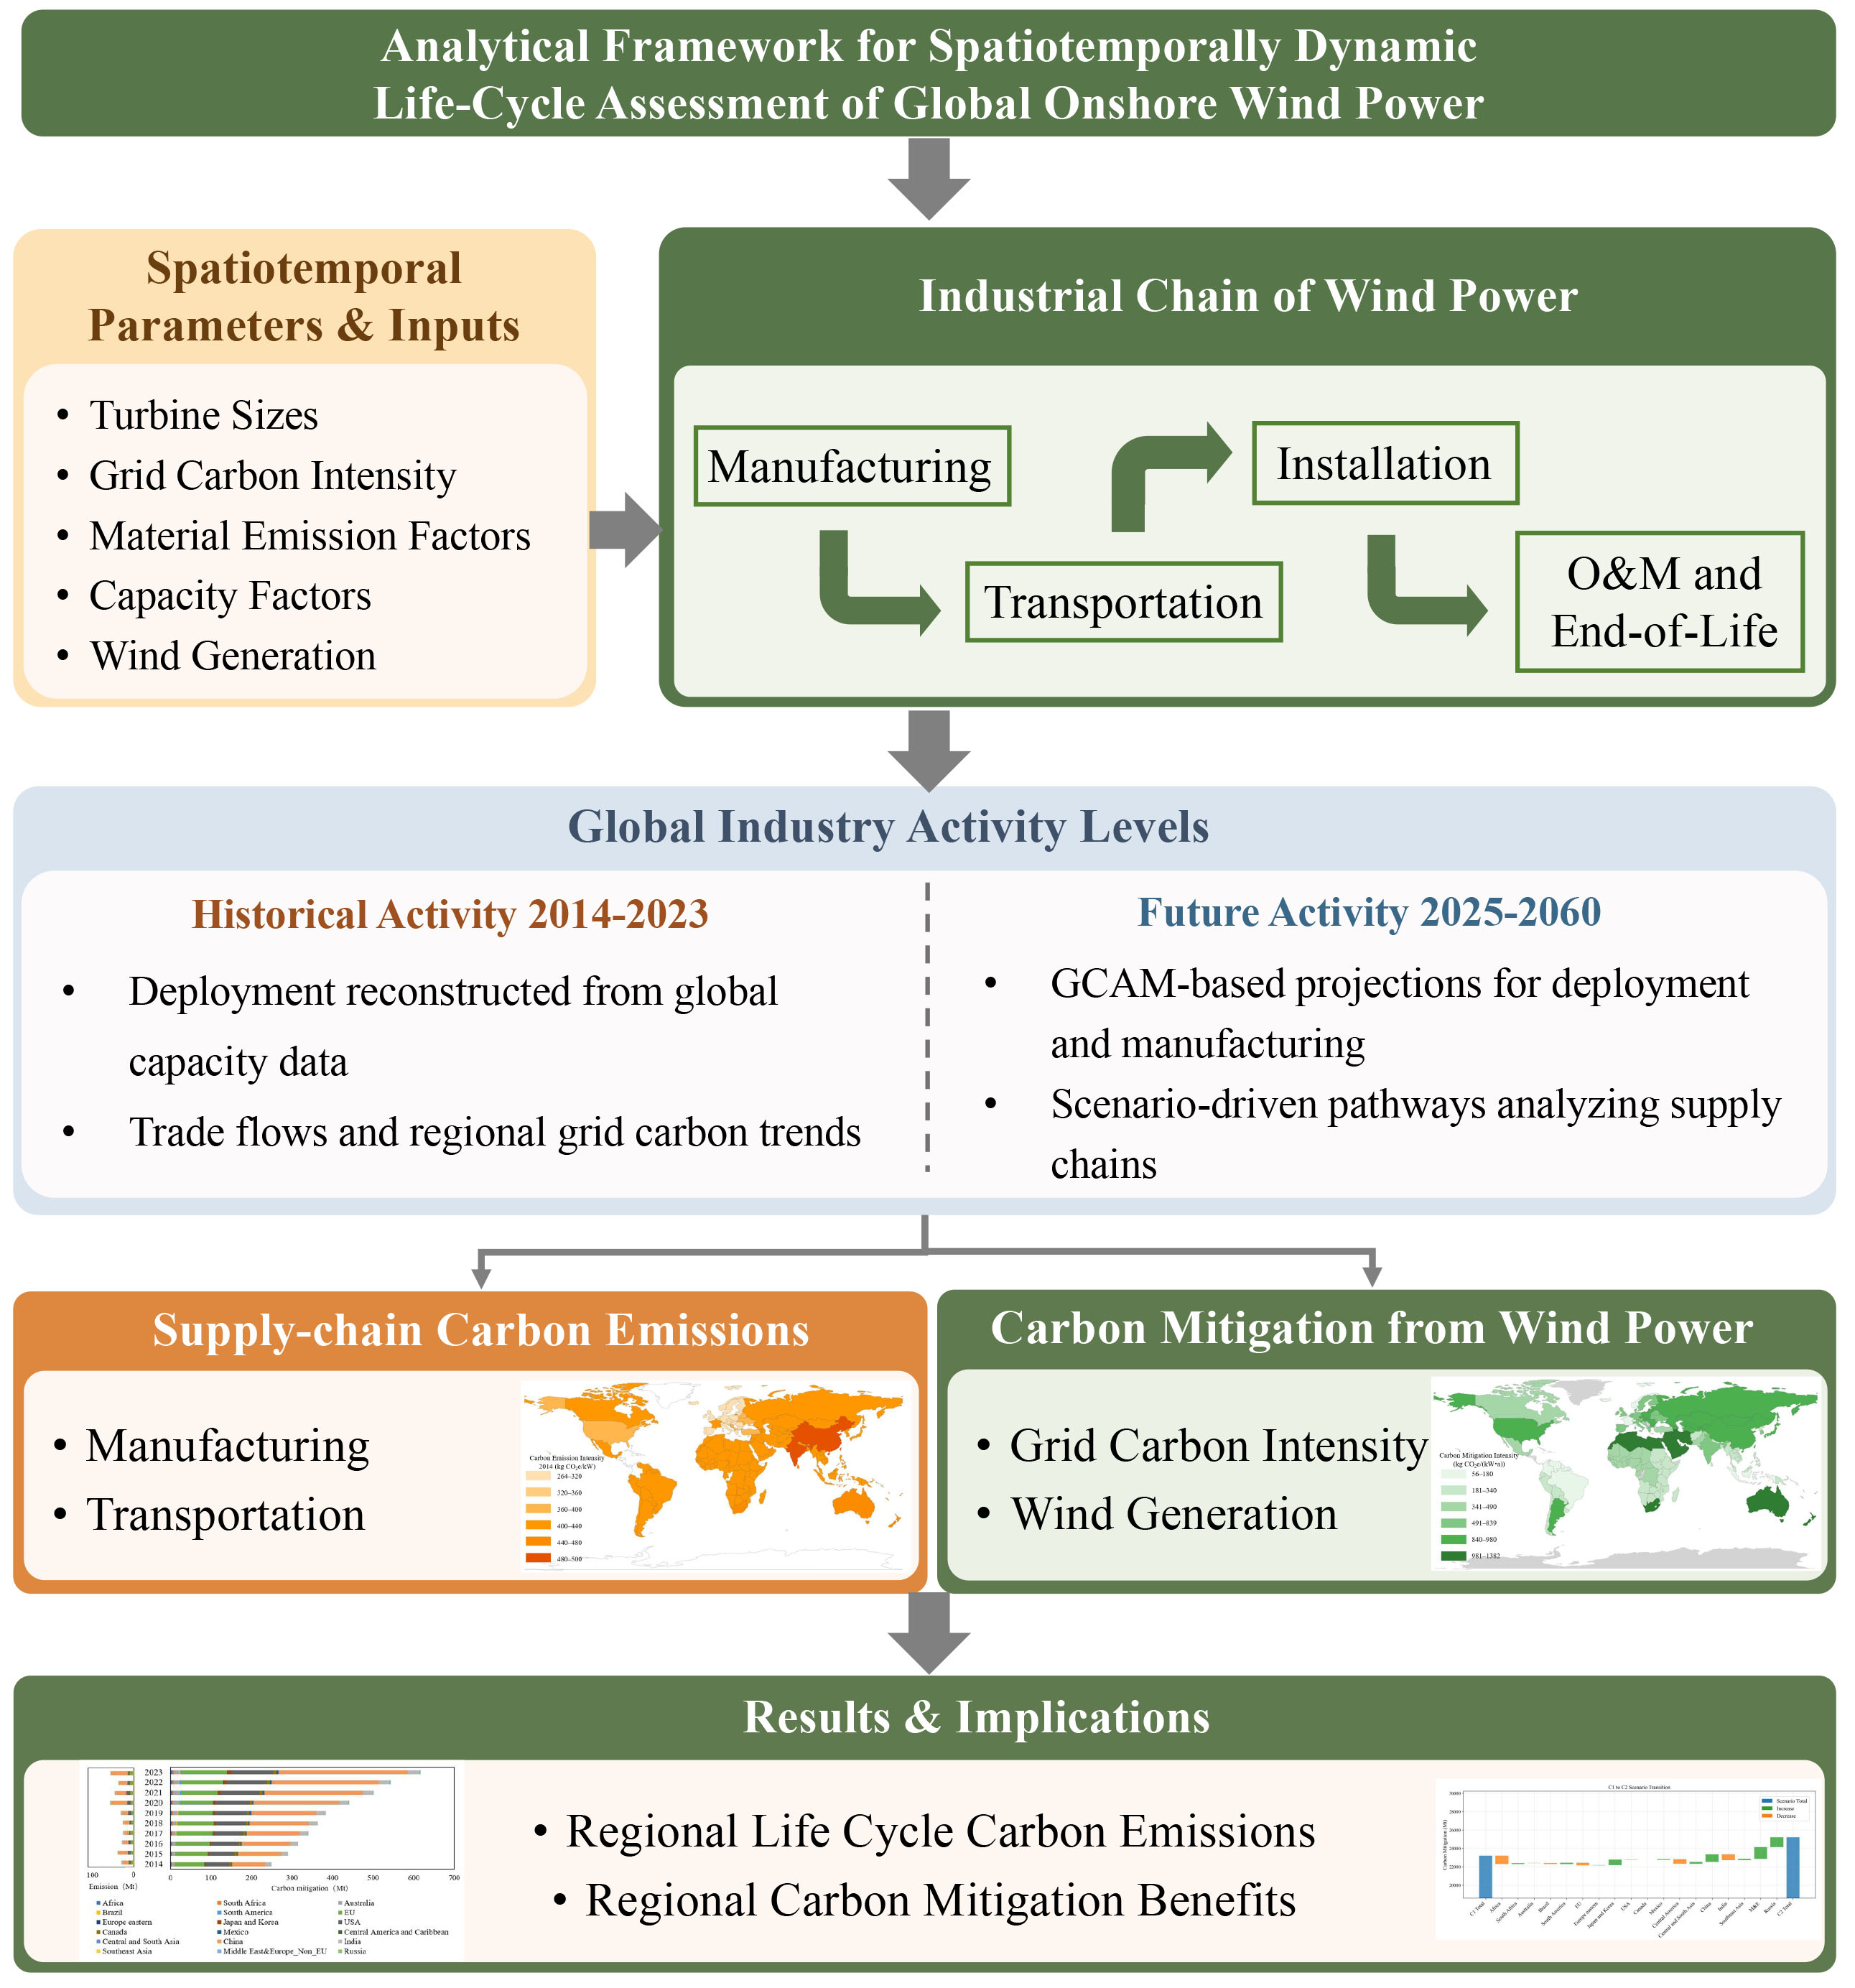
Figure 1. Technical roadmap of the spatiotemporally dynamic life cycle assessment framework for global onshore wind power. The country boundary data are obtained from the Folium example GeoJSON dataset (https://raw.githubusercontent.com/python-visualization/folium/master/examples/data/world-countries.json). GCAM: Global Change Analysis Model.
The Life Cycle Inventory (LCI) is compiled by drawing on data from relevant academic literature, LCA reports published by wind turbine manufacturers, and datasets provided by the Chinese Wind Energy Association and wind energy enterprises[5,37-40]. Multi-source data are integrated to calibrate the material composition of diverse turbine models. The manufacturing stage includes key material requirements for core components such as towers, nacelles, blades, generators, and gearboxes. These materials encompass steel, aluminum, copper, fiberglass, resin, concrete, and rare earth metals. For future turbine models, material demands are extrapolated to larger units (e.g., 8.5 MW) via power-based linear interpolation to reflect the trend of turbine upscaling. The construction and installation stage covers foundation works, fuel consumption of lifting equipment, and on-site energy consumption. The operation and maintenance stage focuses on lubricants, spare part replacements, and transportation-related energy consumption. The end-of-life stage involves the decommissioned capacity (Outflow), which is tracked in the material flow analysis. However, the greenhouse gas emissions associated with dismantling, transportation, and material recycling are excluded from the system boundary, given limited data availability and the absence of harmonized methods at the global scale. For the transportation stage, domestic transportation is assumed to cover a distance of 200 km and is modeled using road freight by trucks. All inventory parameters are quantified based on mass and energy consumption to ensure a consistent accounting framework across different regions.
Moreover, based on data availability and the Global Change Analysis Model (GCAM) regional classification, we cluster-weighted and averaged activity levels, dynamic emission factors, grid carbon intensities, and wind resource parameters across regions. This harmonization ensures consistent cross-regional comparison of the emission and mitigation estimates. The corresponding regions defined in the GCAM model are further aggregated in this study. The corresponding aggregated regions and their constituent GCAM regions are listed in Table 1[41].
Country groupings and the corresponding regions in GCAM[41]
| Study areas | Corresponding regions in GCAM |
| Africa | Africa Eastern, Africa Northern, Africa Southern, Africa Western |
| South America | Argentina, Colombia, South America Northern, South America Southern |
| EU | EU-15, EU-12, European Free Trade Association |
| Central and South Asia | Central Asia, Pakistan, South Asia |
| Southeast Asia | Indonesia, Southeast Asia |
| Middle East & Non-EU Europe | Europe_Non-EU, Middle East |
To reflect the spatiotemporal heterogeneity of carbon emission impacts, this study ensures that emission factors for materials in the LCI are spatiotemporally dynamic. Given the lack of high-precision spatiotemporal emission factors in existing LCA databases, the emission factors are processed and transformed. Region-specific emission factors are sourced from the GaBi Professional and Ecoinvent databases[42,43]. For regions without exact matches, “Rest of World” (RoW) data are applied. For temporal dynamics, grid emission factors are prioritized, given their high spatiotemporal resolution and ready availability. For key materials with high emission contributions (steel, iron, aluminum, resin, and concrete), we disaggregated their emission factors into electricity-related and non-electricity-related components, as shown in Equation (1) below:
where EFp,i,t denotes the emission factor of material p in region i during year t,
This study is based on historical country-level grid emission factor data provided by Our World in Data[44]. These data are clustered and averaged using national electricity generation as weights, yielding historical grid emission factors for the regionally aggregated classifications adopted in this study. We applied the percentage reduction in grid emission factors by 2050 from the EnerBlue scenario (reflecting Nationally Determined Contributions (NDCs) and announced pledges), as provided by Enerdata. By integrating actual historical grid emission factors and applying the same reduction rates, we projected future grid emission factors for the corresponding regions, thereby deriving the total grid emission factors across regions[45].
Activity level estimation for the wind power industry
This study employs the Material Flow Analysis (MFA) method to establish a unified model covering the newly installed capacity, in-service stock, and decommissioned volume of wind power systems[46]. Since future scenario projections for capacity growth, electricity demand, and generation are derived from the GCAM, the regional classification strictly follows its region system to ensure consistency between historical accounting and future scenario predictions. The in-service capacity Si,t satisfies the stock conservation relationship in Equation (2):
where Si,t denotes the in-service capacity in region i during year t; Ii,t denotes the newly installed capacity in region i during year t; Oi,t denotes the decommissioned capacity in region i during year t.
For the future period, we assume that wind turbine lifetime follows a Weibull distribution, which characterizes the retirement probability of turbines installed in a given year in the t-th year of operation. Based on this distribution, the decommissioned capacity is then calculated[35,47].
where the cumulative distribution function F(x) denotes the decommissioning probability at lifespan x years, with shape parameter k = 2 (dimensionless) and scale parameter λ = 20 years (mean lifespan).
Notably, the Weibull distribution models the temporal probability distribution of wind turbine retirement, instead of presuming a uniform fixed retirement age for all turbines. This approach enables the model to capture the variability inherent in turbine service lifetimes.
Due to the absence of systematic and harmonized global statistics on wind turbine production, this study reconstructs historical production activities across regions using a trade-flow-based inversion approach. By integrating import and export records of wind turbine nacelles, towers, generators, and other major components from national customs and regional trade databases, it establishes an interregional trade flow structure. This structure is then used to infer the spatial distribution of the global supply chains across different years[48-51]. The core principle is that the correspondence between a region’s newly installed wind capacity and its import sources can serve to estimate its production output. Conversely, for regions with domestic production and consumption, the self-supply quantity can be estimated from trade balance identities.
At the turbine level, regional turbine flows are represented in the form of a trade matrix. Based on the mass balance between each region’s new installations (imports plus domestic production) and its outward flows (exports plus domestic production), the implied domestic production volume is resolved. This enables estimation of regional production shares during the historical period. This approach circumvents the need for complete production datasets, offering an analytical basis for reconstructing the global spatial pattern of production when statistical data are incomplete.
To further improve the spatial accuracy of carbon emission attribution for the manufacturing stage, a net-export adjustment is applied to key components such as towers and generators. For each component category, the regional net exports (exports minus imports) are utilized to reallocate production-related carbon emissions across regions. Regions with sustained net exports of a specific component assume a larger share of component-related carbon emissions, whereas net-importing regions receive correspondingly lower allocations. The reallocation process is conducted using component-specific unit emission factors, thereby aligning regional carbon emissions with the actual upstream structure of the supply chains. The final adjusted carbon emissions attributed to regional wind turbine production are expressed as Equation (5):
where
This correction enhances the representativeness of regional production emissions, as it accounts for the impact of concentrated component production and large-scale component trade on the spatial distribution of upstream carbon emissions in the global wind power supply chains.
Future scenario settings
This study adopts the SSP1-2.6 scenario provided by the GCAM model to obtain projections of total electricity demand and wind power generation across global regions over the period 1995-2060. This scenario is consistent with the global target of achieving net-zero greenhouse gas emissions by 2050, offering a unified macro-level scenario framework for defining future wind power deployment scenarios. Based on these projections, regional capacity factors - estimated based on local wind resource endowments - are applied to back-calculate the operating wind power capacity (stock) and annual newly installed capacity (inflow). These variables serve as the core activity inputs for future wind power deployment in the life cycle assessment framework.
To verify the global-scale plausibility of the scenario settings adopted in this study, the projected wind power installation scale is compared with key milestone projections from major international institutions under net-zero-oriented scenarios[52,53], as summarized in Table 2. The comparison indicates that both the magnitude and growth trajectory of global wind power capacity under the scenario adopted in this study are broadly consistent with those reported in mainstream international net-zero scenarios. This consistency demonstrates that the assumed wind power deployment scale is reasonable and comparable, thereby providing a robust foundation for subsequent scenario analysis.
| Year | Projections in this study (GW) | IEA NZE Scenario (GW) | IRENA TES Scenario (GW) |
| 2030 | 2847 | 3101 | 2692 |
| 2040 | 5986 | 6526 | 4368 |
| 2050 | 8618 | 8265 | 6044 |
This study constructs three deployment scenarios and three production scenarios to evaluate carbon emissions and carbon mitigation under alternative “production-deployment” scenarios [Table 3]. Among the deployment scenarios, C1 represents the baseline deployment scenario and is constructed based on the regional allocation provided by the GCAM model. This scenario implies a continuation of historical electricity mix inertia, under which developed economies - with historically high penetration levels - continue to dominate new wind power installations. Accordingly, the newly installed capacity in each region directly adopts the inflow values derived from the GCAM model. C2 represents a balanced deployment scenario, where annual installations are allocated across regions in proportion to their shares of global electricity demand. It represents a more balanced and equity-oriented deployment scenario that decouples future capacity expansion from historical installation patterns. C3 represents a climate-priority deployment scenario, which preferentially allocates new wind capacity to regions with carbon-intensive power systems, particularly those characterized by high grid emission factors. Unlike C1, which serves as a baseline, C2 and C3 are counterfactual scenarios representing different deployment principles. They are designed to explore the theoretical carbon mitigation potential of alternative regional allocation schemes, rather than to serve as realistic transition pathways.
Scenarios of global new production and new installation of wind power
| Deployment | C1 | C2 | C3 |
| Scenario types | Baseline deployment | Balanced deployment | Climate-priority deployment |
| Description | Deployment follows GCAM-projected regional allocation patterns, reflecting historical installation inertia | Installations allocated in proportion to regional electricity demand shares | New wind capacity is preferentially allocated to regions with carbon-intensive power systems and high grid emission factors |
| Production | M1 | M2 | M3 |
| Scenario types | Baseline production | Spatially diversified production | Clean-oriented production |
| Description | Production follows historical regional shares, reflecting existing industrial and supply-chain inertia | Production expands into Southeast Asia and Africa, forming a geographically diversified supply-chain structure | Production is concentrated in low-carbon electricity regions, primarily Europe and North America |
The grid emission factor of region i in year t is expressed as Equation (6):
In the baseline scenario, the projected temporal evolution of the total grid emission factor
In addition, two feasibility constraints are introduced into the dynamic allocation process to ensure that the constructed deployment scenarios remain consistent with realistic power system conditions. (1) To maintain the stability of regional power systems, the share of wind power generation is capped at 70% of total electricity generation[54,55]. Regional electricity demand and total generation are sourced from GCAM projections. (2) The annual wind power generation associated with each region’s installed capacity cannot exceed its maximum technically available wind resource potential, thereby preventing deployment beyond the physical limits of wind resource. Based on these constraints, this study derives the annual cumulative wind power operating capacity across regions from 2025 to 2060 for each of the three deployment scenarios [Figure 2].
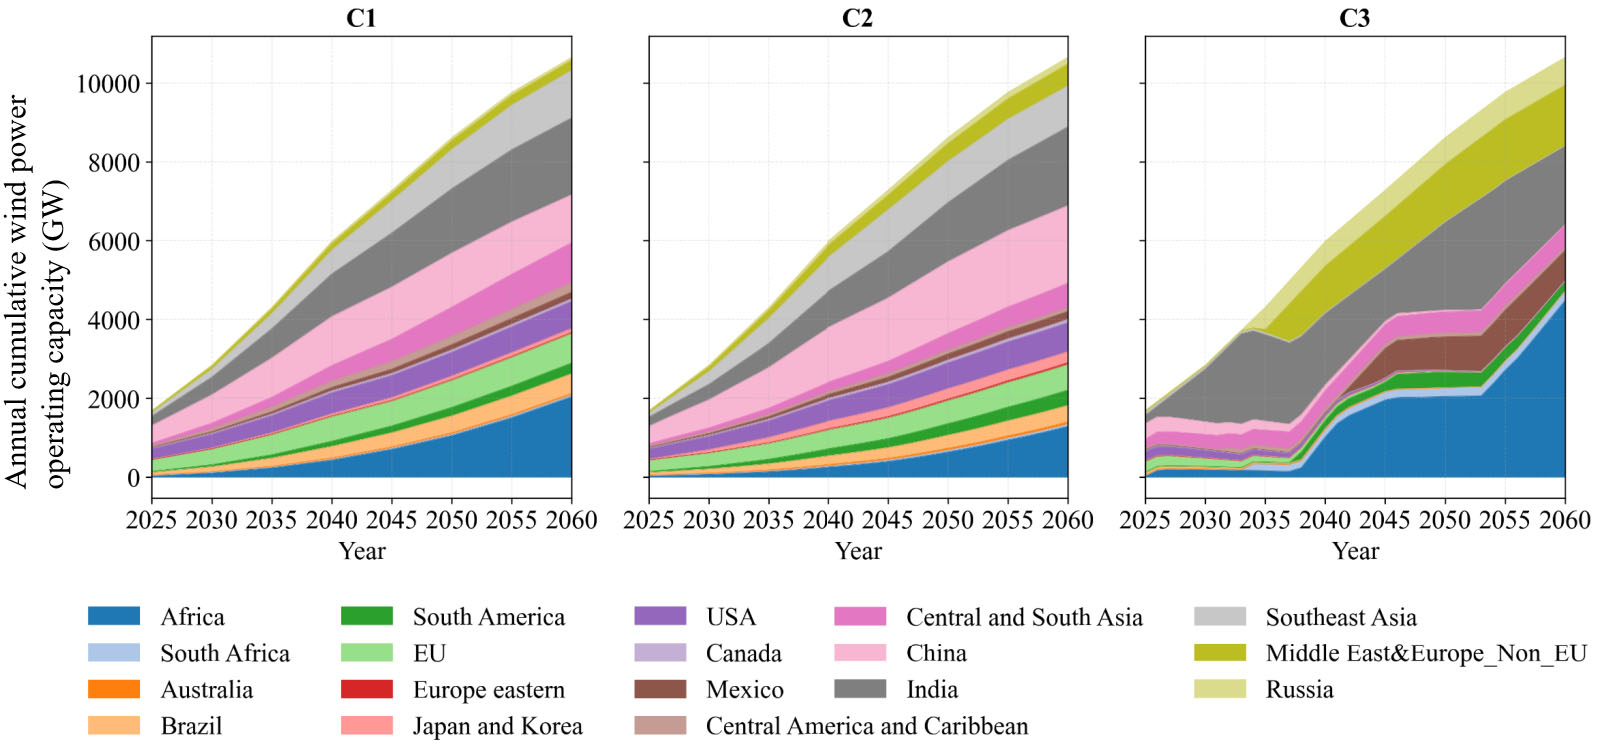
Figure 2. Annual cumulative wind power operating capacity in various regions from 2025 to 2060. In C1 (baseline deployment scenario), installations follow GCAM-projected regional allocation patterns, reflecting historical installation inertia. In C2 (balanced deployment scenario), installations are allocated in proportion to regional electricity demand shares. In C3 (climate-priority deployment scenario), deployment is prioritized in carbon-intensive power systems. GCAM: Global Change Analysis Model.
For production scenarios, M1 represents the baseline production scenario, which retains the current global manufacturing structure. It assumes that each region’s production share remains consistent with recent historical patterns, reflecting a continuation of existing industrial distribution and supply-chain inertia. M2 represents a spatially diversified production scenario, in which manufacturing activities expand beyond the existing five major production hubs through increased production shares in Southeast Asia and Africa. This forms a more geographically distributed and resilient global supply chain structure. M3 represents a clean-oriented production scenario with stronger regional concentration. It is designed to explore the potential emission-reduction effect of relocating production to regions with lower manufacturing emission intensities. Under this scenario, approximately 90% of global wind turbine production is allocated to Europe and North America, forming a highly concentrated “clean production” structure aimed at minimizing life cycle manufacturing-related carbon emissions. M2 and M3 are counterfactual scenarios designed to explore the theoretical carbon emission potential of alternative production allocation schemes. For both scenarios, the target production structures are assumed to be realized by 2035, and the dynamic transition from the historically derived 2025 production structure to the 2035 configuration is modeled using linear interpolation. This study derives the annual wind turbine production capacity across regions from 2025 to 2060 for the three production scenarios [Figure 3].
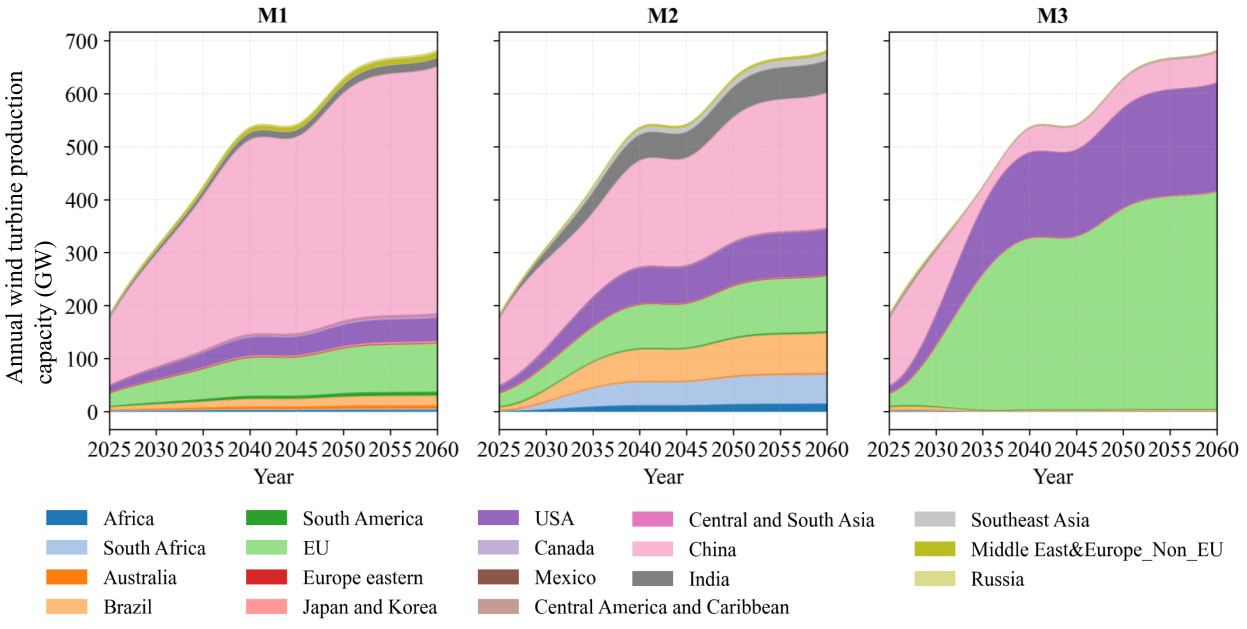
Figure 3. Annual wind turbine production capacity across regions from 2025-2060. In M1 (baseline production scenario), production follows historical regional shares, reflecting existing industrial and supply-chain inertia. In M2 (spatially diversified production scenario), production expands into Southeast Asia and Africa, forming a geographically diversified supply-chain structure. In M3 (clean-oriented production scenario), production is concentrated in low-carbon electricity regions, primarily Europe and North America, to minimize manufacturing-related life cycle carbon emissions.
The transportation stage includes three types of logistics routes: maritime shipping, cross-border land transportation, and intra-regional transportation. For intra-regional transportation, we assume an average distance of 200 km from production plants to installation sites and apply standard road-transportation emission factors. Cross-border transportation is modeled using a combination of maritime and land routes. Maritime distances are calculated between major representative ports of each region using the shortest available shipping routes, while land distances represent the connection from the regional port to the representative installation hub[56]. Emission factors for both maritime and land transportation are sourced from established life cycle databases.
Based on these inputs, we developed an optimization model to determine transportation routes under each combination of production and deployment scenarios. The model assigns annual flows from production regions to installation regions by minimizing transportation distance, thereby ensuring consistent and comparable spatial attribution of transportation carbon emissions. Finally, we calculated transportation emissions for all nine “deployment-production” scenario combinations by integrating the optimized transportation routes with transportation mode-specific emission factors.
Calculation of carbon emissions and net carbon mitigation benefits
Life cycle carbon emissions for each region i in year t are calculated in a matrix framework to capture the temporal and spatial heterogeneity of the global wind power system. The manufacturing-stage emission matrix is expressed as Equation (7):
where Ap,i,t denotes the activity level matrix of material p in region i and year t, and EFp,i,t denotes the corresponding dynamic emission factor for material p. Construction, operation, maintenance, and decommissioning emissions are formulated in an analogous manner.
Transportation carbon emissions are calculated as Equation (8):
where Di,j,t represents the optimized transportation distance from production region i to installation region j in year t, and EFtrans is the transportation mode emission factor.
The total life cycle carbon emissions of the wind power system in region i and year t are the sum of all stages as given in
Where
Carbon mitigation during the operation stage is estimated as the product of wind power generation and the regional grid emission factors. We assume that grid emission factors are not internally updated with manufacturing relocation and that wind power is fully grid-integrated. The estimated results thus represent the theoretical mitigation potentials. Historical wind generation is obtained from empirical datasets, whereas future generation is derived from projected operating capacity multiplied by region-specific capacity factors. For future wind installations in the period 2025-2060, annual carbon mitigation is calculated as the product of wind power generation from newly installed capacity and the non-renewable grid emission factor of each region. The direct carbon mitigation benefits are outlined in Equation (10):
where Mt denotes the total mitigation in year t,
Moreover, we conducted an uncertainty analysis that explicitly accounts for grid emission factors ( ± 10% baseline), scenario-specific coefficients (reflecting increasing uncertainty in counterfactual scenarios), a temporal factor (capturing growing uncertainty in long-term projections), and a regional data-quality factor. This framework is applied to both carbon emissions and net carbon mitigation benefits, with cumulative uncertainty derived by aggregating annual uncertainties through standard error propagation, where the total variance equals the sum of the annual variances. All reported uncertainties are reported as mean ± 1 standard deviation (σ).
Key assumptions and rationale
The key assumptions adopted in the modeling framework of this study are categorized and summarized in Table 4. The table encompasses technical parameters, supply chain parameters, system boundary, model settings, and scenario settings, accompanied by corresponding descriptions for each assumption.
Key assumptions and rationale in this study
| Category | Assumption | Description |
| Technical parameters | Turbine lifetime distribution | Weibull-distributed turbine lifetime, with annual retirement probability by year t[35,47] |
| Technical parameters | Material inventory extrapolation for larger turbines | Material intensity extrapolated via turbine size or capacity scaling, with linear interpolation to larger units (e.g., 8.5 MW)[56] |
| Supply chain parameters | Trade-flow reconstruction | Trade flows reflect supply chain distribution; imports proxy production, and trade balances indicate self-sufficiency[48-50] |
| Supply chain parameters | Transportation routes | Estimation based on major trade routes and shipping distances[56] |
| System boundary | Recycling credits | Decommissioned capacity (Outflow) is estimated based on the Weibull distribution[47], but recycling credits are not included |
| Model settings | Grid emission factor projections | Grid emission factors are assumed exogenous and invariant to manufacturing relocation or capacity changes in the model, although they are dynamic in reality[57] |
| Scenario settings | Wind power grid integration | A full-absorption assumption is adopted to estimate the theoretical mitigation potentials, while curtailment is recognized as a practical constraint[58,59] |
| Scenario settings | Scenario feasibility constraints | All input parameters except the allocation rules are identical across the deployment scenarios, including the 70% penetration cap and the wind resource potential limit[54,55] |
RESULTS
Spatial-temporal evolution of the impacts and benefits of the global wind power industry in the historical period
During 2014-2023, wind power systems generated cumulative global net carbon mitigation benefits of 3,690 Mt CO2e, accounting for approximately 1.01% of total global carbon emissions over the same period [Figure 4]. Specifically, the cumulative direct carbon mitigation benefits amounted to 4,035 Mt CO2e, while the life cycle carbon emissions associated with the wind power industry totaled 345 Mt CO2e. Thus, total life cycle carbon emissions were equivalent to merely 8.55% of the direct carbon mitigation benefits. This indicates that although the wind power supply chains generate a certain amount of greenhouse gas emissions, these emissions are far smaller than the mitigation benefits achieved during the operational phase. These benefits stem from the substitution of fossil-fuel-based electricity generation. Overall, wind power offers substantial carbon mitigation benefits. Its associated emissions are negligible when compared with conventional generation technologies such as coal- and gas-fired power. Over the past decade, the equipment production stage dominated life cycle carbon emissions, contributing nearly 270 Mt CO2e and accounting for 78% of total emissions. The construction stage followed, accounting for 18%. In contrast, operation and maintenance as well as transportation contributed only about 2% and 1%, respectively, indicating relatively limited contributions [Figure 4C].
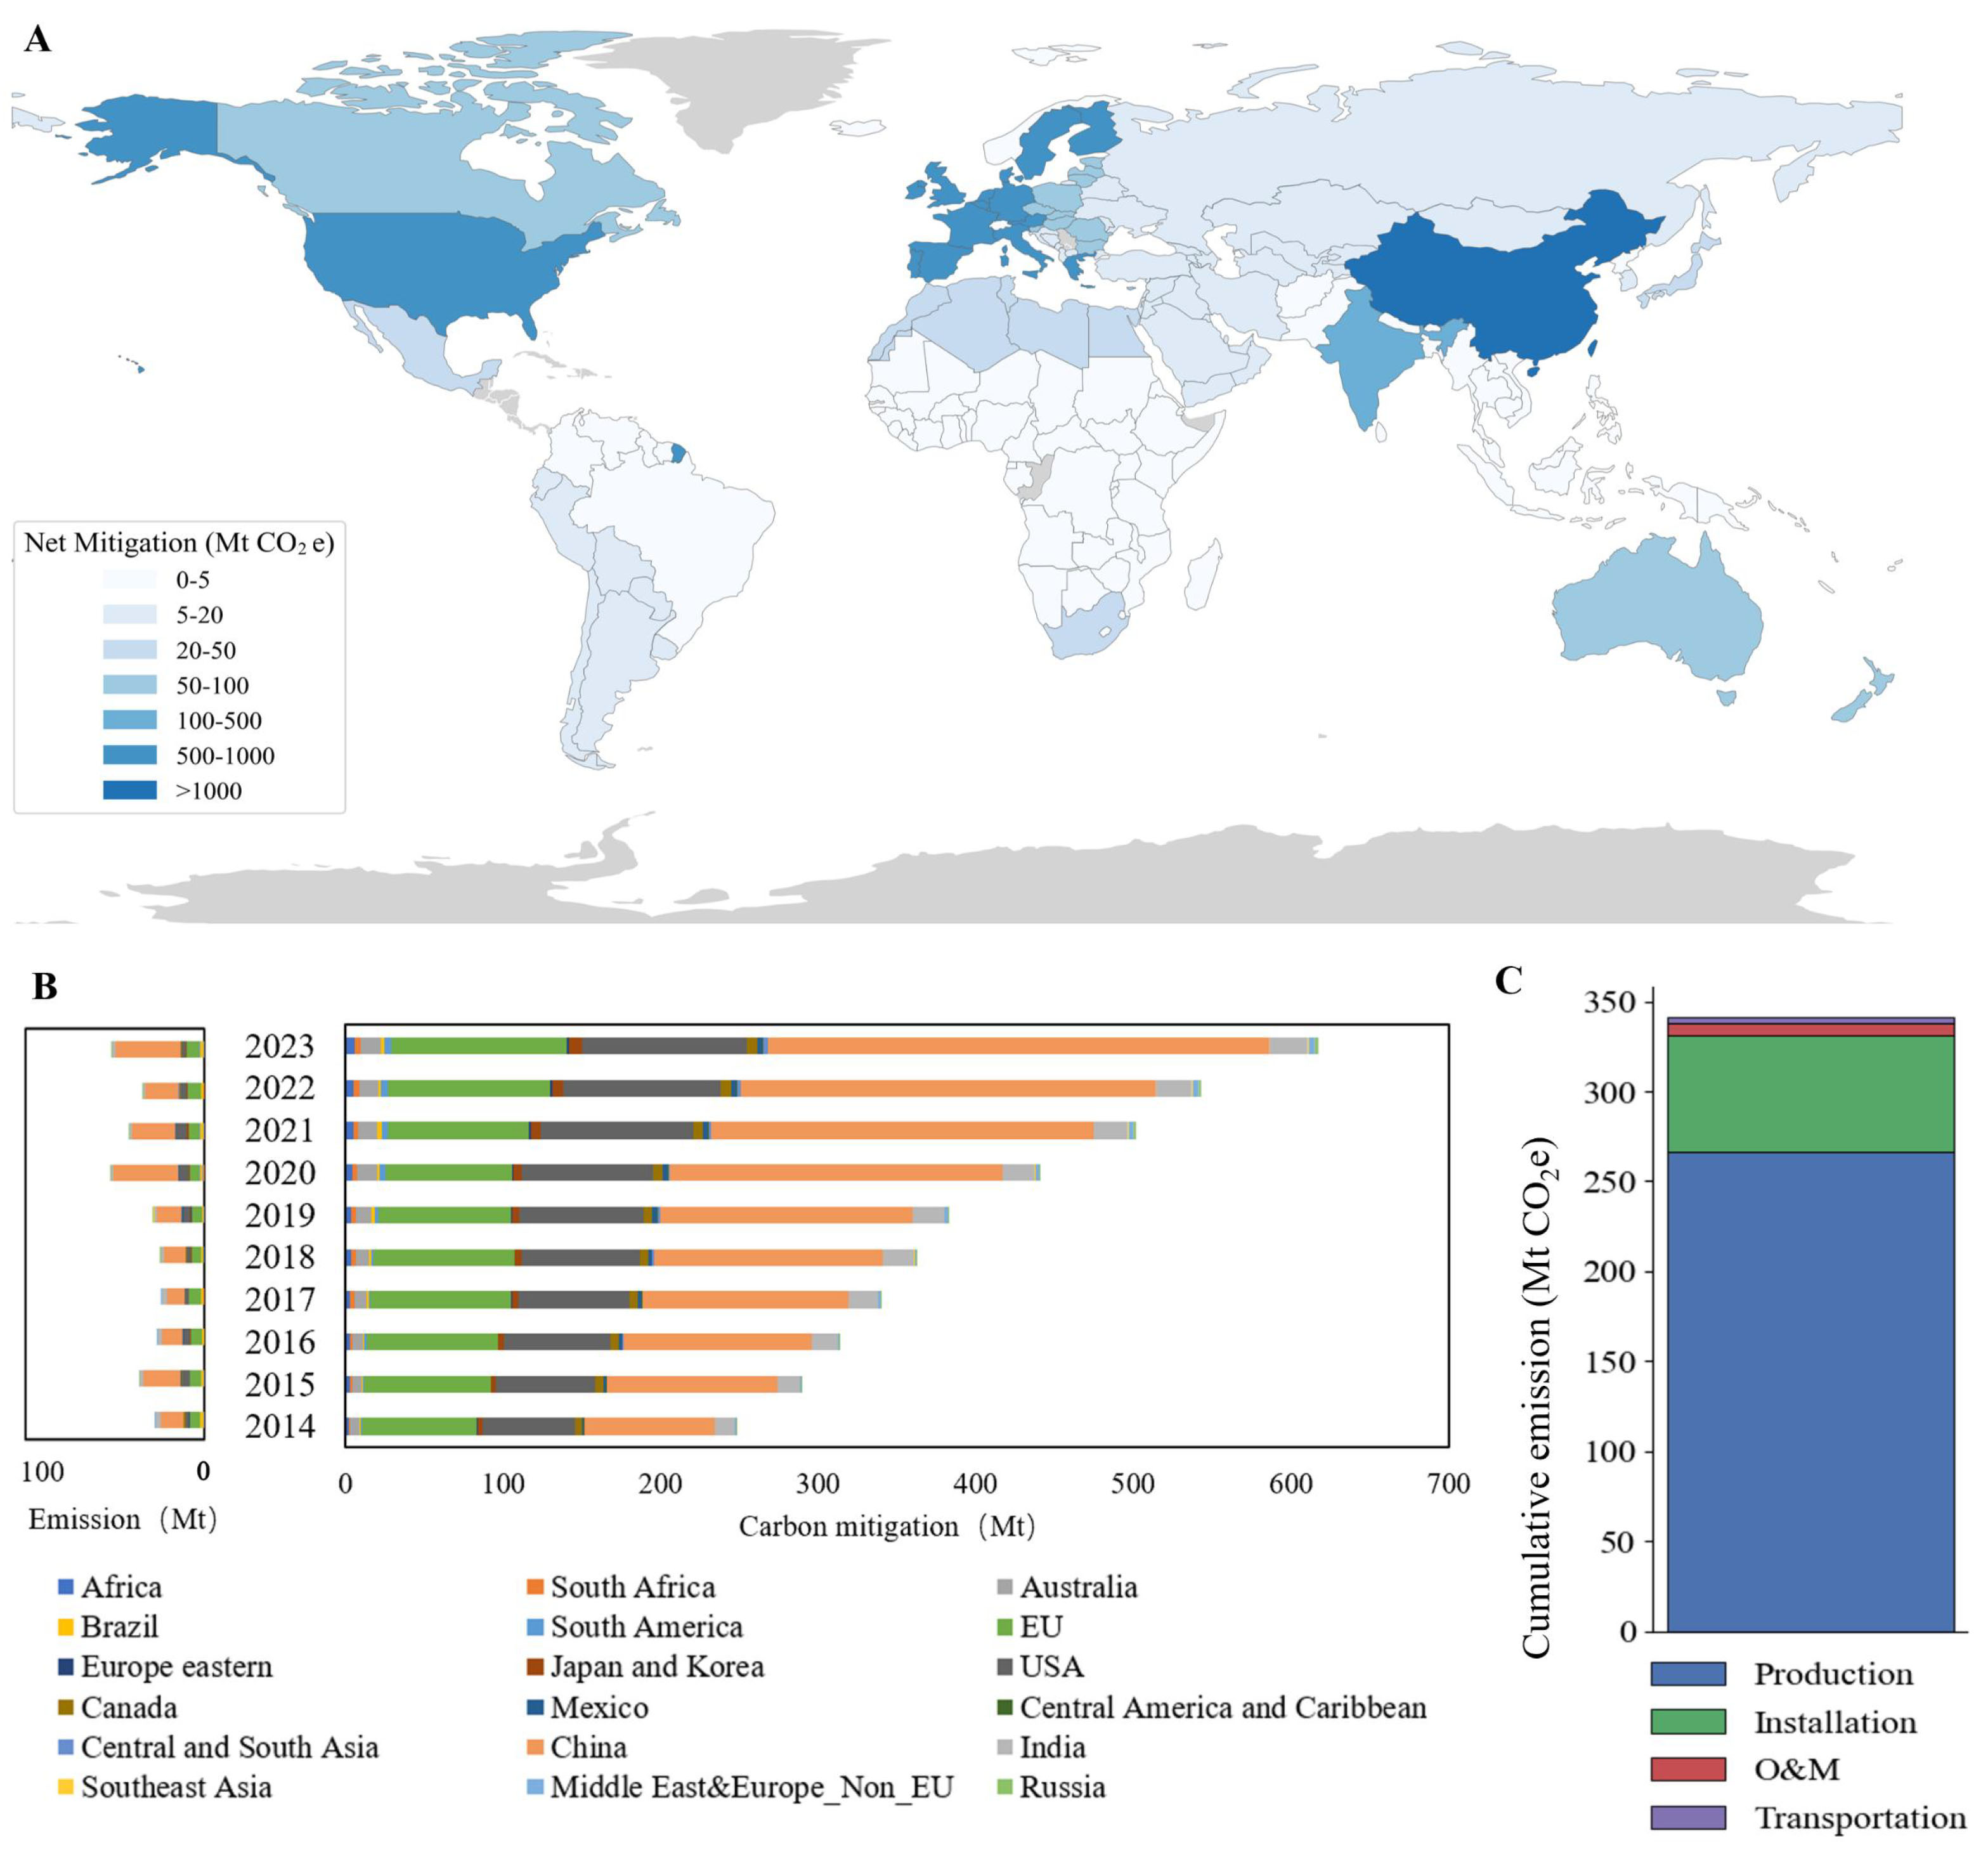
Figure 4. Global distribution of wind power carbon emissions and mitigation benefits during 2014-2023. (A) Global net carbon mitigation benefits across regions, with gray regions indicating the absence of data; (B) Regional comparison of net carbon mitigation benefits and life cycle carbon emissions from 2014 to 2023; (C) Carbon emissions by stage in the life cycle of the wind system. The country boundary data are obtained from the Folium example GeoJSON dataset (https://raw.githubusercontent.com/python-visualization/folium/master/examples/data/world-countries.json).
Over the ten-year period, global net carbon mitigation benefits remained positive, showing a steady upward trajectory. Despite regional fluctuations in net mitigation levels, an overall upward trend was evident. Global direct carbon mitigation benefits increased from 220.78 Mt CO2e in 2014 to 565.76 Mt CO2e in 2023, a 2.56-fold rise that represents an 11.0% compound annual growth rate. During the same period, direct carbon mitigation benefits increased from 247 Mt CO2e to 617 Mt CO2e, a 2.50-fold increase that outpaced the 1.96-fold rise in carbon emissions, which grew from 26 Mt CO2e in 2014 to 51 Mt CO2e in 2023. This pattern reflects the rapid expansion of wind power capacity in recent years. As the cumulative stock of operating turbines increased, the growth rate of carbon mitigation outpaced that of emissions generated during turbine production, thereby further amplifying net mitigation effects. Taking China as an example, which has extensive wind power installed capacity and exhibits the most pronounced growth rate, carbon emissions from wind power activities increased by 2.91 times between 2014 and 2023. In comparison, net carbon mitigation benefits increased by 4.02 times. This robust growth propelled China’s share of global net carbon mitigation benefits from 31.9% in 2014 to 50.0% in 2023. Conversely, other countries and regions exhibited more modest growth in scale and installation rates, resulting in either fluctuating or declining shares of global net mitigation. For example, the European Union’s share dropped from 30.5% to 18.4%, and the United States’ share fell from 25.63% to 18.01%.
Among all regions globally, China, the European Union, and the United States emerged as the dominant contributors. Their cumulative net carbon mitigation benefits totaled 1,587 Mt CO2e, 822 Mt CO2e, and 764 Mt CO2e, respectively, accounting for 43.0%, 22.3%, and 20.7% of the global total. Collectively, these three regions contributed 86% of global net mitigation. Their high mitigation levels are closely proportional to their substantial cumulative installed capacities. Wind power development in these regions started earlier and reached more advanced stages. Over the decade, their cumulative installed capacities accounted for 43%, 26%, and 15% of global installed capacities, respectively, amounting to a combined share of 84.0%. Moreover, turbine production for these installations was predominantly undertaken domestically. This made these regions both major production hubs and the primary sources of carbon emissions within the wind power supply chains. During the ten-year period, their turbine production output accounted for 53.2%, 21.4%, and 11.1% of the global total, respectively, with a combined share of 85.7%. As a result, cumulative carbon emissions associated with wind power supply chain activities in these regions accounted for 83.8% of global life cycle carbon emissions. Among the remaining regions, India accounted for 4.72% of global carbon emissions, followed by Australia with 2.49% and Canada with 1.17%. In contrast, regions such as Brazil, Southeast Asia, Central America, Russia, and Eastern Europe exhibited the lowest net mitigation contributions, accounting for less than 1% of the global total. For Southeast Asia, Central America, Russia, and Eastern Europe, their low net mitigation contributions were primarily due to their limited installed capacities. By 2023, these regions accounted for merely 0.88% of global cumulative installed capacities. Brazil’s cumulative installed capacity accounted for 2.87% of the global total, far exceeding its net mitigation share of 0.06%. This extremely low net mitigation benefit stems primarily from the country’s relatively clean power mix. Consequently, wind power yields lower marginal mitigation benefits here than in other regions.
From a refined temporal and regional perspective, the net carbon mitigation benefits in most countries and regions remained positive across all years. Only in the early years did a few countries or regions record negative values. This indicates that, during those periods, the life cycle carbon emissions associated with the local wind power industry exceeded the mitigation benefits from wind turbine operation. Regions such as Brazil, the European Free Trade Association, Indonesia, and parts of southern South America fell into this category. The primary driver of these negative values was that a large proportion of turbines produced in the early period were exported, and their marginal carbon mitigation benefits were not significant. The previously discussed expansion of mitigation effects driven by increased installed capacity has improved the situation in these regions that initially had negative net carbon mitigation benefits. By 2022, all regions worldwide achieved positive annual net carbon mitigation. For instance, Brazil experienced negative net carbon mitigation between 2014 and 2016, with the magnitude gradually decreasing from 0.89 Mt CO2e to 0.28 Mt CO2e. It subsequently turned positive, reaching cumulative net carbon mitigation benefits of 2.23 Mt CO2e by 2023. Moreover, southern South America exhibited the net carbon mitigation benefits of -0.02 Mt CO2e in 2014. In the following years, the values remained positive and showed an overall increasing trend, reaching 1.39 Mt CO2e in 2023.
Spatio-temporal variation of carbon mitigation and carbon emission intensity
The carbon emissions stemming from wind power systems, along with their carbon mitigation benefits, are not solely determined by installed capacity. Instead, they are shaped by multiple spatiotemporal factors[5,60]. To capture the impact of these factors on wind power performance across different regions, this study constructs two metrics: carbon mitigation intensity and carbon emission intensity. Carbon mitigation intensity is defined as the amount of carbon mitigation achieved per unit of installed capacity within one year. It is expressed in kg CO2e/(kW·a) and quantifies the actual mitigation effectiveness of wind power in substituting conventional fossil energy, especially coal-fired power. The spatiotemporal variations of this intensity are mainly determined by regional wind resource endowment and the carbon emission factors of the local grid. As grids gradually decarbonize (e.g., a declining share of coal power and an increased share of other renewables), the carbon mitigation intensity of wind power within the same region dynamically changes. Therefore, its calculation must account for the characteristics of the grid in each year.
In contrast, carbon emission intensity focuses on greenhouse gas emissions along the wind power supply chains. It denotes the cumulative carbon emissions per unit of installed wind capacity (kg CO2e/kW) across the full life cycle, including turbine production, component transportation, on-site operation and maintenance, and decommissioning. Its magnitude is primarily shaped by production technologies, the electricity mix, and regional industrial features.
Carbon mitigation intensity is primarily determined by regional wind resource endowment and grid cleanliness. Spatially, over the past decade, the highest carbon mitigation intensity was observed in northern Africa in 2014, reaching 1,381.35 kg CO2e/(kW·a) [Figure 5A]. This is mainly attributed to its abundant wind resources, vast deserts, and open terrain, which deliver stable and strong wind speeds conducive to large-scale wind power development. Additionally, coal power constituted a high share of the electricity mix in this region, and its emission factor was significant. Substituting wind for coal power avoided substantial carbon emissions, thereby greatly enhancing carbon mitigation intensity. Beyond northern Africa, regions such as Australia, South Africa, and the Middle East also exhibited relatively high overall carbon mitigation intensity. In contrast, the European Free Trade Association had relatively low carbon mitigation intensity, with a global minimum of 50.40 kg CO2e/(kW·a) in 2021. This is because the region’s grid is highly decarbonized, so the carbon reductions from wind substituting coal are relatively limited. Moreover, the average regional wind speed that year might have been suboptimal, resulting in lower overall turbine output and, in turn, reduced carbon mitigation intensity. Similarly, South American countries like Brazil and Colombia had grids dominated by hydropower, leading to high grid cleanliness and relatively low carbon mitigation intensity, with mean values of 105.25 and 90.75 kg CO2e/(kW·a), respectively.
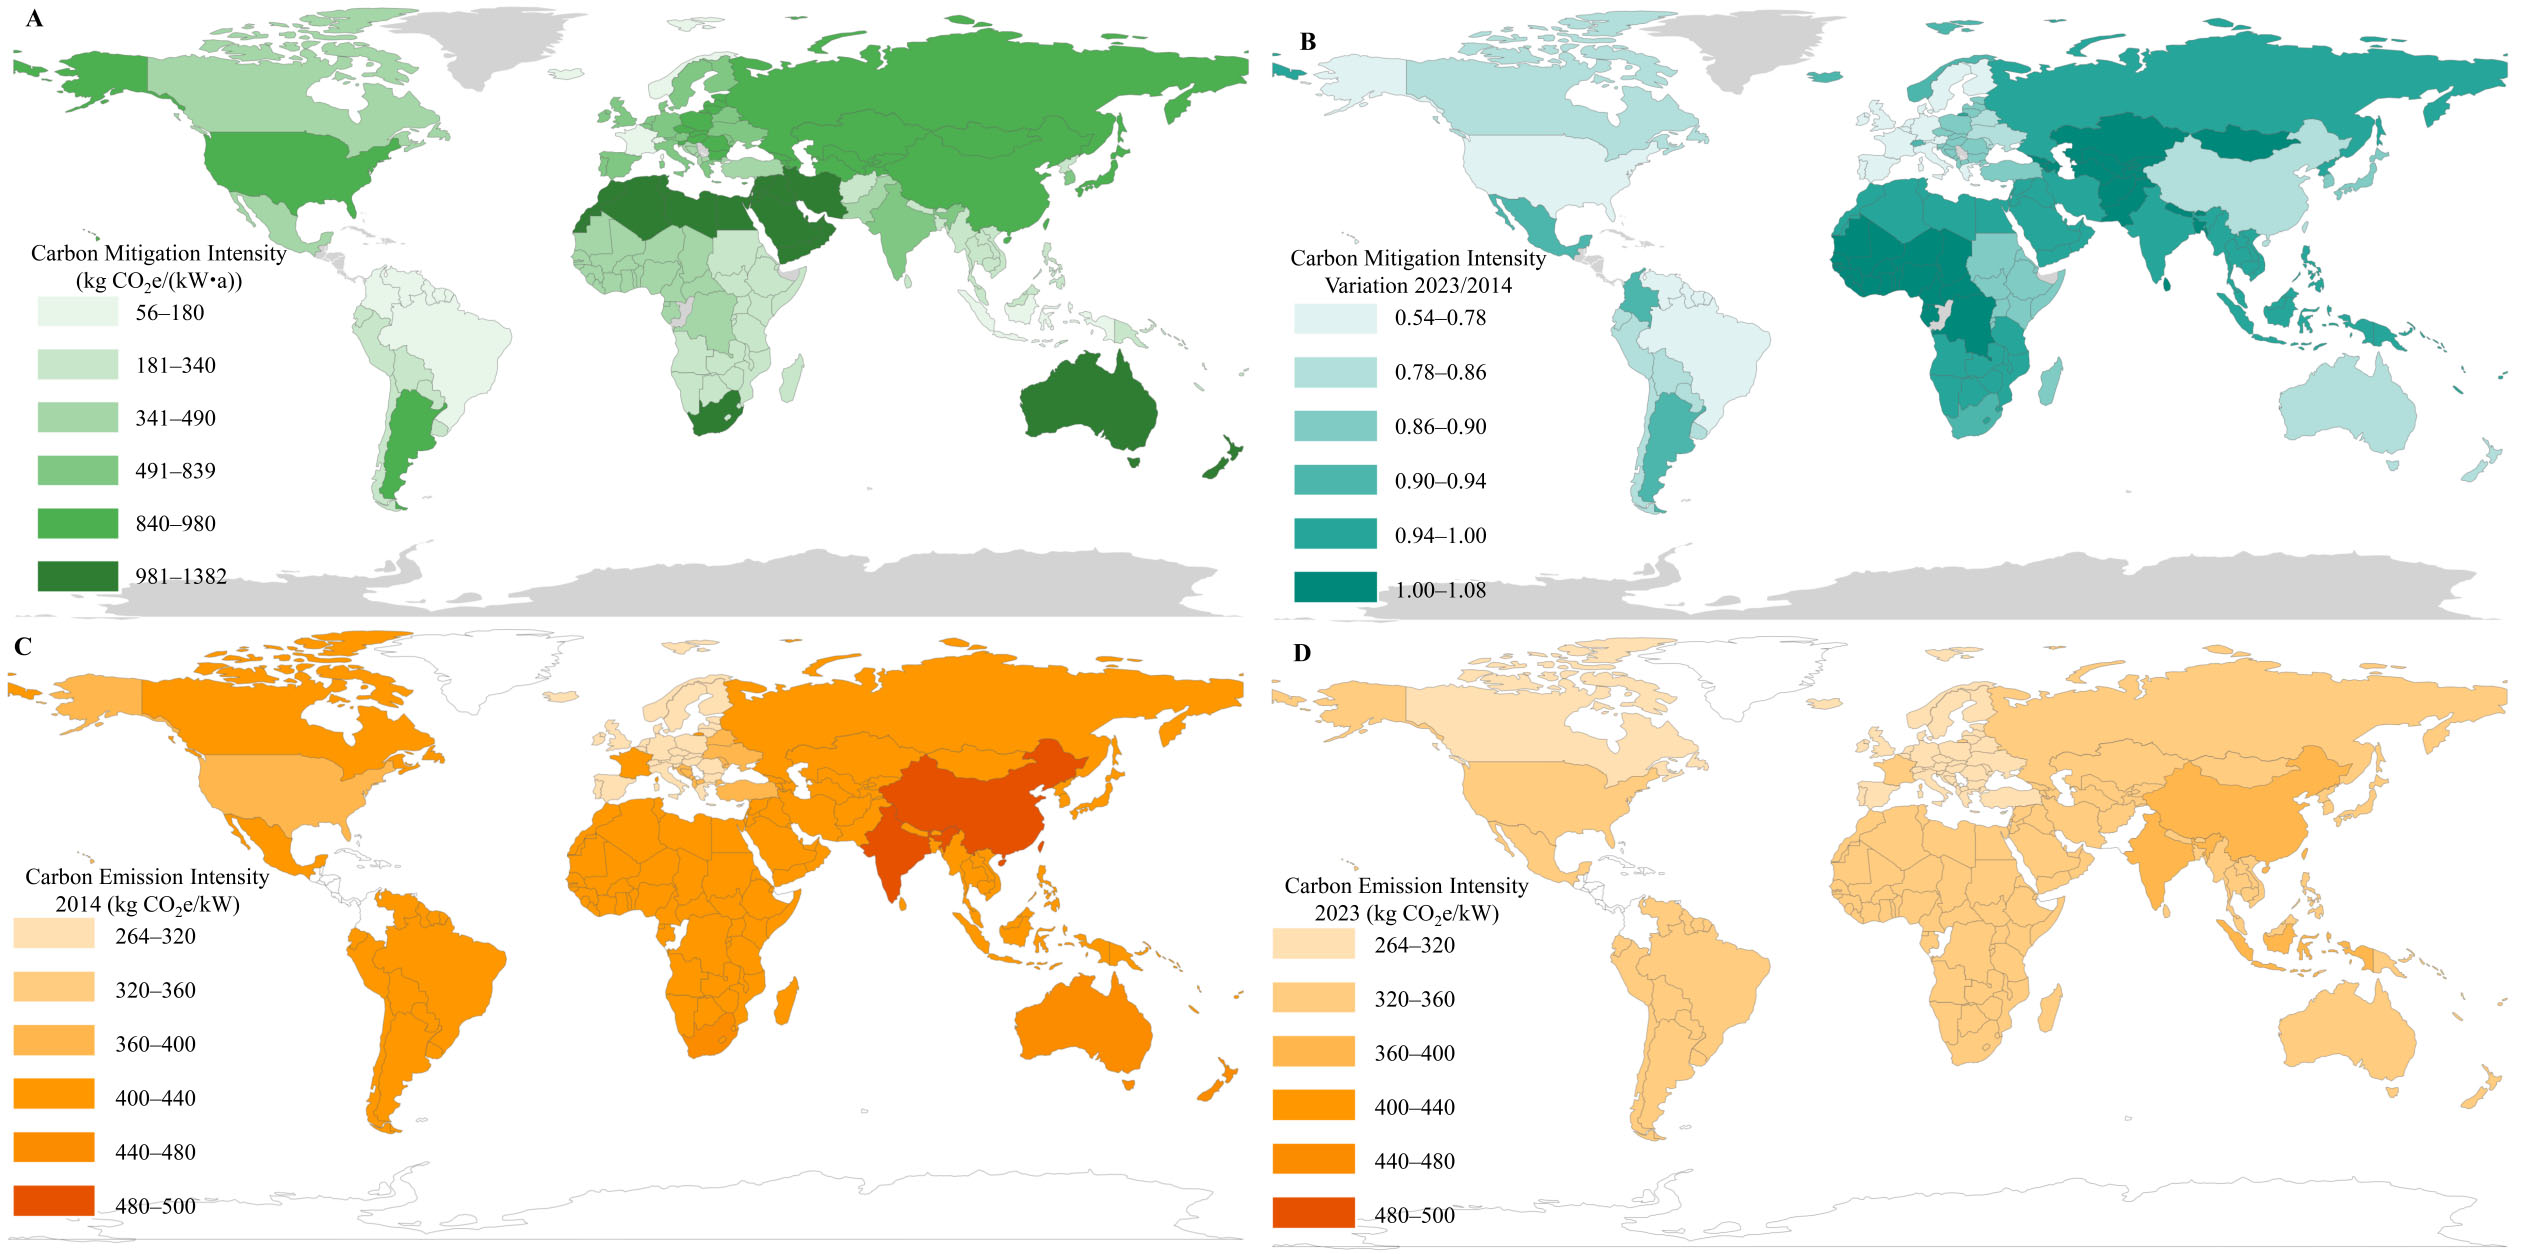
Figure 5. Spatiotemporal dynamics of carbon mitigation intensity and carbon emission intensity. (A) Carbon mitigation intensity across regions in 2014; (B) Carbon mitigation intensity variation expressed as the ratio of carbon mitigation intensity in 2023 to that of 2014; (C) Carbon emission intensity across regions in 2014; (D) Carbon emission intensity across regions in 2023. White and gray regions indicate the absence of data. The country boundary data are obtained from the Folium example GeoJSON dataset (https://raw.githubusercontent.com/python-visualization/folium/master/examples/data/world-countries.json).
Temporally, carbon mitigation intensity across most regions worldwide showed a clear decreasing trend due to grid decarbonization from 2014 to 2023 [Figure 5B]. For example, the carbon mitigation intensity of China decreased from 854.72 kg CO2e/(kW·a) in 2014 to 721.77 kg CO2e/(kW·a) in 2023, representing a reduction of 16%. This decline primarily stems from China’s active promotion of electricity mix adjustment over recent years. The country has gradually reduced coal’s share while expanding the capacity of other clean energy sources, such as hydro and solar, thereby lowering the grid carbon emission factor. As grid decarbonization accelerates, the relative carbon reductions achieved by substituting wind for coal decrease, leading to a decline in carbon mitigation intensity. However, in certain regions, the downward trend was not significant, with periodic fluctuations or even upward shifts observed. For instance, in eastern Africa, carbon mitigation intensity rose from 242.81 kg CO2e/(kW·a) in 2014 to 261.50 kg CO2e/(kW·a) in 2017, then declined to 209.69 kg CO2e/(kW·a) by 2023. In western Africa, carbon mitigation intensity over the decade showed no clear downward trend, instead increasing from 376 kg CO2e/(kW·a) in 2014 to 392.31 kg CO2e/(kW·a) in 2023. This pattern may be attributed to lagging wind power development in these regions. Installed capacity had not increased significantly from 2014 to 2023, whereas electricity demand continued to grow alongside economic development. Coal-fired power remained the dominant source, and grid cleanliness fluctuated. Consequently, the mitigation effect from substituting wind for coal became more pronounced, resulting in a rise in carbon mitigation intensity. The observed decline in carbon mitigation intensity serves as a warning. With continued grid decarbonization, the marginal mitigation benefit per unit of installed capacity will continue to decline. In the long term, relying solely on capacity expansion may not sustainably amplify global mitigation effects.
The spatial distribution of carbon emission intensity exhibited significant regional differences. In global regions, Europe showed relatively low carbon emission intensity overall. For example, in 2014, carbon emission intensities of EU-12, EU-15, and the European Free Trade Association were 304.19, 302.30, and 294.91 kg CO2e/kW, respectively, well below the global average [Figure 5C]. This is mainly due to Europe’s relatively clean electricity mix, where low-carbon power constitutes a high share of the electricity system, leading to lower emission intensity in turbine production. Furthermore, mature production technology and strict environmental regulations further promote energy efficiency and emission control during the production process. In contrast, emerging production centers such as China and India exhibit relatively high carbon emission intensity. In 2014, China and India reached 481.44 and 499.94 kg CO2e/kW, respectively, significantly higher than European levels. This disparity mainly stems from the high coal share in the two countries’ electricity systems, which means turbine production relies heavily on high-carbon electricity, thereby elevating carbon emissions per unit of installed capacity.
Temporally, the global average carbon emission intensity exhibited a decreasing trend from 2014 to 2023, declining from approximately 414.19 kg CO2e/kW in 2014 to 318.51 kg CO2e/kW in 2023 [Figure 5D]. This indicates that technological progress and electricity mix optimization in turbine production have achieved notable results. In China, carbon emission intensity decreased from 481.44 kg CO2e/kW in 2014 to 367.64 kg CO2e/kW in 2023, a reduction of about 24%. The trend toward cleaner production has, to a certain extent, offset the emission pressures from capacity expansion. A brief decomposition shows that turbine size increase was the primary driver behind carbon emission intensity decline in China from 2014 to 2023, contributing 100.94 kg CO2e/kW, which accounted for approximately 88.70% of the total decline. Meanwhile, production decarbonization contributes about 6.38%, indicating that improvements in the electricity mix during the production stage also play a key role in reducing emission intensity.
Comprehensive assessment of net carbon mitigation benefits from wind power under future scenarios
Historical results indicate that the net carbon mitigation benefits of global wind power have primarily relied on the direct carbon mitigation benefits of wind power. These effects are influenced not only by installed capacity and electricity generation but also by the dynamically changing regional carbon mitigation intensity. In practice, they highly depend on the spatial alignment between production and deployment stages. Against the backdrop of continued global wind power expansion, different production-deployment scenario choices may further amplify or alleviate this mismatch between emissions and benefits[60]. This study, grounded in a uniform assumption regarding global total installed capacity, systematically compares the carbon mitigation and emission performance of newly installed wind power systems under different deployment scenarios (C1-C3) and production scenarios (M1-M3). The objective is to reveal the relative contributions of each stage to future mitigation potential and their interaction mechanisms.
Decisive role of deployment scenarios in future net carbon mitigation benefits
Under the premise of maintaining the same global installed wind capacity, different regional deployment scenarios lead to significant divergence in global net carbon mitigation benefits. As shown in Figure 6, in C1 and C2, global annual net carbon mitigation benefits peak around 2034 and then decline. The cumulative benefits continue to rise throughout the study period, reaching 6,634 ± 77 Mt CO2e and 6,744 ± 97 Mt CO2e (mean ± 1σ) by 2034, with cumulative growth slowing thereafter. In contrast, C3 prioritizes the installation of new wind capacity in regions with higher grid carbon emission factors, effectively amplifying the marginal carbon mitigation per unit of installed capacity. Consequently, the cumulative global net carbon mitigation benefits in C3 after 2034 are significantly higher than those of C1 and C2, reaching 53,711 ± 935 Mt CO2e (mean ± 1σ) in 2060, substantially exceeding the baseline and demand-driven scenarios.
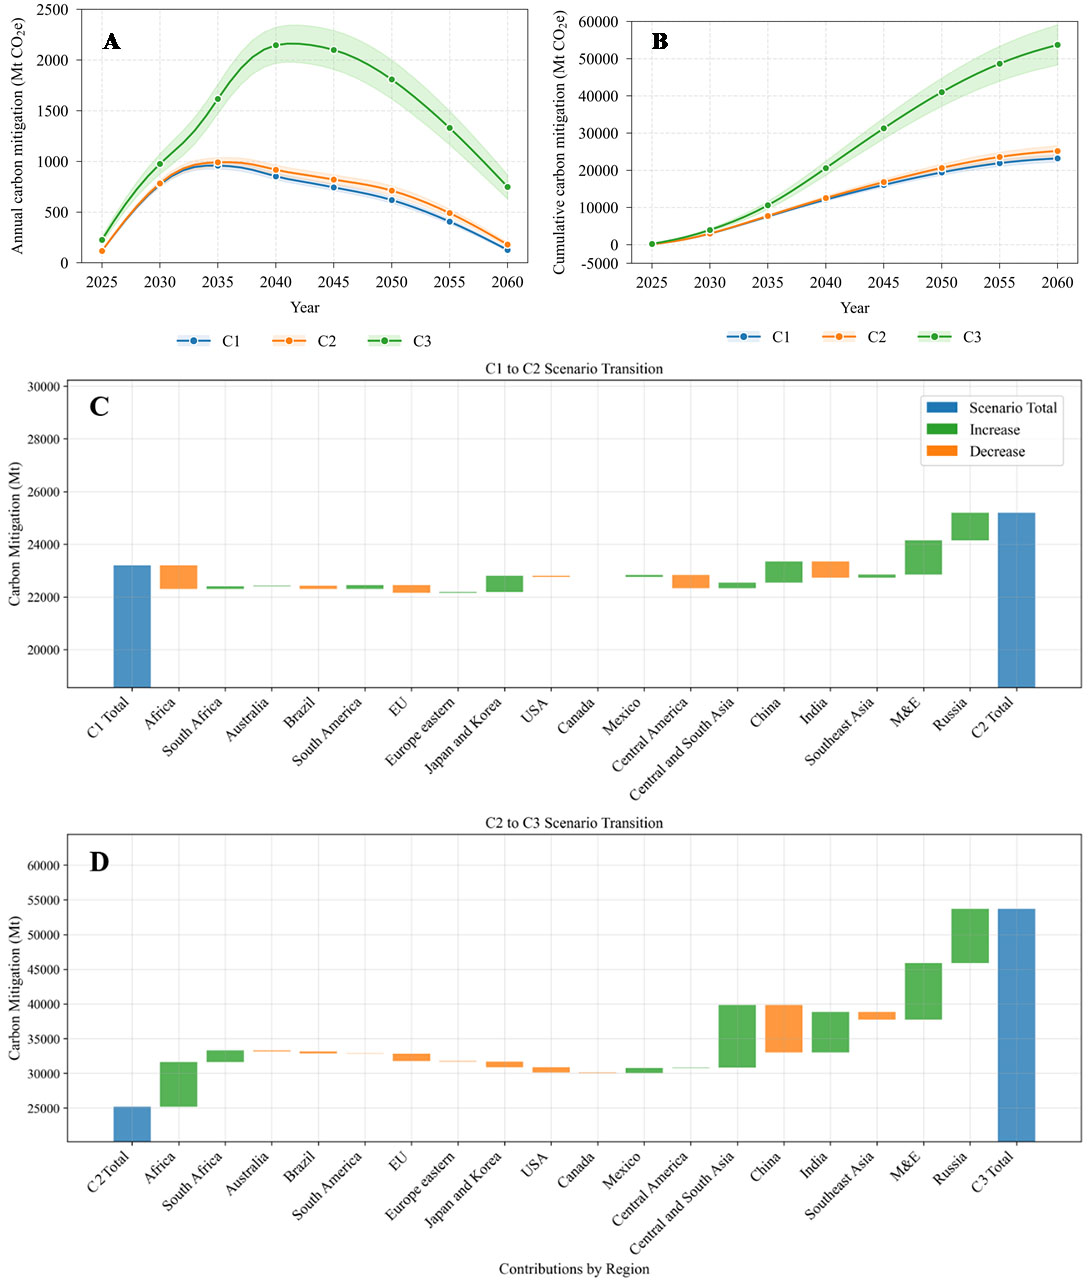
Figure 6. Comparison of global carbon mitigation across deployment scenarios. (A) Annual trends of net carbon mitigation benefits by scenarios (2025-2060); (B) Cumulative net carbon mitigation benefits by scenarios from 2025 to 2060; (C) Regional contributions to global net carbon mitigation benefits during the transition from scenario C1 to scenario C2. (D) Regional contributions to global net carbon mitigation benefits during the transition from scenario C2 to scenario C3. The three deployment scenarios are baseline deployment scenario (C1), balanced deployment scenario (C2), and climate-priority deployment scenario (C3).
At the regional level, compared with C1, scenario C2 sees increased carbon mitigation in regions such as the Middle East, non-EU Europe, Russia, China, and Japan/Korea. This rise stems from higher shares of newly installed capacity, driven by electricity demand. Conversely, Africa, India, and Central America experience a decrease in carbon mitigation, attributable to reduced allocation. When further adjusting from C2 to the C3 scenario, global net carbon mitigation benefits jump by 28,514 Mt CO2e. The primary contributions come from Central and South Asia, Russia, the Middle East, and non-EU Europe, Africa, and India. Their carbon mitigation increases by 9,022 Mt CO2e, 7,811 Mt CO2e, 8,164 Mt CO2e, 6,437 Mt CO2e, and 5,838 Mt CO2e, respectively. This is primarily because, under the climate-priority allocation strategy, these regions are allocated new capacity preferentially, with installation scales significantly larger than in C1 and C2. Additionally, the regional grid carbon emission factors in these regions are on average about 50% higher than the mean of C1/C2. This amplifies the marginal carbon mitigation per unit of installed capacity and substantially boosts total carbon mitigation.
Conversely, in regions such as the United States, South America, Japan/Korea, Europe, Mexico, and China, carbon mitigation under C3 is lower than that under C2. This is because their grid carbon emission factors are not particularly high, so they are not prioritized for new capacity allocation. Coupled with the retirement of older turbines and the reduction in operational wind turbines, electricity generation from wind decreases, leading to lower carbon mitigation. These results indicate that the mitigation potential of wind power is not solely determined by installed capacity. Instead, the regional deployment structure is the primary factor shaping future global carbon mitigation effectiveness.
Impacts of production scenarios on life cycle carbon emissions and costs
Compared with deployment scenarios, adjustments in production scenarios have a relatively limited impact on the life cycle carbon emissions of wind power systems. Nevertheless, they still hold certain mitigation potential. Under different production scenarios, cumulative carbon emissions during the wind turbine production stage vary. As shown in Figure 7A, over the 2025-2060 study period, cumulative carbon emissions (mean ± 1σ) for the three scenarios are 5,467 ± 92 Mt CO2e (M1), 5,299 ± 70 Mt CO2e (M2), and 4,718 ± 104 Mt CO2e (M3), respectively, with M3 reducing emissions by 13.7% compared to M1. M1 exhibits the highest cumulative production emissions. In contrast, the M3 scenario, led by Europe and the U.S., benefits from cleaner electricity grids and lower unit production emission intensity, achieving the lowest emissions during the production stage. Carbon emission intensity in M3 decreases by approximately 15% relative to M1 and M2, resulting in roughly 700 Mt CO2e lower cumulative emissions during the production stage.
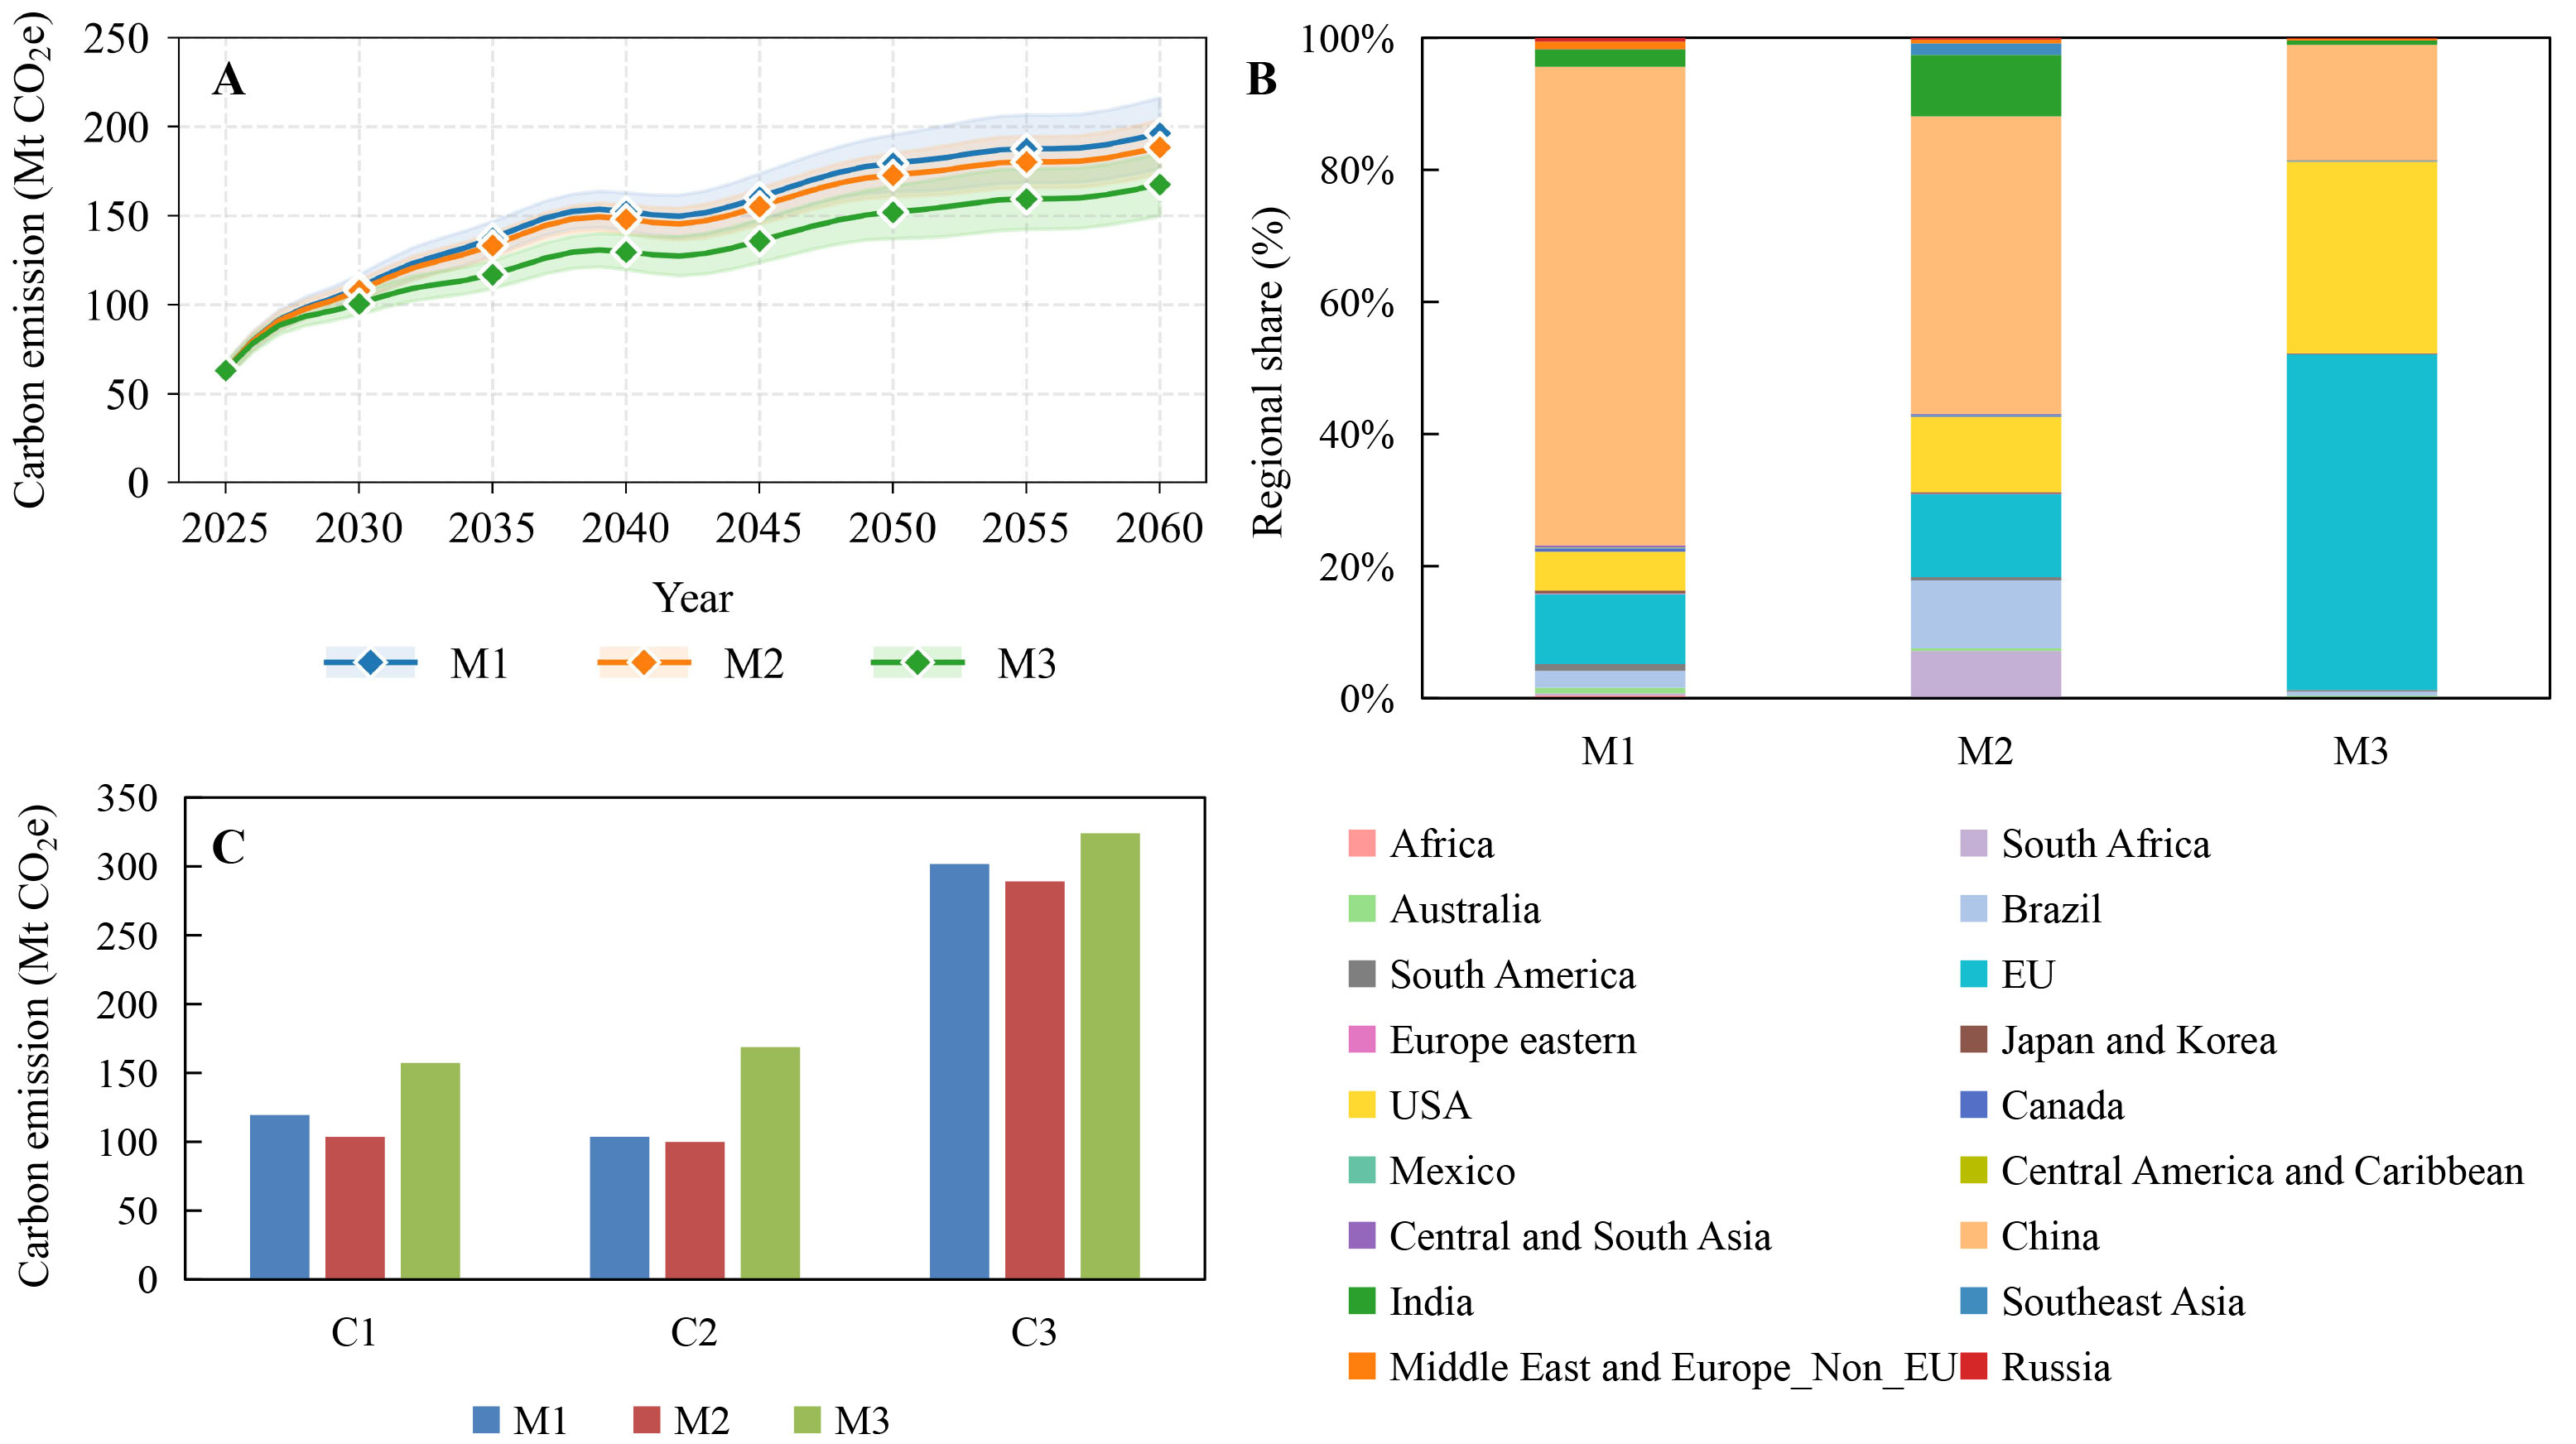
Figure 7. Life cycle carbon emissions and transportation impacts of production scenarios. (A) The life cycle carbon emissions by production scenarios from 2025 to 2060; (B) Contribution to life cycle carbon emissions by region under production scenarios (%); (C) Life cycle carbon emissions from inter-regional transportation. The three deployment scenarios are baseline deployment scenario (C1), balanced deployment scenario (C2), and climate-priority deployment scenario (C3). The three production scenarios are baseline production scenario (M1), spatially diversified production scenario (M2), and clean-oriented production scenario (M3).
Examining regional contributions under each scenario, M1 sees carbon emissions concentrated in China, at 3,955.5 Mt CO2e (72.4%), and the EU, at 577.1 Mt CO2e (10.6%) [Figure 7B]. In M2, the production centers are more dispersed, with production shares rising in Africa and Southeast Asia. China’s share drops to 44.1% (2,336.8 Mt CO2e), while contributions from other major production centers rise. In M3, Europe and the U.S. become the primary sources of emissions. The EU accounts for 2,397.1 Mt CO2e (50.8%), and the U.S. for 1,368.5 Mt CO2e (29.0%), whereas China’s share falls to 17.5% (823.8 Mt CO2e). Meanwhile, Africa, South America, and other regions contribute less than 1%. For example, Africa contributes 5.0 Mt CO2e during the future period (2025-2060).
The scenario comparison validates the effectiveness of the “localized clean production” strategy. However, compared with the mitigation gains from deployment scenarios, the emission improvements achievable through production scenarios adjustments remain secondary. This indicates that while decarbonizing production can reduce life cycle carbon emissions, it alone cannot dominate the mitigation performance of wind power systems on a global scale. Furthermore, the spatial configuration of production and deployment directly affects transportation routes. When cross-regional transportation is considered, the relative performance of different production scenarios exhibits more complex characteristics.
In addition, this study quantifies cross-regional transportation distances and volumes under M1, M2, and M3 scenarios, relying on shortest-path planning [Figure 7C]. Transportation planning results show that under deployment scenarios C1, C2, and C3, the M2 scenario consistently achieves the shortest overall transportation distance. This advantage stems from its more dispersed production centers, such as localized production in Southeast Asia and Africa. Regarding carbon emissions from transportation, M2 consistently yields the lowest emissions: 103.54 Mt CO2e (C1), 99.88 Mt CO2e (C2), and 289.11 Mt CO2e (C3). M3 produces the highest emissions (C1: 157.27 Mt CO2e, C2: 168.78 Mt CO2e, C3: 324.04 Mt CO2e), while M1 is intermediate (C1: 119.46 Mt CO2e, C2: 103.63 Mt CO2e, C3: 301.73 Mt CO2e). By dispersing production centers, M2 reduces transportation emissions by approximately 24% relative to the M3 scenario, which is characterized by Europe-U.S.-centralized production. Nevertheless, the transportation stage accounts for less than 2% of total emissions. Hence, its overall impact is minor compared to the production stage.
In realistic global production layouts, other factors such as economic viability and safety must also be taken into account. According to the latest global renewable energy generation cost report from the International Renewable Energy Agency (IRENA), onshore wind power, as an incremental renewable electricity source, exhibits significant regional cost differences worldwide. Projects in developed regions such as Europe and North America typically have overall costs above the global average due to structural factors, including labor, capital costs, and equipment depreciation. In contrast, regions with higher learning rates and lower production costs, such as Asia, South America, and Africa, generally incur lower costs. Additionally, IRENA notes that in certain mature markets, higher capital costs and complex supply chains present greater economic challenges for renewable energy, alongside higher uncertainties in project permitting, financing, and material supply[61].
Against this backdrop, production in low-carbon electricity regions in Europe and the U.S. (e.g., M3) theoretically reduces unit production emission intensity. However, this centralized strategy faces notable practical barriers under the current industrial policy landscape. Considering production costs, financing challenges, and supply chain risks, this centralized strategy is not necessarily optimal. A dispersed production layout (e.g., M2) helps bring production closer to major deployment markets. It reduces long-term transportation and inventory holding costs. It also enhances overall resilience in response to policy shifts, such as the IRA and CBAM, while mitigating risks associated with supply chain disruptions. Moreover, large-scale production advantages in cost-effective regions such as Asia and other emerging markets reduce production unit costs. These advantages provide globally competitive products, enhancing overall economic feasibility in international trade and project bidding. Therefore, when comparing carbon emissions in the production stage with overall economic costs and supply chain risks, the dispersed production scenario (M2) presents clear practical advantages. It offers an intermediate pathway for global wind power production that attempts to balance economic and risk management constraints.
Integrated impacts of production-deployment scenarios and long-term risks of inertia-based deployment
By integrating deployment, production, and transportation stages, the relative contributions of each phase to the life cycle carbon emissions and mitigation benefits of wind power systems can be more clearly identified [Figure 8A]. Over the 2025-2060 period, the deployment stage dominates the life cycle carbon mitigation across all scenarios, as it replaces fossil-fuel-based electricity generation, accounting for an absolute share of 86% [Figure 8B]. In contrast, emissions from production and transportation primarily act to “erode” net carbon mitigation benefits, contributing only 13% and 1%, respectively. Scenario comparisons show that the mitigation gains from deployment are also significantly higher than the optimization benefits achieved through production or transportation. This underscores the critical importance of effective deployment planning in the future development of the wind power sector.
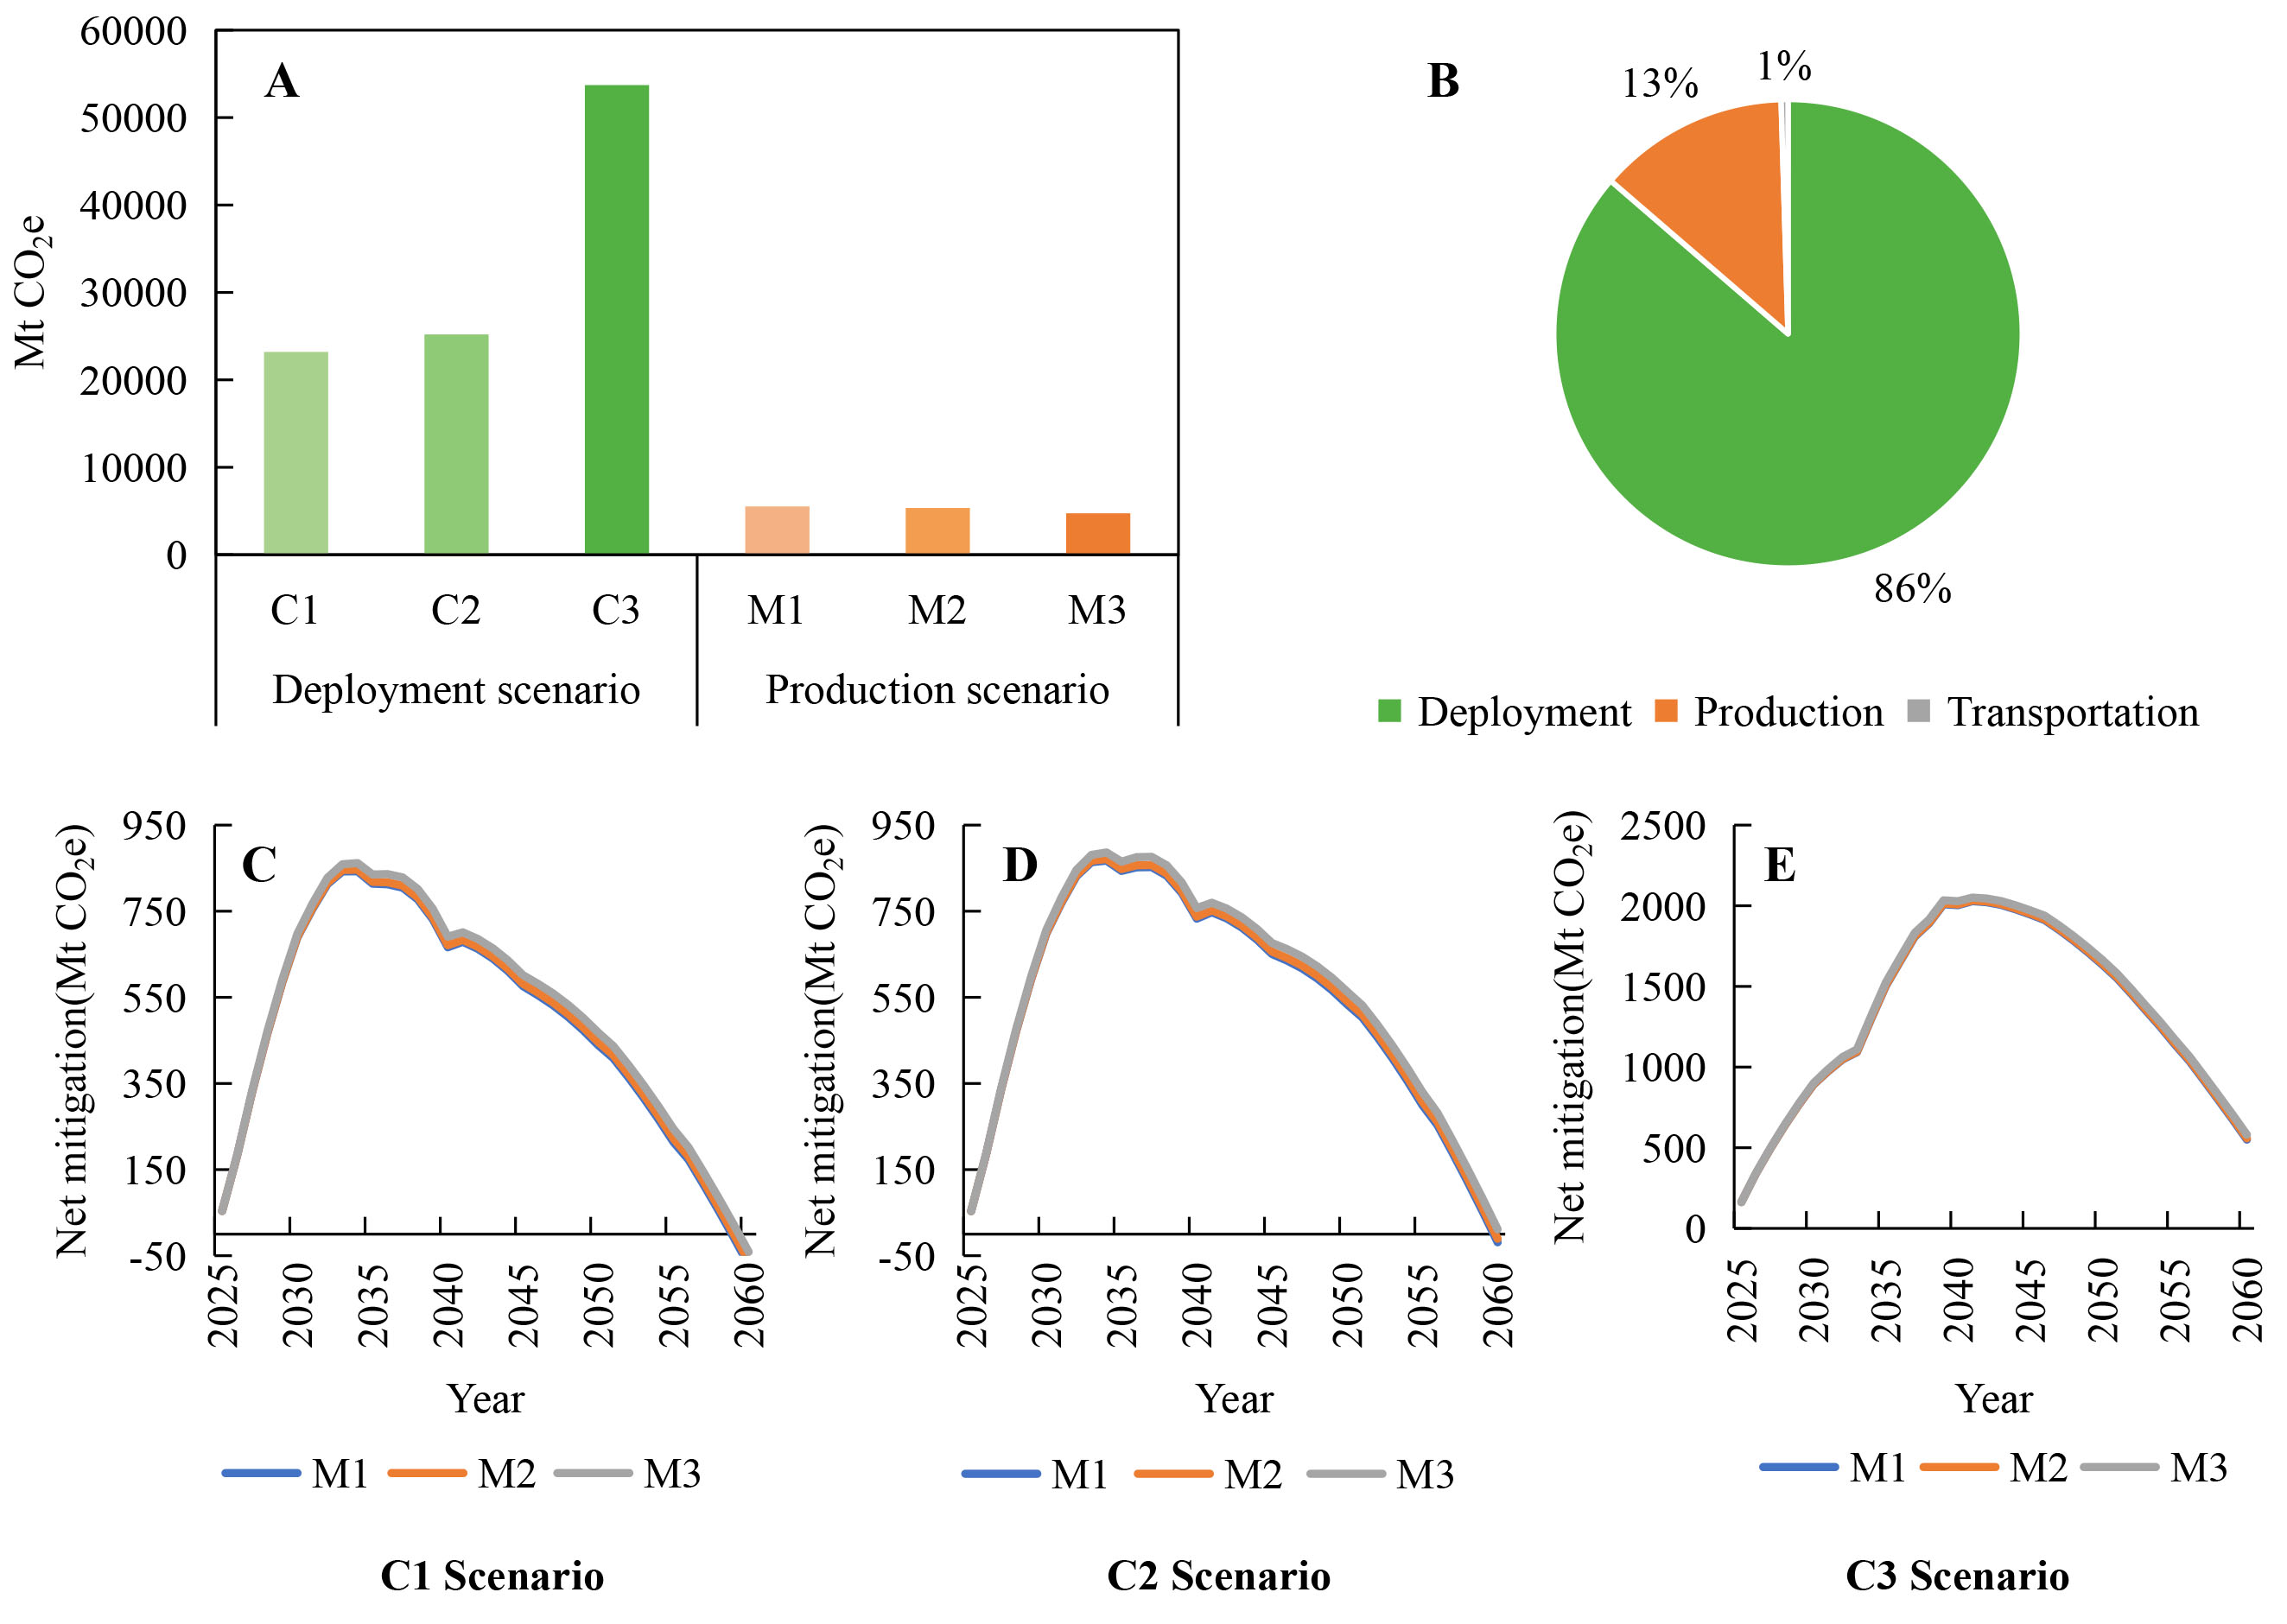
Figure 8. Integrated impacts of production-deployment scenarios. (A) Comparison of total impacts under different deployment and production scenarios; (B) Average contribution of deployment, production, and transportation stages; (C) Annual variation in net carbon mitigation benefits under the baseline deployment scenario (C1) from 2025 to 2060; (D) Annual variation in net carbon mitigation benefits under the balanced deployment scenario (C2) from 2025 to 2060; (E) Annual variation in net carbon mitigation benefits under the climate-priority deployment scenario (C3) from 2025 to 2060. The three production scenarios are baseline production scenario (M1), spatially diversified production scenario (M2), and clean-oriented production scenario (M3).
On an annual basis, under deployment scenarios C1 and C2, the global electricity system undergoes substantial decarbonization. Consequently, the carbon mitigation intensity of wind power in many regions declines to near zero during 2050-2060. This reduction sharply diminishes the mitigation benefits of wind power systems in these regions. Combined with persistent production and transportation emissions, this may result in negative net carbon mitigation benefits, weakening the long-term net mitigation intensity of wind power systems. We find that net mitigation becomes negative in 2059 under C1 and in 2060 under C2 [Figure 8C and D]. This is driven primarily by the pace of grid decarbonization, as the declining mitigation benefit is offset by persistent life cycle carbon emissions. In contrast, under scenario C3, new installed capacity is continuously allocated to regions with high-carbon grids. This effectively delays the decline in marginal mitigation benefits, ensuring that wind power expansion continues to provide significant net carbon mitigation benefits in the mid to long term [Figure 8E]. This finding further indicates that if future wind power expansion primarily follows historical trends or electricity-demand-driven inertia in regional deployment, the marginal mitigation benefits of wind systems may gradually weaken. Despite continued growth in total installed capacity, the systems’ contribution to long-term climate goals would be constrained.
Overall, the full realization of wind power system mitigation potential does not rely on extreme optimization in a single stage. Instead, it relies on systematic adjustments of the deployment structure, complemented by more pragmatic production configurations. Within this counterfactual framework, the C3-M2 combination stands out as a useful theoretical reference for balancing mitigation effectiveness with practical constraints, with its realization requiring additional implementation assessments.
Sensitivity analysis for production and deployment scenarios
To assess the robustness of the relative differences in manufacturing-related carbon emissions across production scenarios, we conduct a one-at-a-time (OAT) sensitivity analysis for non-grid emission factors of key materials[62]. For key materials with relatively high emission contributions that have undergone electricity-input decoupling, including steel, iron, aluminum, and resin, we impose perturbations to their non-grid emission factors. We preserve the dynamic evolution of the electricity-related component throughout this process. The resulting changes in future manufacturing-related carbon emissions are then quantified. As the responses exhibit an approximately linear relationship across different perturbation magnitudes, we primarily present the benefits for a 10% upward adjustment in the emission factors [Figure 9].
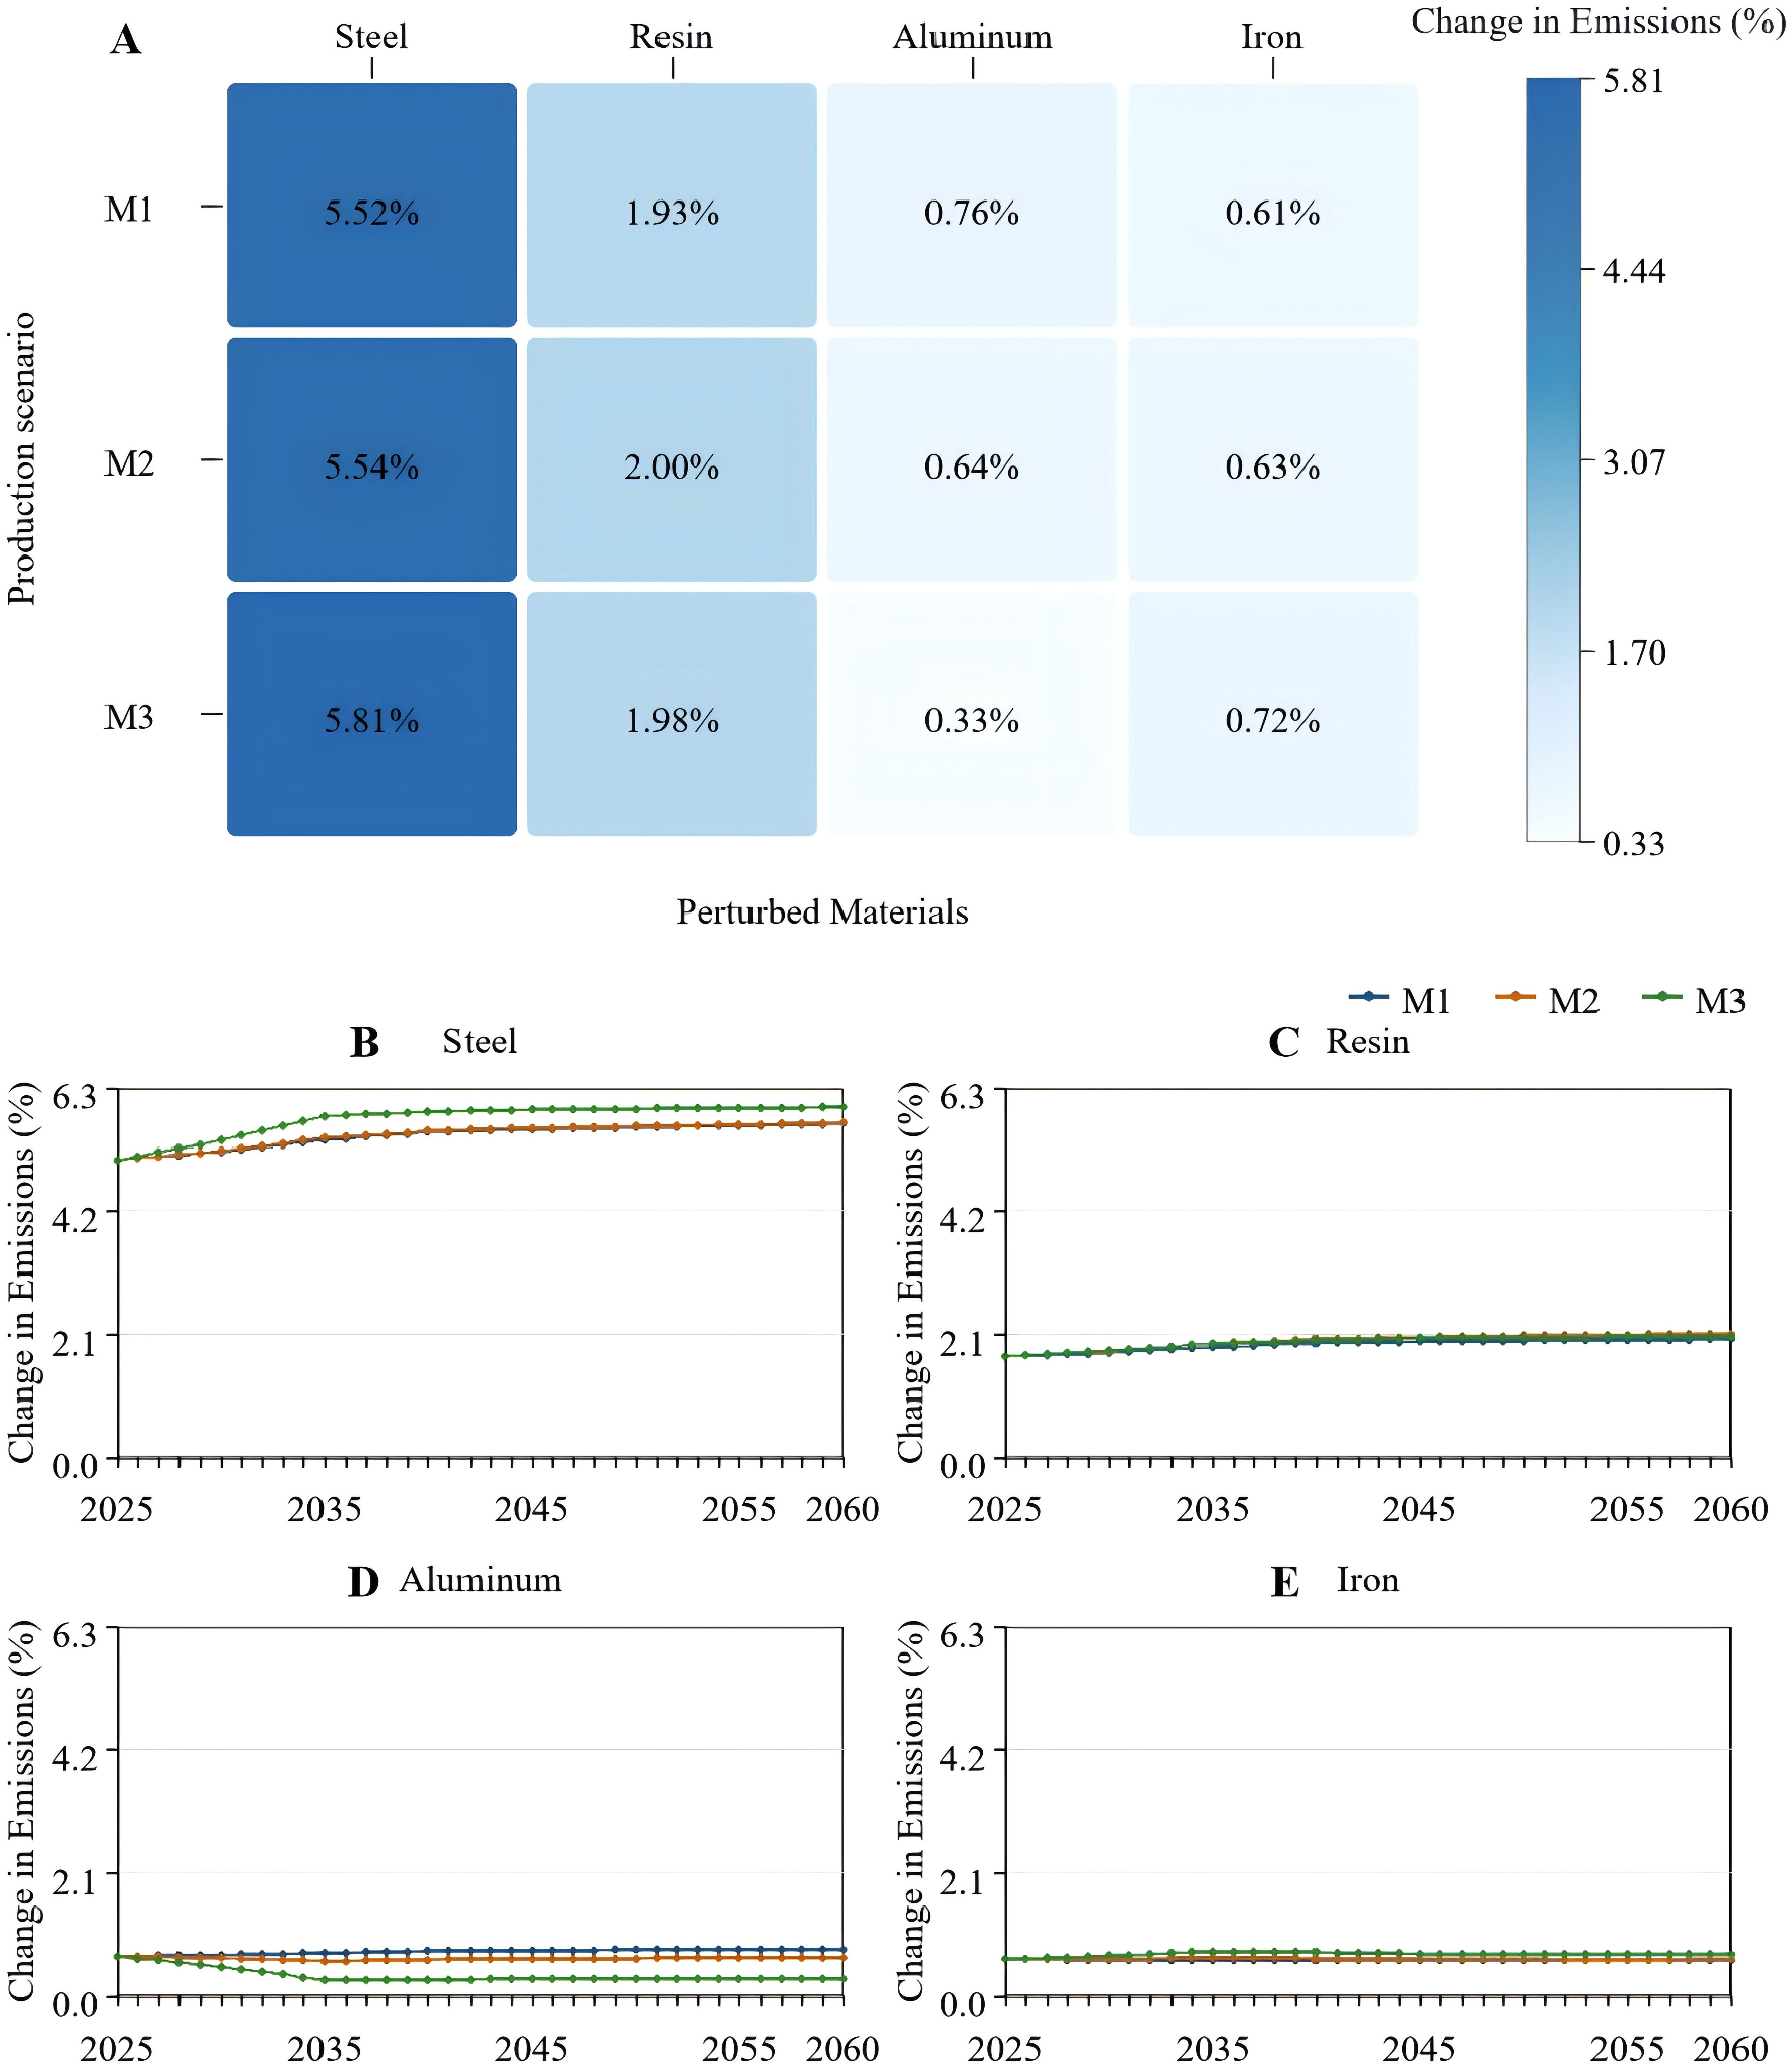
Figure 9. Sensitivity of future manufacturing-related carbon emissions to a 10% upward perturbation in non-grid emission factors of key materials. (A) Overall impact across production scenarios, and temporal evolution of (B) steel, (C) resin, (D) aluminum, and (E) iron from 2025 to 2060. The three production scenarios are baseline production (M1), spatially diversified production (M2), as well as clean-oriented production (M3).
Under the 10% upward setting, steel is identified as the most sensitive material affecting future manufacturing-related carbon emissions, with increases of 5.52%, 5.54%, and 5.81% under Scenarios M1, M2, and M3, respectively. Resin ranks second, with corresponding increases of 1.93%, 2.00%, and 1.98%. The impacts of aluminum and iron are comparatively marginal, with all increases remaining below 1%. Temporally, the sensitivity of each key material exhibits slight variations over the study period, yet remains generally stable. For instance, steel shows a change from 5.08% in 2025 to 5.68%-5.96% in 2060 across the three scenarios. Resin changes from 1.72% to 2.01%-2.10%, while iron and aluminum display even narrower fluctuations. In summary, the effect of the non-grid emission factors of key materials on future manufacturing-related carbon emissions is subject to multiple factors, namely annual production scale, regional production distribution, and the structural evolution of turbine sizes[18]. Nevertheless, the direction and relative ranking of these effects remain generally consistent. Therefore, the conclusions regarding the relative differences among the various production pathways in this study are reasonably robust.
In addition, to assess the robustness of the deployment scenario rankings among C1, C2, and C3, we analyzed the potential effects of key parameters based on study assumptions and existing literature [Table 5]. The parameters encompass resource conditions (wind capacity factors), grid characteristics (emission factors, decarbonization rates, and displacement factors), technical parameters (turbine lifetime and manufacturing intensity), demand (electricity demand and demand-side feedback), and other factors (grid access, social acceptance, and policy frameworks)[63-70].
Sensitivities of carbon mitigation benefits to key parameter variations across three deployment scenarios (C1, C2, C3)
| Key parameters | Parameter treatment | Real-world dynamics | Impact on ranking | Description |
| Wind capacity factors (CF) | Uniform | Climate change alters spatial distribution of wind resources[63,64] | Largely unchanged | CF is a uniform multiplier; scenario rankings remain stable |
| Regional grid emission factors | Uniform | Carbon-intensive regions may decarbonize faster, narrowing inter-regional disparities[65] | Unchanged | C3 advantage varies with disparity magnitude; ranking unchanged |
| Regional grid decarbonization rate | Uniform | Regional decarbonization paces differ[65] | Largely unchanged | Decarbonization pace differences may narrow C3’s gap with C2 |
| Fossil-fuel displacement factors | Uniform | Regional variation in marginal generation mix (coal vs. gas)[66,71] | Largely unchanged | C3 may be underestimated if marginal factors in carbon-intensive regions exceed averages, and vice versa |
| Turbine lifetime | Uniform | Actual lifetime depends on maintenance strategies and environmental loads[67] | Largely unchanged | Affects absolute magnitude, not scenario rankings |
| Manufacturing emission intensity | Uniform | Technological progress reduces emissions in specific regions[68] | Unchanged | Symmetric effect across all scenarios |
| Regional electricity demand | Uniform | Economic growth or electrification accelerates demand[57] | May change | Demand growth in carbon-intensive regions benefits C2, narrowing the gap with C3 |
| Demand-side feedback from capacity expansion | Not modeled | Wind deployment and electrification may both increase electricity demand[57] | May change | Demand-side feedback would likely favor C2 over C3 in the long term |
| Grid access conditions and social acceptance | Not modeled | Grid constraints and stakeholder acceptance may affect deployment[69] | May change | Grid constraints in carbon-intensive regions may weaken C3, potentially benefiting C2 or C1 |
| Policy and institutional frameworks | Not modeled | NDCs, subsidies, and carbon pricing may affect deployment[70,72] | May change | Limited policy support may affect C3 more significantly relative to C1 or C2 |
The ranking is primarily driven by the spatial pattern of deployment and the associated grid emission factors. Parameters such as wind capacity factors, regional grid emission factors, grid decarbonization rate, turbine lifetime, and manufacturing carbon intensity affect only the absolute magnitude of mitigation benefits, without changing scenario rankings. Wind capacity factors exhibit region-specific uncertainty due to natural climate variability[64]. Their spatial distribution is also subject to long-term shifts driven by climate change. However, in this study, capacity factor scales all scenarios proportionally. Even a ± 10% deviation in capacity factors would not alter the relative ranking of the three deployment scenarios, as identical datasets and assumptions are applied consistently across all scenarios. Our uncertainty analysis confirms that the relative ranking of the three scenarios is stable even if regional grid emission factor disparities narrow, with cumulative mitigation estimates (mean ± 1σ) by 2060 of 23,198 ± 167 Mt CO2e (C1), 25,198 ± 239 Mt CO2e (C2), and 53,711 ± 935 Mt CO2e (C3). Turbine lifetime and manufacturing emission intensity also affect the absolute magnitude of life cycle carbon emissions and carbon mitigation benefits, but do not alter the relative ranking of the three deployment scenarios. Nevertheless, carbon mitigation benefits are sensitive to electricity demand changes. It would also benefit from a positive demand-side feedback loop from capacity expansion. In this loop, greater installed capacity lowers electricity prices, which in turn stimulates demand and supports further capacity expansion[57]. Despite these sensitivities, the comparison remains meaningful because all deployment scenarios are evaluated within a consistent framework. The relative ranking offers relatively robust insights into the carbon mitigation benefits of alternative deployment pathways.
DISCUSSION
We present a spatiotemporal life cycle assessment framework that combines multi-source heterogeneous data to derive dynamic grid emission factors and activity levels. Building on this framework, we systematically evaluate the carbon mitigation benefits of global onshore wind power for both historical (2014-2023) and future (2025-2060) periods. By integrating dynamic grid emission factors, region-specific wind resource conditions, and evolving supply-chain configurations, the analysis enables a more nuanced evaluation of carbon mitigation benefits across both spatial and temporal scales. Historical production patterns are reconstructed using trade-flow information to improve the attribution of upstream emissions. Meanwhile, future deployment scenarios are aligned with GCAM-based projections to maintain consistency between historical accounting and long-term scenario analysis. The joint assessment of counterfactual production and deployment scenarios further facilitates the comparison of the relative mitigation impact of supply-chain organization and deployment strategies. This comparison is conducted within a unified analytical framework.
The results confirm that wind power delivers robust net climate benefits at the global scale. During 2014-2023, cumulative net carbon mitigation benefits reached 3,690 Mt CO2e, while life-cycle supply-chain emissions accounted for only 8.5% of direct carbon mitigation benefits. This underscores the strong climate advantage of wind energy from a life cycle perspective. At the same time, mitigation benefits exhibit pronounced spatial heterogeneity, driven not only by installed capacity expansion but also by regional grid carbon intensity and wind resource endowments. Regions characterized by carbon-intensive power systems and favorable wind conditions achieve substantially higher mitigation intensity.
The future climate contributions of wind power are dominated by deployment scenario choices rather than production layouts, reflecting theoretical mitigation potentials. The climate-priority deployment scenario (C3), which prioritizes installations in carbon-intensive grid regions, achieves approximately 2.3 times the cumulative global net mitigation of the baseline deployment scenario (C1) over 2025-2060, given the same total installed capacity. In contrast, inertia-driven or demand-driven deployment trajectories may lead to continuously declining marginal mitigation benefits. In certain regions, they may pose risks of negative net mitigation as power systems decarbonize. This is driven primarily by grid decarbonization in this study. However, other factors, including declining marginal fossil-fuel displacement, manufacturing and replacement emissions, and regional deployment patterns, may also affect this trend, though their contributions are not quantified here given data and methodological constraints. In contrast to deployment scenario choices, while optimizing production layouts can reduce supply-chain emissions, its overall contribution to mitigation remains secondary. The clean-oriented production scenario (M3) reduces manufacturing-stage carbon emissions by about 14%, while transportation emissions account for less than 2% of life cycle carbon emissions, exerting only a marginal influence on total mitigation benefits. Nevertheless, among production-side strategies, the spatially diversified scenario (M2) consistently delivers the lowest transportation emissions through improved spatial matching.
Several limitations and uncertainties should be acknowledged when interpreting the results. First, the deployment scenarios impose a penetration constraint that caps wind power generation at 70% of regional electricity supply to ensure power system stability. While this assumption reflects conservative planning considerations, it may underestimate the grid integration potential of wind power in regions with high system flexibility, advanced transmission networks, and large-scale storage deployment. Empirical evidence from regions such as the U.S. Midwest and Northern Europe suggests that through enhanced cross-regional transmission, demand response, and large-scale energy storage, wind penetration levels exceeding 80%-85% are technically achievable without compromising system reliability. This implies that the estimated mitigation potential in high-resource regions represents a lower-bound outcome[73,74]. The Weibull-based lifetime distribution provides a tractable representation of turbine retirement patterns, though we acknowledge the associated parameter uncertainties. The key parameters of this Weibull distribution are subject to further calibration against empirical operational data from wind farms. Moreover, this simplified assumption does not account for non-technical factors such as policy incentives and economic feasibility that affect decommissioned capacity. Future improvements could be achieved by incorporating a system dynamics model for comprehensive refinement[75].
In addition, despite efforts to construct region-specific and time-varying emission factors, global life cycle inventory data still face persistent limitations. For regions with insufficient detailed production data, relying on “Rest of World” proxies may obscure local technological characteristics and electricity mix, potentially smoothing regional differences in manufacturing-stage carbon emission intensity. We acknowledge that the historical production reconstruction involves inherent uncertainties due to the scarcity of systematic and transparent global manufacturing statistics. Our mass-balance approach, while providing a practical means to estimate regional production shares when direct data are unavailable, relies on trade and installation data that may be subject to reporting gaps and inconsistencies. This limitation highlights the necessity of regionalized inventories to be improved, particularly for emerging manufacturing centers in developing economies[76]. Future changes in electricity demand and grid emission factors, driven by manufacturing relocation, regional industrial expansion, and power-system feedback, could affect the actual mitigation benefits achieved. These impacts warrant deeper exploration in future integrated energy-system modeling studies. Meanwhile, technological uncertainty in the future remains an important source of variability[18]. While this study accounts for turbine upscaling trends, it does not explicitly model internal technological learning or disruptive innovations such as advanced composites, low-carbon steel, or hydrogen-based manufacturing. These could further alter life cycle emission profiles in ways not captured in this work[77].
Furthermore, the onshore wind power capacity in this study is subject to uncertainties. These uncertainties arise from the extrapolation of stock dynamics, variations in data availability across regions, and the fact that capacity expansion pathways vary considerably across deployment scenarios. Future installed capacity is constrained by multiple factors, including resource endowments, grid infrastructure, land availability, and environmental regulations such as ecological conservation red lines and biodiversity protection[16]. It is also shaped by market mechanisms, energy storage deployment, wind power forecasting capability, and policy and institutional frameworks[78,79]. This study focuses on the effects of production and deployment scenarios on manufacturing, transportation, operational substitution of fossil-fuel power for carbon mitigation, and economic performance. Future research could extend the system boundary to encompass full decommissioning and recycling. Special priority should be placed on blade material recovery and critical metal reuse once more comprehensive data become accessible.
A potential controversy raised by this study lies in the tension between climate-efficient deployment and economic or equity considerations. The climate-priority deployment scenario reallocates new wind installations toward regions with carbon-intensive power systems, many of which are developing economies. While such a strategy maximizes near-term global emission reductions, it may also intensify investment burdens and grid integration challenges in regions with limited financial and institutional capacity. The estimates presented here presuppose full grid absorption of wind-generated electricity. In actual deployment settings, the realized mitigation benefits could be moderated by curtailment, transmission constraints, or grid integration challenges, especially in regions with weaker grid infrastructure[58,59,80]. These challenges underscore the necessity of embedding deployment optimization within a broader framework of international policy coordination. Climate-oriented allocation strategies should be accompanied by innovative financing mechanisms. These include concessional climate finance, blended investment instruments, and earmarking of carbon border adjustment revenues to support grid and flexibility investments in regions with high mitigation potential. In this sense, the deployment scenarios analyzed in this study can be interpreted not as prescriptive planning prescriptions, but as counterfactual benchmarks that reveal where international cooperation could yield the largest climate dividends. Importantly, this counterfactual perspective complements rather than contradicts existing scenario narratives based on demand-driven or nationally determined pathways. By quantifying the opportunity cost of spatially inefficient deployment, this study provides an empirical basis for aligning climate ambition with considerations of fairness and shared responsibility. Future scenario designs would benefit from explicitly incorporating practical constraints across both production and deployment dimensions, including manufacturing capacity expansion rates, transmission expansion, regional technology-learning effects, investment costs, trade barriers, mineral supply, permitting, and policy implementation.
CONCLUSION
This study develops a globally resolved, spatiotemporally explicit life cycle assessment framework to evaluate the carbon mitigation benefits of onshore wind power across the historical period (2014-2023) and future production-deployment scenarios (2025-2060). The findings demonstrate that wind power provides substantial net climate benefits from a life cycle perspective. However, these benefits are highly contingent on wind capacity deployment locations, the evolution of regional electricity systems, and the spatial organization of supply chains.
The comparison of production and deployment scenarios shows that deployment planning has a stronger influence on global carbon mitigation benefits than production-side optimization, reflecting theoretical mitigation potentials under the counterfactual scenario settings. Global cumulative net carbon mitigation reached 3,690 Mt CO2e over 2014-2023, while life cycle carbon emissions accounted for only 8.5% of the direct carbon mitigation benefits from fossil-fuel electricity displacement. Prioritizing new wind installations in carbon-intensive regions can preserve high marginal mitigation benefits if significant inter-regional grid emission factor disparities persist. However, this advantage is conditional and may weaken over time if these regions decarbonize faster, narrowing the gap with low-carbon regions. In contrast, relocating production to cleaner manufacturing regions reduces upstream emissions but plays a secondary role in overall mitigation. The spatially diversified production scenario reduces cross-regional logistics and transportation emissions by improving the spatial alignment between manufacturing and deployment regions.
Overall, maximizing the long-term carbon mitigation potential of wind power will require coordinated planning across deployment and production systems. International cooperation, targeted investment, and support for grid flexibility in regions with high mitigation potential are essential for converting continued wind power expansion into more robust and enduring climate benefits.
DECLARATIONS
Acknowledgments
The country boundary data included in the graphical abstract were obtained from the Folium example GeoJSON dataset (https://raw.githubusercontent.com/python-visualization/folium/master/examples/data/world-countries.json).
Authors’ contributions
Conceptualization, methodology, formal analysis, data curation, software, visualization, writing-original draft: Yang, J.
Data investigation, data curation, software, visualization, and analysis: Yao, S.
Data provision, formal analysis, validation, writing-review and editing: Li, C.
Writing-review and editing: Su, Y.
Data investigation and writing-review and editing: Zhang, X.
Data investigation and writing-review and editing: Huang, G.
Supervision, project administration, writing-review and editing: Lu, X.
Availability of data and materials
The Life Cycle Inventory (LCI) is compiled by drawing on data from relevant academic literature, LCA reports published by wind turbine manufacturers, and datasets provided by the Chinese Wind Energy Association and wind energy enterprises[5,37-40]. Region-specific emission factors are sourced from the GaBi Professional and Ecoinvent databases[42,43].
AI and AI-assisted tools statement
During the preparation of this manuscript, the AI tool DeepSeek (version DeepSeek-V4, released 2026-04-24) was used solely for language editing. The tool did not influence the study design, data collection, analysis, interpretation, or the scientific content of the work. All authors take full responsibility for the accuracy, integrity, and final content of the manuscript.
Financial support and sponsorship
This work was supported by the Carbon Neutrality and Energy System Transformation (CNEST) Program (No. 2023YFE0204600), National Natural Science Foundation of China (No. L2524074), Science and Technology Project of the Dongfang Electric Corporation-Tsinghua University Joint Research Institute (No. JIEEE-20250113), Special Fund of State Key Laboratory of Regional Environment and Sustainability (No. 26Y03REST), National Science and Technology Major Project for Comprehensive Environmental Management of the Beijing-Tianjin-Hebei Region (No. 2026ZD1216702, No. 2026ZD1216700), China Southern Power Grid Headquarters Technology Project (No. ZBKJXM20232255, No. ZBKJXM20232257), Yunnan Provincial Science and Technology Program (No. 202603AT100001), and Beijing Laboratory of Environmental Frontier Technologies, Beijing Municipal Education Commission.
Conflicts of interest
Lu, X. is the Associate Editor of the Carbon Footprints journal. He had no involvement in the review or editorial process of this manuscript, including but not limited to reviewer selection, evaluation, or the final decision, while the other authors have declared that they have no conflicts of interest.
Ethical approval and consent to participate
Not applicable.
Consent for publication
Not applicable.
Copyright
© The Author(s) 2026.
REFERENCES
1. Tagomori, I. S.; Diuana, F. A.; Baptista, L. B.; et al. Promising climate progress from net-zero ambitions to the Paris Agreement goal. Nat. Clim. Chang. 2026, 16, 550-7.
2. Barthelmie, R. J.; Pryor, S. C. Climate change mitigation potential of wind energy. Climate 2021, 9, 136.
3. GWEC. Global Wind Report 2026. 2026. https://www.gwec.net/reports/globalwindreport (accessed 2026-8-28).
4. Wang, J.; Chen, L.; Tan, Z.; et al. Inherent spatiotemporal uncertainty of renewable power in China. Nat. Commun. 2023, 14, 5379.
5. Ruan, Z.; Lu, X.; Yin, Z.; et al. Spatiotemporal carbon footprint and associated costs of wind power toward China's carbon neutrality. Resour. Conserv. Recy. 2024, 205, 107593.
6. Chen, S.; Lu, X.; Nielsen, C. P.; et al. Deploying solar photovoltaic energy first in carbon-intensive regions brings gigatons more carbon mitigations to 2060. Commun. Earth. Environ. 2023, 4, 1006.
7. Schleisner, L. Life cycle assessment of a wind farm and related externalities. Renew. Energy. 2000, 20, 279-88.
8. Tremeac, B.; Meunier, F. Life cycle analysis of 4.5MW and 250W wind turbines. Renew. Sust. Energ. Rev. 2009, 13, 2104-10.
9. Crawford, R. Life cycle energy and greenhouse emissions analysis of wind turbines and the effect of size on energy yield. Renew. Sust. Energ. Rev. 2009, 13, 2653-60.
10. Raadal, H. L.; Vold, B. I.; Myhr, A.; Nygaard, T. A. GHG emissions and energy performance of offshore wind power. Renew. Energy. 2014, 66, 314-24.
11. Vargas, A.; Zenón, E.; Oswald, U.; Islas, J.; Güereca, L.; Manzini, F. Life cycle assessment: a case study of two wind turbines used in Mexico. Appl. Therm. Eng. 2015, 75, 1210-6.
12. Schreiber, A.; Marx, J.; Zapp, P. Comparative life cycle assessment of electricity generation by different wind turbine types. J. Clean. Prod. 2019, 233, 561-72.
13. Chen, G.; Yang, Q.; Zhao, Y. Renewability of wind power in China: a case study of nonrenewable energy cost and greenhouse gas emission by a plant in Guangxi. Renew. Sust. Energ. Rev. 2011, 15, 2322-9.
14. Yang, J.; Chen, B. Integrated evaluation of embodied energy, greenhouse gas emission and economic performance of a typical wind farm in China. Renew. Sust. Energ. Rev. 2013, 27, 559-68.
15. Turconi, R.; Boldrin, A.; Astrup, T. Life cycle assessment (LCA) of electricity generation technologies: overview, comparability and limitations. Renew. Sust. Energ. Rev. 2013, 28, 555-65.
16. Xu, K.; Zhu, H.; Zhang, S.; et al. Land use impacts the environmental benefits of wind energy farms in China. Commun. Earth. Environ. 2025, 6, 2833.
17. Xu, K.; Chang, J.; Zhou, W.; et al. A comprehensive estimate of life cycle greenhouse gas emissions from onshore wind energy in China. J. Clean. Prod. 2022, 338, 130683.
18. Faizan, M.; Afgan, I. Life cycle assessment of wind turbine systems: A statistical synthesis approach to address greenhouse gas emissions. Renew. Sust. Energ. Rev. 2026, 226, 116429.
19. Arvesen, A.; Hertwich, E. G. Assessing the life cycle environmental impacts of wind power: A review of present knowledge and research needs. Renew. Sust. Energ. Rev. 2012, 16, 5994-6006.
20. Mendecka, B.; Lombardi, L. Life cycle environmental impacts of wind energy technologies: A review of simplified models and harmonization of the results. Renew. Sust. Energ. Rev. 2019, 111, 462-80.
21. Wang, Y.; Sun, T. Life cycle assessment of CO2 emissions from wind power plants: Methodology and case studies. Renew. Energy. 2012, 43, 30-6.
22. Long, Y.; Chen, Y.; Liu, Y.; Wang, H. Wind energy expansion in China produces substantial CO2 reductions and climate benefits. GeoSus 2026, 7, 100489.
23. Sahu, B. K. Wind energy developments and policies in China: a short review. Renew. Sust. Energ. Rev. 2018, 81, 1393-405.
24. Global Wind Energy Council BCG. Mission Critical: Building the Global Wind Energy Supply Chain for a 1.5 °C World. 2023. 05 December 2023. https://www.windtech-international.com/industry-news/mission-critical-building-the-global-wind-energy-supply-chain-for-a-1-5-c-world (accessed 2026-8-28).
25. Ramseur, J. L. Inflation Reduction Act of 2022 (IRA): Provisions Related to Climate Change. 2023. https://www.congress.gov/crs_external_products/R/PDF/R47262/R47262.3.pdf (accessed 2026-8-28).
26. Union EPaCotE. Regulation (EU) 2023/956 of the European Parliament and of the Council of 10 May 2023 establishing a carbon border adjustment mechanism. 2023. PE/7/2023/REV/1. http://data.europa.eu/eli/reg/2023/956/oj (accessed 2026-8-28).
27. Arvesen, A.; Hertwich, E. G. Environmental implications of large-scale adoption of wind power: a scenario-based life cycle assessment. Environ. Res. Lett. 2011, 6, 045102.
28. Way, R.; Ives, M. C.; Mealy, P.; Farmer, J. D. Empirically grounded technology forecasts and the energy transition. Joule 2022, 6, 2057-82.
29. Wang, Y.; Wang, R.; Tanaka, K.; et al. Global spatiotemporal optimization of photovoltaic and wind power to achieve the Paris Agreement targets. Nat. Commun. 2025, 16, 2127.
30. Helveston, J. P.; He, G.; Davidson, M. R. Quantifying the cost savings of global solar photovoltaic supply chains. Nature 2022, 612, 83-7.
31. Sherman, P.; Chen, X.; McElroy, M. B. Wind-generated electricity in China: decreasing potential, inter-annual variability and association with changing climate. Sci. Rep. 2017, 7, 16294.
32. Hertwich, E. G.; Gibon, T.; Bouman, E. A.; et al. Integrated life-cycle assessment of electricity-supply scenarios confirms global environmental benefit of low-carbon technologies. Proc. Natl. Acad. Sci. U. S. A. 2015, 112, 6277-82.
33. Standardization IOf. International Organization for Standardization. Environmental Management: Life Cycle Assessment: Principles and Framework. ISO 14040:2006. International Organization for Standardization. 2006. https://www.iso.org/standard/37456.html (accessed 2026-8-28).
34. Standardization IOf. International Organization for Standardization. Environmental Management: Life Cycle Assessment: Requirements and Guidelines. ISO 14044:2006. 2006. https://www.iso.org/standard/38498.html (accessed 2026-8-28).
35. Zimmermann, T.; Rehberger, M.; Gößling-Reisemann, S. Material flows resulting from large scale deployment of wind energy in Germany. Resources 2013, 2, 303-34.
36. Yang, D.; Liu, J.; Yang, J.; Ding, N. Carbon footprint of wind turbine by life cycle assessment. Huanjing. Kexue. Xuebao/Acta. Scientiae. Circumstantiae. 2015, 35, 927-34.
37. Razdan, P.; Garrett, P. Assessment of Electricity Production from an Onshore V117-4.2 MW Wind Plant. 2019. https://www.vestas.com/en/sustainability/environment/lifecycle-assessments (accessed 2026-8-28).
38. Razdan, P.; Garrett, P. Life Cycle Assessment of Electricity Production from an Onshore V100-2.0 MW Wind Plant. 2018. https://www.vestas.com/en/sustainability/environment/lifecycle-assessments (accessed 2026-8-28).
39. Razdan, P.; Garrett, P. Life Cycle Assessment of Electricity Production from an Onshore V90-3.0 MW Wind Plant. 2013. https://www.vestas.com/en/sustainability/environment/lifecycle-assessments (accessed 2026-8-28).
40. Razdan, P.; Garrett, P. Life Cycle Assessment of Electricity Production from an Onshore V150-6.0 MW Wind Plant. 2023. https://www.vestas.com/en/sustainability/environment/lifecycle-assessments (accessed 2026-8-28).
41. Institute, J. G. C. R. GCAM regional definitions. Joint Global Change Research Institute. https://jgcri.github.io/gcambreakout/articles/regional.html (accessed 2026-8-28).
42. AG t. Data from: GaBi Professional Database. 2023. Leinfelden-Echterdingen, Germany. https://www.gabi-software.com/software/gabi-professional/ (accessed 2026-8-28).
43. Wernet, G.; Bauer, C.; Steubing, B.; Reinhard, J.; Moreno-Ruiz, E.; Weidema, B. The ecoinvent database version 3 (part I): overview and methodology. Int. J. Life. Cycle. Assess. 2016, 21, 1218-30.
44. Ember. Data from: Lifecycle carbon intensity of electricity generation. 2025. Our World in Data. https://ourworldindata.org/grapher/carbon-intensity-electricity (accessed 2026-8-28).
45. Enerdata. CO2 intensity of electricity generation trend over 2000-2050: EnerBlue scenario. 2024. https://eneroutlook.enerdata.net/forecast-world-co2-intensity-of-electricity-generation.html (accessed 2026-8-28).
46. Li, J.; Peng, K.; Wang, P.; et al. Critical rare-earth elements mismatch global wind-power ambitions. One. Earth. 2020, 3, 116-25.
47. Woo, S. Modern definitions in reliability engineering. In: Reliability design of mechanical systems. Cham: Springer International Publishing; 2017, pp 35-59.
48. GAC. China Customs Statistics Database. 2026. General Administration of Customs of the People's Republic of China. http://stats.customs.gov.cn (accessed 2026-8-28).
49. Eurostat. Data from: International trade in goods database. 2026. https://ec.europa.eu/eurostat (accessed 2026-8-28).
50. Bureau, U. C. Data from: USA Trade Online Data Tool. 2026. https://usatrade.census.gov/ (accessed 2026-8-28).
51. Canada Go. Data from: Canada Trade Data Online. 2026. https://ised-isde.canada.ca/app/ixb/tdo/crtr.html (accessed 2026-8-28).
53. IRENA. Global Renewables Outlook: Energy transformation 2050. 2020. https://www.irena.org/publications/2020/Apr/Global-Renewables-Outlook-2020 (accessed 2026-8-28).
54. Zhang, Z.; Zhu, Z.; Lu, X.; Zhang, D.; Davidson, M. R. Ratcheting up wind and solar targets for decarbonizing the power sector in China and beyond. Cell. Rep. Sustain. 2025, 2, 100389.
55. Jacobson, M. Z.; von, Krauland. A.; Coughlin, S. J.; et al. Low-cost solutions to global warming, air pollution, and energy insecurity for 145 countries. Energy. Environ. Sci. 2022, 15, 3343-59.
56. SEA-DISTANCES.ORG. Distances between sea ports. SEA-DISTANCES.ORG. 2026. https://sea-distances.org/ (accessed 2026-8-28).
57. Luderer, G.; Madeddu, S.; Merfort, L.; et al. Impact of declining renewable energy costs on electrification in low-emission scenarios. Nat. Energy. 2022, 7, 32-42.
58. Ahmed, S. D.; Al-Ismail, F. S. M.; Shafiullah, M.; Al-Sulaiman, F. A.; El-Amin, I. M. Grid integration challenges of wind energy: a review. IEEE. Access. 2020, 8, 10857-78.
59. Lu, K.; Hong, C.; Lian, J.; Cheng, F. A review of synergies between advanced grid integration strategies and carbon market for wind energy development. Energies 2025, 18, 590.
60. Meier, J.; Lehmann, P.; Süssmuth, B.; Wedekind, S. Wind power deployment and the impact of spatial planning policies. Environ. Resource. Econ. 2024, 87, 491-550.
61. IRENA. World Energy Transitions Outlook 2023: 1.5 °C Pathway. 2023. https://www.irena.org/Publications/2023/Jun/World-Energy-Transitions-Outlook-2023 (accessed 2026-8-28).
62. Borgonovo, E.; Plischke, E. Sensitivity analysis: a review of recent advances. Eur. J. Oper. Res. Soc. 2016, 248, 869-87.
63. Lu, X.; McElroy, M. B.; Kiviluoma, J. Global potential for wind-generated electricity. Proc. Natl. Acad. Sci. U. S. A. 2009, 106, 10933-8.
64. Pryor, S. C.; Barthelmie, R. J.; Bukovsky, M. S.; Leung, L. R.; Sakaguchi, K. Climate change impacts on wind power generation. Nat. Rev. Earth. Environ. 2020, 1, 627-43.
65. IPCC. Sixth Assessment Report of the Intergovernmental Panel on Climate Change. 2022. https://www.ipcc.ch/assessment-report/ar6/ (accessed 2026-8-28).
66. York, R. Do alternative energy sources displace fossil fuels? Nature. Clim. Change. 2012, 2, 441-3.
67. Oh, S. Y.; Joung, C.; Lee, S.; et al. Condition-based maintenance of wind turbine structures: a state-of-the-art review. Renew. Sust. Energ. Rev. 2024, 204, 114799.
68. Zhao, Y.; Wu, L.; Shi, B.; Zhang, H.; Miao, C. The influencing factors and scenario simulation of embodied carbon emissions in manufacturing trade in the Yellow River Basin: an analysis from the perspective of technological effects. Energy 2026, 342, 139619.
69. Hoehnke, H.; Wussow, M.; Zanocco, C.; Carley, S.; Konisky, D.; Neumann, D. Structural barriers and policy pathways for a just clean energy transition. Nat. Rev. Clean. Technol. 2026, 2, 327-47.
70. Frilingou, N.; Van, de. Ven. D. J.; Sampedro, J.; et al. Regional impacts on decarbonisation under evolving financing conditions for energy technologies. Nat. Commun. 2026, 17.
71. Hernández C, Serrano González J, Fernández-Blanco R. New method to assess the long-term role of wind energy generation in reduction of CO2 emissions - case study of the European Union. J. Clean. Prod. 2019, 207, 1099-111.
72. Tang, R.; Yu, D.; Li, Y.; et al. Accelerating the global energy transition through carbon pricing: an ex-post analysis of emissions reduction effects and mechanisms based on international data. ENG. Manag. 2026, 13, 404-22.
73. Child, M.; Kemfert, C.; Bogdanov, D.; Breyer, C. Flexible electricity generation, grid exchange and storage for the transition to a 100% renewable energy system in Europe. Renew. Energy. 2019, 139, 80-101.
74. Brown, T.; Schlachtberger, D.; Kies, A.; Schramm, S.; Greiner, M. Synergies of sector coupling and transmission reinforcement in a cost-optimised, highly renewable European energy system. Energy 2018, 160, 720-39.
75. Zhao, Y.; Wang, M.; Sun, B.; Zhang, H.; Li, X. Assessing the dynamic interplay of policy, economic, and technological factors for sustainable recycling of decommissioned wind turbine blades in China: a system dynamics approach. Waste. Manag. 2026, 209, 115199.
76. Pehl, M.; Arvesen, A.; Humpenöder, F.; Popp, A.; Hertwich, E. G.; Luderer, G. Understanding future emissions from low-carbon power systems by integration of life-cycle assessment and integrated energy modelling. Nat. Energy. 2017, 2, 939-45.
77. IEA. The state of clean technology manufacturing: energy technology perspectives special briefing. 2023. https://iea.blob.core.windows.net/assets/0a421001-6157-436d-893c-c37eeab54967/TheStateofCleanTechnologyManufacturing.pdf (accessed 2026-8-28).
78. Mckenna, R.; Lilliestam, J.; Heinrichs, H. U.; et al. System impacts of wind energy developments: key research challenges and opportunities. Joule 2025, 9, 101799.
79. Yan, J.; Li, Y.; Wang, H.; Han, S.; Shang, W.; Liu, Y. Wind power forecasting based on large time series model. Engineering 2025.
Cite This Article
 Open Access
How to Cite
Download Citation
If you have the appropriate software installed, you can download article citation data to the citation manager of your choice. Simply select your manager software from the list below and click on download.
Export Citation File
Type of Import
Tips on Downloading Citation
Citation Manager File Format
Type of Import
Direct Import: When the Direct Import option is selected (the default state), a dialogue box will give you the option to Save or Open the downloaded citation data. Choosing Open will either launch your citation manager or give you a choice of applications with which to use the metadata. The Save option saves the file locally for later use.
Indirect Import: When the Indirect Import option is selected, the metadata is displayed and may be copied and pasted as needed.
About This Article
Copyright

Data & Comments
Data
0












Comments
Comments must be written in English. Spam, offensive content, impersonation, and private information will not be permitted. If any comment is reported and identified as inappropriate content by OAE staff, the comment will be removed without notice. If you have any queries or need any help, please contact us at [email protected].