



Process design and carbon footprint analysis of thraustochytrid biomass production using distillery wastewater
 0
0 
Abstract
An increasing global demand for omega-3 polyunsaturated fatty acids (PUFAs) necessitates the development of sustainable alternatives to traditional fish oil. Thraustochytrids, a group of marine protists, have emerged as a promising microbial source capable of producing high levels of PUFAs. However, the commercial viability of producing PUFA-rich thraustochytrid biomass often is hindered by high media costs. This study explores a sustainable process design using distillery wastewater (DWW) as a low-cost feedstock. A commercial-scale process of the thraustochytrid biomass (TB) production is simulated in DWSIM (a steady-state and dynamic sequential modular chemical process simulator) to establish a validated flowsheet. Mathematical validation is done by calculating the percentage error between the DWSIM simulation and the empirical bench-scale cell dry weight data. Based on the model’s material and energy balances, a comprehensive carbon footprint analysis is conducted to evaluate the environmental sustainability of the system. Analysis identified carbon footprint hotspots from electricity consumption, specifically for the freeze-dryer unit. Alternatives include replacement of the unit to a homogenizer for cell disruption, reducing the footprint to 4.16%, still below the desired 7.5% reduction target. Therefore, more emissions reduction options such as shifting to renewable energy should be explored. This DWSIM-based commercial-scale analysis addresses a critical knowledge gap in microbial PUFA production by quantifying unit operation resource intensities, identifying key environmental hotspots, and providing footprint-reduction strategies essential for translating thraustochytrid cultivation from laboratory to industrial scale.
Keywords
INTRODUCTION
The increasing global demand for Omega-3 polyunsaturated fatty acids (Omega-3 PUFAs), particularly eicosapentaenoic acid (EPA) and docosahexaenoic acid (DHA), has led to an urgent search for alternative, sustainable sources. The human body produces only low levels of these essential compounds, making dietary intake crucial for health and development, including the neural system, and in mitigating various pathological conditions[1]. Microbial oils, such as those extracted from thraustochytrids, have emerged as a promising option due to their high PUFA content and the possibility of sustainable production via fermentation methods[2,3]. To bridge this widening supply gap the industry explores heterotrophic microalgae and marine protists. Among these microorganisms, microbial oils extracted from thraustochytrids have emerged as an alternative due to their high PUFA accumulation capabilities and their capacity for rapid production via fermentation.
Thraustochytrids are marine protists known for producing high levels of polyunsaturated fatty acids (PUFAs), such as omega-3 and omega-6 fatty acids[4]. Certain strains of thraustochytrids, such as those found in Thraustochytrium and Aurantiochytrium species, have been shown to produce at least 50% of their biomass as lipids, with DHA accounting for at least 25% of total fatty acids[5]. Thraustochytrids are a promising alternative to marine fish oil due to their metabolic feature and the ability to produce PUFA-rich oils under controlled fermentation conditions, such as in bioreactors[2,6].
However, despite their potential, scaling up thraustochytrid cultivation from a controlled laboratory environment to commercial-scale is restricted by economics. In a standard laboratory setup, thraustochytrid cultivation uses refined, analytical-grade media. When scaled up to industrial bioreactors, these synthetic media inputs represent the dominant operating expense, undermining commercial viability and necessitating the exploration of cheap, locally abundant alternative feedstocks. Waste streams from the food processing industry are rich in carbon sources, proteins, and minerals, which are ideal for use as growth media for microorganisms[2,7-9]. Agro-industrial waste streams present an ideal opportunity to solve this economic bottleneck, as they are rich in accessible carbon, organic nitrogen, and minerals required to support high-density microbial fermentation.
Distillery wastewater is one type of industrial wastewater that may encourage the growth of thraustochytrids. A complex mixture of organic and inorganic components, including nitrogen, is present in distillery wastewater, a by-product produced during the production of alcohol in a distillery. It is distinguished by its high chemical and biological oxygen demands (COD and BOD)[10]. Repurposing this effluent as a cultivation medium simultaneously solves two industrial issues: it provides a cost-free nutrient base for thraustochytrid growth while functioning as a biological pre-treatment that lowers the wastewater’s final organic load. From previous studies, optimal conditions of thraustochytrid production has shown remarkable productivity.
Figure 1 depicts a keyword map based on a Scopus database search for the search term “thraustochytrid” from the year 2020 to 2025, where the search yielded 181 results. The size of the nodes indicates their frequency of occurrence. Three topic clusters based on content are shown in different colors: composition (green), microorganism application (red), and organism analysis (blue). The keyword “DHA production” appears in the blue cluster but is linked to all of the other thematic clusters. It is also smaller than other nodes, indicating that DHAs and PUFA production from thraustochytrids are a developing topic, which requires attention.
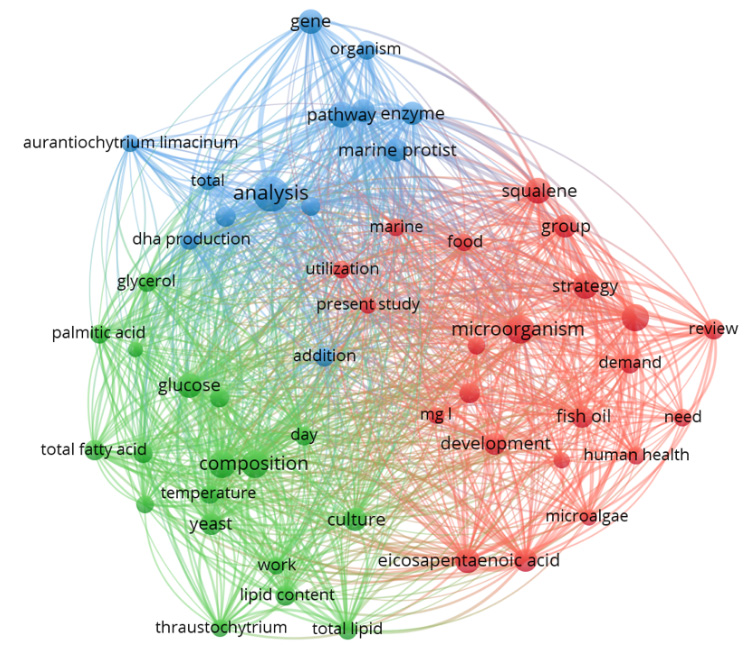
Figure 1. Keyword map of the literature on thraustochytrid production and development from 2020 to 2025.
Process simulation is a crucial tool in chemical and biochemical engineering, enabling a detailed understanding of physical processes and complex chemical reactions without the need for extensive and costly trial-and-error experiments. It facilitates the design of processes, identification of bottlenecks, and optimization of operating conditions. Furthermore, it plays a pivotal role in predicting the scale-up of laboratory results to industrial-level production[11,12]. DWSIM (developed by Daniel Wagner Oliveira de Medeiros) is highlighted in the sources as a comprehensive, open-source chemical process simulator that is gaining traction for both chemical and bioprocess simulations. By utilizing these simulators, engineers can scale up laboratory parameters to industrial baselines, providing the mass and energy data required to perform environmental sustainability assessments. The use of process simulation with carbon footprint accounting is crucial to prevent “burden-shifting”, a phenomenon where saving costs on a waste medium accidentally increases greenhouse gas emissions due to high electricity demands in downstream harvesting and dewatering units.
Environmental sustainability assessment through carbon footprint analysis has become increasingly critical for evaluating the commercial viability of microbial PUFA production systems. Life cycle assessment (LCA) has emerged as the primary tool for quantifying environmental impacts across the production chain, from feedstock cultivation to final product recovery[13]. McKuin et al. (2022) conducted a comprehensive LCA of heterotrophic Schizochytrium cultivation using commercial sugar feedstocks (sugarcane and sugar beets), where they identified sugar production as the dominant contributor to global warming potential, land use, and eutrophication impacts[14]. The combination of Schizochytrium and canola oil revealed trade-offs between different environmental indicators, where there is a significant decrease in marine biotic resource use but higher impacts in other categories. Similarly, Lee Chang et al. (2015) performed an
The literature review presents a knowledge gap in scaling up thraustochytrid biomass production from bench to commercial-scale. The specific energy hotspots and carbon intensities of individual commercial equipment remain unknown. This present study addresses this gap by integrating DWSIM-based commercial scale process simulation with carbon footprint intensity analysis, a graphical pinch analysis technique pioneered by Tjan et al. (2010), that decomposes total carbon footprint into material- and energy-based components, and further into internal and external source components[16]. By applying this carbon footprint intensity methodology to thraustochytrid biomass production using distillery wastewater, this work quantifies unit operation-specific carbon intensities, identifies environmental hotspots within the process flowsheet, and provides prioritized, cost-effective reduction strategies, thereby advancing both scale-up feasibility and environmental optimization of sustainable microbial PUFA production for aquaculture applications.
The key objective of this study is to optimize the production of thraustochytrid biomass (TB) in a bioreactor using distillery wastewater to produce a PUFA-rich aquafeeds product and to evaluate the environmental sustainability and improvement potential of a simulated commercial-scale process. Specifically, this research aims to simulate a commercial scale thraustochytrid biomass production process using DWSIM, perform a carbon footprint intensity analysis on the TB production process, and evaluate and screen process improvement alternatives.
METHODS
Inoculum preparation
The thraustochytrid isolate used in this study is Aurantiochytrium sp. SJB1AcBl1 is obtained from a mangrove swamp in Lian, Batangas, Philippines. The isolates are provided by the research group of the Department of Science and Technology - Philippine Council for Agriculture, Aquatic, and Natural Resources Research and Development (DOST-PCAARRD) funded project entitled “Thraustochytrid Cultivation in Wastewater for Polyunsaturated Fatty Acid Production as Alternative Fish Feed/Ingredient”. The isolates are cultured on GYPSA medium [10g/L glucose (CHEM-SUPPLY), 1.2g/L yeast extract (HIMEDIA), 1.2g /L peptone (HIMEDIA), 1,000 mL filtered 100% natural seawater or NSW, 10g/L agar] with antibiotics
The seed culture for inoculation is prepared in sterile GYPS (30 g/L glucose, 10 g/L yeast extract, 1.25 g/L peptone, 1,000 mL NSW). The broth is inoculated with 1% v/v thraustochytrid from old stock cultures and cultivated at 150 rpm for 2 days.
Cultivation using distillery wastewater for 5 L bioreactor runs
The general procedure of the bench scale experiment is based on the methods of dos Reis et al. (2024) with a few modifications[17]. The inoculum is created in a 500 mL flask with 200 mL of culture broth, prepared and cultivated according to the inoculum preparation section. To this, 2 L of adjusted DWW are added in the 5 L bioreactor vessel to operate in a batch system. The DWW characteristics are presented in Table 1. The process is non-axenic; thus, no sterilization is done beforehand to reduce costs in the process.
Distillery wastewater characteristics
| Parameter | Value |
| pH | 4.0 |
| Salinity (ppt) | 18 |
| Total organic carbon (mg/L) | 26,000 |
| Total nitrogen (mg/L) | 1,300 |
The inoculum (10% v/v) is added using flame ring inoculation. To mitigate foam formation, 0.5 mL of Antifoam B is added before cultivation, and also an automatic feeding of Antifoam B is also done to ensure foam generation is mitigated.
After 96 h of cultivation, the fermentation broth is harvested from the sampling port of the bioreactor, which is immediately processed through the Benchmark Scientific, C3100-E LC-8 3500 Centrifuge, China at a speed of 3,500 rpm for 8 min. The recovered biomass is washed twice using sterile distilled water at the same centrifuge conditions to remove residual medium components. The biomass is lyophilized using the table-top Martin Christ Gefriertrocknungsanlagen GmbH, Christ Beta 2-8 LSC Freeze-Dryer, Germany for 36 h. The procedure of lyophilization includes freezing for 1 h then drying for 35 h or until fully free from moisture. The total biomass yield is achieved by measuring the dry cell weight per volume of fermentation medium. Additionally, the wastewater is analyzed by its Chemical Oxygen Demand before and after thraustochytrid cultivation.
While the simulated cultivation process is modeled as non-axenic to eliminate sterilization costs, the simulation does not account for contamination risks or biological competition. In a physical bioreactor, thraustochytrids like Aurantiochytrium sp. SJB1AcBl1 can face competition from fast-growing bacterial or fungal strains in non-sterile wastewater. However, this risk is mitigated in the process design by two ways: (1) the rapid inoculation strategy (10% v/v), which gives the target strain a significant initial biomass advantage, and (2) the high salinity of the baseline medium (utilizing natural seawater), against standard freshwater wastewater bacteria.
Process design and scale-up
Process description
The TB production process consists of at least five units, which are the inoculum preparation, wastewater preparation, bioreactor, centrifuge, and the freeze-dryer as shown in Figure 2. The first unit operation from the process is wastewater pre-treatment through pH adjustment. Then, the adjusted DWW is mixed with the thraustochytrid seed culture in a bioreactor. The thraustochytrid seed culture is prepared in sterile GYPS media where it is inoculated with 10% v/v thraustochytrid from fresh stock cultures. The cultivation of thraustochytrid in DWW has a set agitation speed at 150 rpm in the reactor, which enhances thraustochytrid biomass yield. Afterwards, the DWW culture medium undergoes centrifugation to recover thraustochytrid biomass and is washed twice to remove media residue. Lastly, the TB moisture is removed using a freeze-dryer.
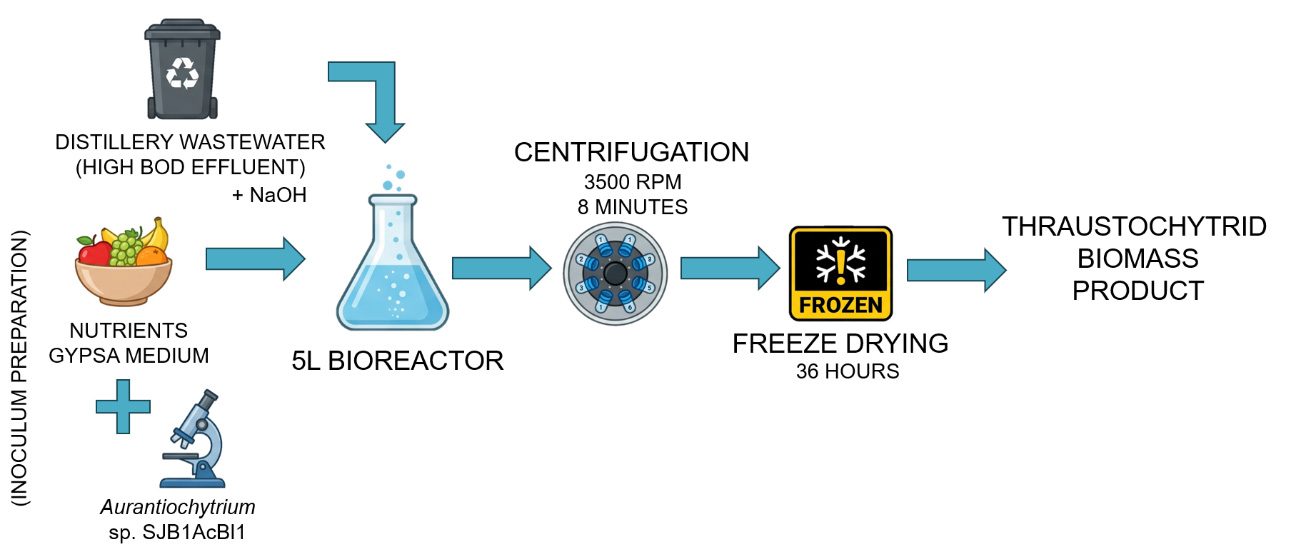
Figure 2. Simplified block diagram of TB production process. TB: Thraustochytrid biomass.
The first unit operation from the process is wastewater pre-treatment through pH adjustment. Then, the adjusted DWW is mixed with the thraustochytrid seed culture in a bioreactor. The thraustochytrid seed culture is prepared in sterile GYPS media where it is inoculated with 10% v/v thraustochytrid from fresh stock cultures. The cultivation of thraustochytrid in DWW has a set agitation speed at 150 rpm in the reactor which enhances thraustochytrid biomass yield. Afterwards, the DWW culture medium undergoes centrifugation to recover thraustochytrid biomass and is washed twice to remove media residue. Lastly, the TB moisture is removed using a freeze-dryer. The scale-up from the 5 L bench-scale bioreactor (2 L working volume) to a commercial-scale bioreactor is based on volumetric scaling with reference to commercially available equipment. A 2,000 L single-use bioreactor MilliporeSigma (2025) with a working volume of
The agitation speed for the commercial-scale simulation is determined by scaling the optimum bench-scale agitation speed to fit within the operating range of the MilliporeSigma/Merck, Mobius® iFlex 2,000 L Bioreactor, Germany (27-102 rpm). A scaling factor is applied based on the ratio of the maximum operating speeds between the commercial-scale (102 rpm) and bench-scale (300 rpm) bioreactors. The aeration rate is maintained at the same vessel volumes per minute as the optimized bench-scale conditions. Power consumption for agitation is calculated using Equation 1, with the impeller power number (Np = 3.7) and impeller diameter (D = 0.406 m) obtained from the equipment datasheet.
where:
P is power (W);
Np is the power number (dimensionless);
ρ is fluid density (kg/m3);
N is agitation speed (rps), and D is impeller diameter (m).
The simulation assumed that the percent conversion of glucose (based on COD reduction) and biomass yield (obtained by measuring the dry cell weight per volume of fermentation medium) coefficient from bench-scale optimization would remain constant at the commercial scale. This assumption represents an idealized scenario, as scale-up effects such as reduced mixing efficiency, oxygen transfer limitations, and increased heterogeneity in large vessels are not explicitly modeled.
DWSIM simulation development
During the pre-treatment stage, NaOH is used for pH adjustment to pH 7. TB includes PUFAs and other DWW components. The fatty acids assumed to be in TB are only the most abundant PUFAs based on experimental profiling of TB. The summary of components used for the simulation is listed on Table 2. The components that are not available in the DWSIM database is imported from JSON files to complete missing items.
Summary of chemical compounds to be used in the simulation
| Component | Chemical formula | Molecular weight (g/mol) |
| Distillery wastewater | ||
| Ethanol | CH3CH2OH | 46.07 |
| Xylose | C5H10O5 | 150.13 |
| Glucose | C6H12O6 | 180.16 |
| Sucrose | C12H22O11 | 342.30 |
| Formic acid | CH2O2 | 46.03 |
| Acetic acid | CH3COOH | 60.05 |
| Propionic acid | CH3CH2CO2H | 74.08 |
| Butyric acid | CH3CH2CH2COOH | 88.11 |
| Carbon dioxide | CO2 | 44.01 |
| Water | H2O | 18.02 |
| Wastewater pre-treatment | ||
| Sodium hydroxide | NaOH | 40.00 |
| Inoculuma | ||
| Biomassb | CH2.58O0.23N0.03 | 18.68 |
| Yeast extractc | - | 438 |
| Peptoned | CH1.57O0.31 N0.03S0.007 | 22.84 |
| Salt (from seawater) | NaCl | 58.44 |
| Compressed air | ||
| Oxygen | O2 | 32.00 |
| Nitrogen | N2 | 28.01 |
The general condition of each stream, current stages, component parameters, operating conditions, and property calculation method has been specified within the software’s stream conditions tab.
Unit operations
The process consists of only one reaction during the cultivation of thraustochytrids, which is modeled using a simplified stoichiometric growth equation to represent key nutrient requirements, is shown in Equation 2. The percent conversion in the cultivation reaction is based on experimental data.
To simplify the formation of biomass, only glucose is used to represent the carbon source and peptone as the nitrogen source for thraustochytrid consumption, while the product represents typical biomass composition[20]. The overall percent conversion of glucose is obtained from the percent reduction between the initial and final COD during thraustochytrid cultivation using Equation 3.
The inlet flow rates are scaled-up to match the required head for a 2,000 L industrial bioreactor. Since the default conversion reactors available in DWSIM had restrictions with the number of input and output streams[21], custom unit operations with Python scripts are added to simulate the fermentation process of having its feed constantly subjected to aeration.
The capture efficiency of biomass in centrifuge operations is 97.5%. The value is based on the centrifugal separation of microalgae particles dispersed in a culture medium when processed in a continuous feeding basket centrifuge[22].
Process model validation
To ensure the commercial-scale simulation is accurate, the process model is validated using the empirical bench-scale cell dry weight data. The simulation is based on data collected from the physical 5 L bench-scale bioreactor runs. The concentrations, initial COD reductions, and nutrient amounts (glucose, yeast extract, and peptone) from these pilot trials are multiplied by a scale-up factor of 500 to match a 1,000 L commercial working volume. The bioreactor fermentation is modeled using a simplified stoichiometric growth equation (Equation 2), fixing the cell yields to match the observations in the laboratory. To check the accuracy of the model, the total TB yield (g/L) is set as the validation parameter, since this value determines the overall material flow and carbon footprint of the downstream steps. The percentage error is calculated between the final DWSIM simulation results and the actual dry cell weight measured in the laboratory as shown in Equation 4. Following the standard chemical engineering practices, an error margin of 20% is set to confirm the model is reliable before using it to evaluate the carbon footprint and economic hotspots.
It is important to note that the DWSIM process simulation developed in this study is a deterministic baseline verification model. The primary objective is to validate the process operations based on bench-scale experimental runs.
System boundaries
In evaluating the environmental and economic impacts of utilizing DWW, a gate-to-gate system boundary approach is implemented. Under this approach, DWW is classified as a production waste stream and all environmental burdens and upstream processing costs from the distillery operations are cut off at the point of generation. This boundary choice is justified because DWW is an unavoidable secondary effluent that does not displace any primary market product. However, the system boundary strictly accounts for all post-generation burdens required to make the feedstock viable within the plant gate. While raw DWW enters at zero cost and footprint, the material consumption and environmental impacts associated with their subsequent in-plant pre-treatment, specifically the intensive pH adjustment using NaOH are fully quantified and integrated into the total process footprint.
Material and energy accounting
The total resource consumption is quantified in terms of material and energy components. Material inputs include DWW, pre-treatment reagents, and water, while energy consumption includes steam, cooling water, electricity, and diesel. The consumption rate for each component is extracted directly from the converged DWSIM simulation.
Moreover, the unit costs for each material and energy component are obtained from literature and industry data, relevant to the Philippine setting. The total daily cost for each component obtained is aggregated to determine the total material, energy, and overall daily production cost.
Carbon footprint inventory
For each material and energy component, there is an appropriate emission factor, in terms of kg CO2/unit, that is sourced from the Greenhouse Gas Protocol Emission Factor Guide[23] and other relevant literature. The footprint calculation for each component is obtained by multiplying its consumption rate by the emission factor. The individual footprints are summed up to establish the total carbon footprint for the entire process, expressed in kg CO2/day.
Carbon footprint intensity method
The carbon footprint intensity (CI) method is employed to identify the most impactful area for emission reduction by relating the carbon footprint with each component cost. Each category (material and energy) is calculated for CI, and whichever component has a higher ratio, it is the primary target for carbon footprint reduction efforts, as it represents the largest emission source per peso spent. A goal of 7.5% reduction from the total carbon footprint is set which is based on the Philippines’ commitment to reduce 75% of total greenhouse gas emission from 2020 to 2030[24].
To further pinpoint carbon footprint hotspots, the target component is disintegrated into internal (generated within the plant, e.g., water) and external (generated outside the plant, e.g., electricity) sources.
RESULTS AND DISCUSSION
Simulation results
The COD values of DWW before and after TB cultivation are presented in Supplementary Tables 1 and 2, while the summary of the yield results is presented in Supplementary Table 3. For the simulation, the resulting DWSIM flowsheet is found in Supplementary Figure 1. The biomass yield of the DWSIM-based simulated process is compared with the experimental results done in a pilot-scale 5 L bioreactor, is shown in Table 3.
Comparison of the process model’s biomass yield
| Reference | Biomass yield, g/L |
| Experimental run | 7.65 |
| Simulated run | 6.73 |
The comparison gave an error of 12.03%, which may be attributed to the difference in centrifuge split fractions due to the type of centrifuge used. The model may still be used since it is comparable with bench-scale processes and gives a percent difference of less than 20%.
Material and energy accounting
The simulated model in DWSIM is solved for the process’s material and energy balances. The unit cost of each material is obtained from market surveys and literature reviews. The computation for material and energy costing is shown in Tables 4-6.
Material cost analysis for TB production
| Material | Consumption, kg/day | Unit cost, Php/kg | Cost, Php/day |
| Distillery wastewater | 770.67 | 0 | 0 |
| Sodium hydroxide | 300 | 200 | 60,000.00 |
| Glucose | 1,440 | 3,100 | 4,464,000.00 |
| Yeast extract | 480 | 3,500 | 1,680,000.00 |
| Peptone | 60 | 3,500 | 210,000.00 |
| Seawater | 2,401.75 | 0 | 0 |
Energy cost analysis for TB production
| Energy | Consumption, unit/day | Unit cost, Php/unit | Cost, Php/day |
| Water (L) | 15,147.5 | 0.08 | 1,211.8 |
| Steam (kg) | 20 | 3.10 | 62.0 |
| Electricity (kWh) | 3,024.35 | 37.41 | 113,140.9 |
Summary of material and energy cost analysis for TB production
| Parameter | Value |
| Total cost of materials, Php/day | 6,414,000.00 |
| Total cost of energy, Php/day | 114,414.73 |
| Total cost of the process, Php/day | 6,528,414.73 |
| Mass flow rate of TB product, kg/day | 164.96 |
| Price of TB produced, Php/g | 39.58 |
As shown in Table 4, while the utilization of DWW eliminates raw water and baseline medium costs, the cost is still heavily sensitive to the supplements: glucose, yeast extract, and peptone. This current study reflects a conservative benchmark scenario based on unoptimized laboratory-scale parameters designed to ensure maximum cellular growth. However, in an optimized industrial bioreactor cluster, these commercial supplements may be substituted for more cost-effective raw materials[25]. Future process configurations may implement other strategies by blending DWW with other high-carbon raw materials, such as sugarcane molasses or coconut water, and utilizing localized nitrogen sources like spent brewer’s yeast to minimize dependency on the current analytical-grade components.
Material cost analysis showed that having a low-cost substrate for cultivating thraustochytrids can significantly reduce the cost of TB production. Anticipated expenses for consuming distillery wastewater are only on transportation and storage, however, in this preliminary analysis, the wastewater provides no cost. On the other hand, electricity garners the bulk of the energy cost. This is due to the use of high-cost equipment such as a centrifuge and a freeze-dryer, which consume 245.73 kWh and 480 kWh, respectively.
Table 7 shows the indicative price of selected feed ingredients in the Philippines with comparison to the TB product. The total TB product price is estimated to be Php 39.58 per gram, which is higher compared to the current prices of the bulk feed ingredients in the Philippines. This cost analysis is preliminary and includes only laboratory grade material and energy costs. Capital expenditure, labor, maintenance, depreciation, quality control, packaging, storage, transportation, and other overhead costs are not included. Currently, the price is not yet competitive. However, these figures must be contextualized by the product’s ultimate application: TB is not intended to replace bulk feed, but rather as a premium, high-value nutrient additive. Because it serves as a concentrated source of essential omega-3 fatty acids and high-quality protein, TB only needs to be blended into ordinary feeds in small quantities. The current study presents the potential for optimizing the price of TB as an omega-3 fatty acid as a protein source that can be added to ordinary feeds as nutrient additive.
Comparison of the indicative price of selected feed ingredients in the Philippines adjusted for inflation[26]
| Feedstuff/additive | Source/type | Cost, Php/kg |
| Cassava meal | Local | 49.70-58.34 |
| Copra meal | Local | 17.29-28.09 |
| Corn | Local | 45.38-58.34 |
| Corn bran | Local | 38.90-41.06 |
| Corn grits | Local | 58.34-66.99 |
| Fish meal | Local (tuna) | 71.31-77.79 |
| Local | 49.70-99.40 | |
| Peru | 99.40-140.46 | |
| Meat and bone | Australia | 86.43-103.72 |
| Rice bran, D1 | Local | 2.16-56.18 |
| Soybean oil meal | US | 58.34-77.79 |
| China | 58.34-71.31 | |
| Tallow oil | Imported | 79.95-82.11 |
| Wheat pollard | Local (from imported grains) | 34.57-38.90 |
| Wheat | Local (from imported grains) | 60.50-64.83 |
The economic analysis reveals a major discrepancy between the free feedstock and the expensive supplements required by the process. While using DWW successfully eliminates baseline substrate costs, adding commercial glucose, yeast extract, and peptone to the medium accounts for 99.07% of the total daily material expenses (6,354,000 Php/day out of 6,414,000 Php/day). This shows that the economic success of this waste-to-value biorefinery is limited not by the wastewater itself, but by the expensive nutrients needed to optimize cell growth[27]. With regards to energy consumption, electricity dominates the utility expenses, making up 98.93% of total energy costs. This concentration of expense creates a major operational bottleneck caused by high-energy equipment.
Carbon footprint inventory
The available carbon footprint (CF) for each component is calculated from literature values of the emission factor. The computation of the carbon footprint analysis for the material and energy components is shown in Tables 8-10.
Material carbon footprint analysis for TB production
| Material | Consumption, kg/day | Emission factor, kg CO2/kg | Carbon footprint, kg CO2/day |
| Distillery wastewater | 770.67 | 0 | 0 |
| Sodium hydroxide | 300 | 1.12* | 336 |
| Glucose | 1,440 | 1.05* | 1,512 |
| Yeast extract | 480 | 3.34* | 1,603.2 |
| Peptone | 60 | 7.11* | 426.6 |
| Seawater | 2,401.75 | 0 | 0 |
Energy carbon footprint analysis for TB production
| Energy | Consumption, unit/day | Emission factor, kg CO2/unit | Carbon footprint, kg CO2/day | Reference |
| Water (L) | 15,147.5 | 0.00038 | 5.75605 | Shimizu et al. (2012)[29] |
| Steam (kg) | 20 | 0.23 | 4.6 | U.S. Environmental Protection Agency (2024)[30] |
| Electricity (kWh) | 3,024.35 | 0.69 | 2,086.8015 | Climate Transparency (2020)[31] |
Summary of material and energy carbon footprint analysis for TB production
| Parameter | Value |
| Total CF of materials, kg CO2/day | 3,877.80 |
| Total CF of energy, kg CO2/day | 2,097.16 |
| Total CF of the process, kg CO2/day | 5,974.96 |
The solids contributing to the carbon footprint that are used for pretreatment and inoculum preparation is based mostly on its production process and transportation emissions. In correlation to the cost, components with high cost emit larger carbon footprints. The largest contributor to the process’s CF is electricity consumption. The Philippines is still heavily reliant on coal for its electricity production, comprising of 52% from the Philippine energy mix in 2018, totaling of 691 g CO2 e/kWh[31]. Efforts to switch to renewable energy sources and promoting low-carbon activities can ensure corporate sustainability to lessen emissions from product generation.
Carbon footprint intensity analysis
The carbon footprint composite curves are plotted from the material- and energy-based footprints against the corresponding costs of the overall process. The demand curve is based on the goal of 7.5% reduction from the total carbon footprint, corresponding to 0.45 t CO2/day.
As shown in Figure 3A, the material-based CF (3,877.80 kg CO2/day) is higher compared to the energy-based CF (2,097.16 kg CO2/day), the carbon intensity of the energy segment is much higher than the material segment, as represented by their slopes. To formulate an emission mitigation plan, the study must focus on the energy segment. Figure 3B compares the composite curves based on the internal (water and steam) and external (electricity) sources of energy.
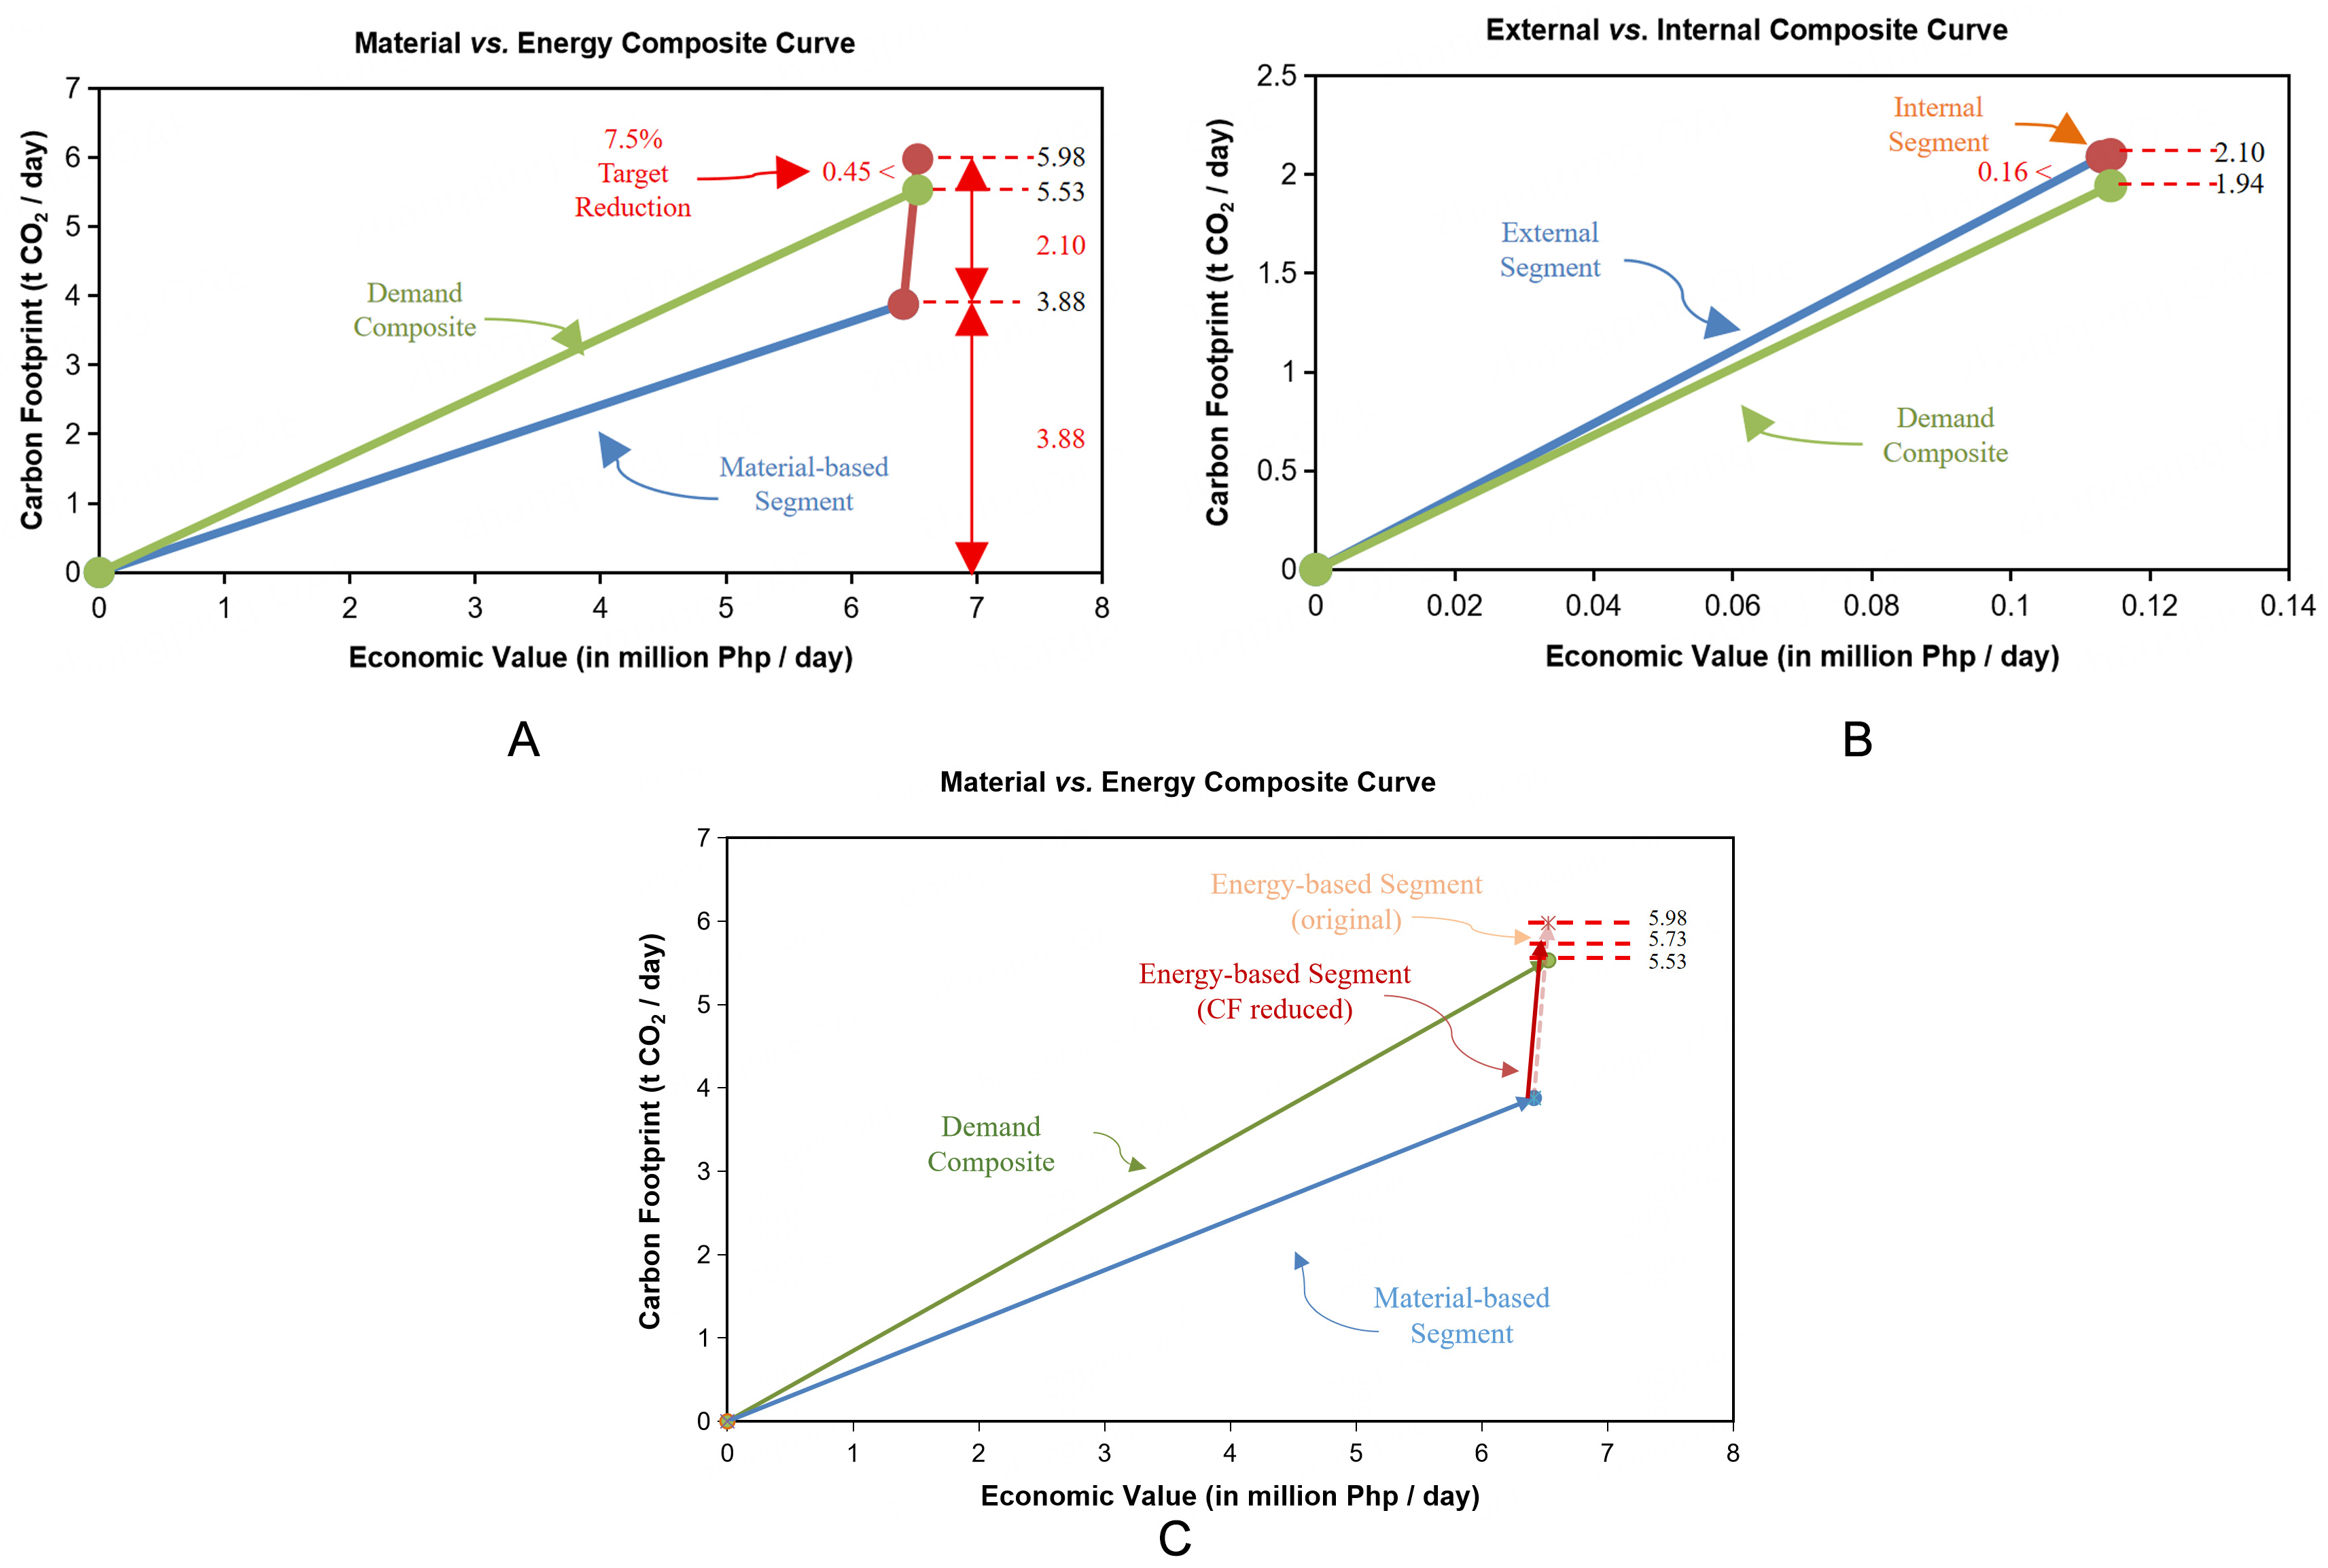
Figure 3. The carbon footprint composite curves are plotted from the material- and energy-based footprints against the corresponding costs of the overall process. (A) Material vs. Energy Composite Curve of the TB Process; (B) Internal vs. External Energy Composite Curve of the TB Process; (C) Material vs. Energy Composite Curve of the Modified TB Process. TB: Thraustochytrid biomass.
The resulting plot demonstrates that the entire source composite curve is positioned above the demand composite curve. However, adjusting the internal segment alone cannot achieve the carbon intensity target since the external footprint already exceeds this threshold. Instead, reducing the external segment’s gradient through low-carbon electricity sources presents a more viable approach to meet the reduction of electricity supply to 1.94 t CO2/day.
The proposed carbon footprint reduction strategy to lower electricity consumption is to replace the freeze-dryer with a high-speed industrial homogenizer for cell disruption in preparation for oil extraction. This approach produces a less dried product; however, this may lead to a much moist product. Aurantiochytrium sp. wet biomass is processed using a high-speed homogenizer to disrupt cells and extract lipids simultaneously, where 80% of the lipids are removed in 10 min at a speed of 15,000 rpm[32]. Since the TB product aims to be a feed additive, the moisture of the product will not matter as it is subjected to further processing. The homogenizer is expected to require 120 kWh of power, a significant drop from the power requirement of the freeze-dryer at 480 kWh. This substitution had a total of 4.16% of the total carbon footprint reduced, achieving the desired 7.5% reduction as shown in Figure 3C and Table 11.
Comparison of freeze-dryer and homogenizer unit operation in TB production
| TB process cell disruption | Cost, MPhp/day | CF, t CO2/day |
| Freeze-dryer | 6.53 | 5.98 |
| Homogenizer | 6.45 | 5.73 |
| Reduction, % | 1.25 | 4.16 |
The process generates a total carbon footprint of 5,974.96 kg CO2/day, from supply chain emissions and direct electricity use. The material segment accounts for 3,877.80 kg CO2/day, which represents the embodied carbon footprint from manufacturing glucose and peptone. In contrast, the energy segment accounts for 2,097.16 kg CO2/day and represents the active operational carbon footprint. This operational impact is heavily multiplied by the local energy mix. Because the Philippine national grid relies on coal for over 52% of its power generation[31], high-energy equipment directly causes intense carbon emissions. Using the CI method, the steeper slope of the energy segment proves that emissions reduction efforts must focus on cutting electricity use rather than changing materials. This target justifies replacing the energy-intensive freeze-dryer with a mechanical homogenizer. This strategy improves the overall carbon footprint of the process.
However, replacing the freeze-dryer with a mechanical homogenizer changes the final product to a wet thraustochytrid biomass paste rather than a stable, shelf-ready dry feed pellet. Mechanical homogenization via the industrial high-speed homogenizer is intended as a low-energy upstream cell disruption mechanism to maximize the polyunsaturated fatty acid (PUFA) for aquaculture species[33]. While this unit operation does not reduce moisture content for extended shelf life, the resulting wet paste is targeted directly for immediate, localized blending within an integrated or nearby aquafeed manufacturing facility.
Study limitations
This study assumes an idealized scale-up from the 5 L bench-scale bioreactor to the 1,000 L commercial reactor and is modeled using a simplified, deterministic volumetric scaling approach. The model does not dynamically account for real-world bioreactor constraints such as oxygen transfer limitations, gas-liquid mass transfer gradients, mixing time delays, and impeller shear stress. The model also assumes stable culture growth and uses a fixed stoichiometric growth equation based on optimized laboratory parameters to calculate conversion metrics. It does not consider variations, time-dependent microbial population kinetics, and contamination. The system boundary assumed in the study for the mass and energy balances is gate-to-gate, the DWW enters at zero cost and footprint.
For the process change recommendation, switching from a freeze-dryer to a homogenizer results in 4.16% operational energy reduction within the plant gate, there is a trade-off downstream. The resulting product is a wet biomass paste rather than a dry powder. The shelf-life stabilization and thermal dewatering burdens required for long-term storage following the recommendation are excluded from the scope of this study. The economic costing performed in this study serves as a preliminary evaluation focused exclusively on operational energy and material consumption. It excludes capital expenditures (CAPEX), labor, maintenance, equipment depreciation, etc. In addition, the baseline economic and environmental viability assumes an integrated biorefinery or co-location of the plant to justify a zero-cost and zero-footprint transport for the raw distillery wastewater effluent. The costs used in this study is based on the actual costs from the laboratory scale. It is expected that the costs will decrease when the economies of scale is applied.
CONCLUSION
The simulated TB production process provided a crucial baseline assessment for developing a sustainable and commercially viable process for producing omega-3 PUFA from thraustochytrid using distillery wastewater. Carbon footprint intensity analysis determined emissions from electricity consumption, specifically for the freeze-dryer unit contribute the most carbon footprint in this process. Recommending an alternative cell disruption method through a homogenizer decreased energy-based carbon footprint by 4.16%, below the desired 7.5% carbon footprint reduction. Hence, exploration of other emissions reduction measures to bridge the target emissions reduction gap is recommended. While these initial findings need more experimental testing, this model serves as a practical first step for evaluating sustainable microbial alternatives to traditional fish oil.
Future research should address experimental validation of the DWSIM simulation model at a pilot scale, particularly for the proposed homogenizer-based cell disruption alternative. Given that the downstream process of TB production contributes largely to the carbon footprint, optimization of downstream processing alternatives should be explored to identify energy-efficient TB recovery methods. While this study establishes a baseline using standard media supplements, future work may explore optimizing the media and replacing commercial glucose and peptone entirely with secondary regional organic wastes, to fully realize the economic and environmental value proposition of waste-driven thraustochytrid biorefineries. Lastly, integration of the process design and carbon footprint methodology to other wastewater treatment processes would promote zero-liquid discharge for other food and beverage industries, leading to a more sustainable microbial omega-3 production.
DECLARATIONS
Authors’ contributions
Conceptualization, investigation, data curation, formal analysis, writing - original draft: Ignacio, J. E.
Methodology, Validation, Writing - review and editing: Capunitan, J. A.
Methodology, Supervision, Writing - review and editing: Migo-Sumagang, M. V.
Availability of data and materials
The data supporting the findings of this study are presented in this manuscript and Supplementary Materials.
AI and AI-assisted tools statement
During the preparation of this manuscript, the AI tool Grammarly (version 14.1302.0, released 2026-06-12) was used solely for language editing. Gemini (version 3.1, released 2026-02-19) was used to reformat the references and generate the icons for the waste bin, flask, fruit bowl, microscope, notebook, stack of coins, graph with arrow pointed upward, cloud with CO2, frozen sign, and homogenizer. The tool did not influence the layout of the graphics. In addition, the tools did not influence the study design, data collection, analysis, interpretation, or the scientific content of the work. All authors take full responsibility for the accuracy, integrity, and final content of the manuscript.
Financial support and sponsorship
The authors would like to acknowledge the Department of Science and Technology - Philippine Council for Agriculture, Aquatic, and Natural Resources Research and Development (DOST-PCAARRD) funded project entitled “Thraustochytrid Cultivation in Wastewater for Polyunsaturated Fatty Acid Production as Alternative Fish Feed/Ingredient” for supporting this research.
Conflicts of interest
Migo-Sumagang, M. V. is the Guest Editor of the Special Topic “Systems Engineering Approaches for Carbon Footprint Reduction” in the Carbon Footprints. She had no involvement in the review or editorial process of this manuscript, including but not limited to reviewer selection, evaluation, or the final decision, while the other authors have declared that they have no conflicts of interest.
Ethical approval and consent to participate
Not applicable.
Consent for publication
Not applicable.
Copyright
© The Author(s) 2026.
Supplementary Materials
REFERENCES
1. Oliver, L.; Dietrich, T.; Marañón, I.; Villarán, M. C.; Barrio, R. J. Producing omega-3 polyunsaturated fatty acids: a review of sustainable sources and future trends for the EPA and DHA market. Resources 2020, 9, 148.
2. Du, F.; Wang, Y. Z.; Xu, Y. S.; et al. Biotechnological production of lipid and terpenoid from thraustochytrids. Biotechnol. Adv. 2021, 48, 107725.
3. Patel, A. K.; Chauhan, A. S.; Kumar, P.; et al. Emerging prospects of microbial production of omega fatty acids: recent updates. Bioresour. Technol. 2022, 360, 127534.
4. Morabito, C.; Bournaud, C.; Maës, C.; et al. The lipid metabolism in thraustochytrids. Prog. Lipid. Res. 2019, 76, 101007.
5. Raghukumar, S. Thraustochytrid marine protists: production of PUFAs and other emerging technologies. Mar. Biotechnol. 2008, 10, 631-40.
6. Aasen, I. M.; Ertesvåg, H.; Heggeset, T. M.; et al. Thraustochytrids as production organisms for docosahexaenoic acid (DHA), squalene, and carotenoids. Appl. Microbiol. Biotechnol. 2016, 100, 4309-21.
7. Athenaki, M.; Gardeli, C.; Diamantopoulou, P.; et al. Lipids from yeasts and fungi: physiology, production and analytical considerations. J. Appl. Microbiol. 2018, 124, 336-67.
8. Kothri, M.; Mavrommati, M.; Elazzazy, A. M.; Baeshen, M. N.; Moussa, T. A. A.; Aggelis, G. Microbial sources of polyunsaturated fatty acids (PUFAs) and the prospect of organic residues and wastes as growth media for PUFA-producing microorganisms. FEMS. Microbiol. Lett. 2020, 367, fnaa028.
9. Pleissner, D.; Lin, C. S. K. Valorisation of food waste in biotechnological processes. Sustain. chem. Process. 2013, 1, 20.
10. Krishnamoorthy, S.; Premalatha, M.; Vijayasekaran, M. Characterization of distillery wastewater - An approach to retrofit existing effluent treatment plant operation with phycoremediation. J. Clean. Prod. 2017, 148, 735-50.
11. Kasprzak, J. Development of process configurations and simulation of biobutanol production using DWSIM. Master’s Thesis, Royal Military College of Canada, Kingston, ON, 2024. https://espace.rmc.ca/jspui/handle/11264/1903 (accessed 2026-01-25).
12. Moliner, C.; Carozzo, V.; Curti, M.; Arato, E. Simulation and experimental validation of biomass gasification in a spouted bed reactor: troubleshooting using dwsim. Syst. Control. Trans. 2025, 4, 271-5.
13. Jacquemin, L.; Pontalier, P.; Sablayrolles, C. Life cycle assessment (LCA) applied to the process industry: a review. Int. J. Life. Cycle. Assess. 2012, 17, 1028-41.
14. Mckuin, B. L.; Kapuscinski, A. R.; Sarker, P. K.; et al. Comparative life cycle assessment of heterotrophic microalgae Schizochytrium and fish oil in sustainable aquaculture feeds. Elem. Sci. Anthr. 2022, 10, 00098.
15. Lee Chang, K. J.; Rye, L.; Dunstan, G. A.; et al. Life cycle assessment: heterotrophic cultivation of thraustochytrids for biodiesel production. J. Appl. Phycol. 2015, 27, 639-47.
16. Tjan, W.; Tan, R. R.; Foo, D. C. A graphical representation of carbon footprint reduction for chemical processes. J. Clean. Prod. 2010, 18, 848-56.
17. dos Reis, G. A.; Orozco, Colonia. B. S.; Martínez-Burgos, W. J.; et al. Sustainable omega-3 lipid production from agro-industrial by-products using thraustochytrids: enabling process development, optimization, and scale-up. Foods 2024, 13, 3646.
18. Mobius® iFlex Bioreactor. Data sheet. MilliporeSigma. https://www.merckmillipore.com/deepweb/assets/sigmaaldrich/marketing/global/documents/417/331/ds12340en-mobius-iflex-bioreactor-datasheet-ms.pdf (accessed 2026-01-25).
19. Sen, B.; Li, J.; Lu, L.; Bai, M.; He, Y.; Wang, G. Elemental composition and cell mass quantification of cultured thraustochytrids unveil their large contribution to marine carbon pool. Mar. Drugs. 2021, 19, 493.
20. Roels, J. A. Application of macroscopic principles to microbial metabolism. Biotechnol. Bioeng. 1980, 22, 2457-514.
21. Sreemahadevan, S.; Sivakumar, K. V.; Palanisamy, M. Evaluation of the open source process simulator DWSIM for bioprocess simulation. Period. Polytech. Chem. Eng. 2024, 68, 195-202.
22. Disconzi, F. P.; Borghi, F. T. Modeling, simulation, and optimization of the centrifugal separation of a microalgae-culture medium mixture. Biomass. Bioenergy. 2020, 143, 105871.
23. Calculation tools and guidance. Greenhouse gas protocol. https://ghgprotocol.org/calculation-tools-and-guidance (accessed 2026-01-25).
24. Philippines country climate development report. The World Bank Group. https://thedocs.worldbank.org/en/doc/4ec3282919652f7545bc25c49c1811e4-0070012022/original/PHCCDR-FINAL-formatted.pdf (accessed 2026-01-25).
25. Li, X.; Yu, X.; Liu, Q.; Zhang, Y.; Wang, Q. Lipid production of schizochytrium sp. HBW10 Isolated from coastal waters of northern China cultivated in food waste hydrolysate. Microorganisms 2023, 11, 2714.
26. Cruz, P. S. Aquaculture feed and fertilizer resource atlas of the philippines. FAO Fisheries Technical Paper, vol. M-44; Food and Agriculture Organization of the United Nations, 1997. https://www.fao.org/4/w6928e/w6928e00.htm (accessed 2026-01-25).
27. He, Y.; Zhu, X.; Ning, Y.; Chen, X.; Sen, B.; Wang, G. Saturated and polyunsaturated fatty acids production by aurantiochytrium limacinum PKU#Mn4 on enteromorpha hydrolysate. Mar. Drugs. 2023, 21, 198.
28. ClimateHub. Explore Climate Footprints. https://apps.carboncloud.com/climatehub/ (accessed 2026-01-25).
29. Shimizu, Y.; Dejima, S.; Toyosada, K. The CO2 emission factor of water in Japan. Water 2012, 4, 759-69.
30. Emission factors for greenhouse gas inventories. U.S. Environmental Protection Agency. https://www.epa.gov/system/files/documents/2024-02/ghg-emission-factors-hub-2024.pdf (accessed 2026-01-25).
31. Philippines, country profile 2020. Climate transparency. https://www.climate-transparency.org/wp-content/uploads/2021/01/Philippines-CT-2020.pdf (accessed 2026-01-25).
32. Corrêa, P. S.; Morais Júnior, W. G.; Martins, A. A.; Caetano, N. S.; Mata, T. M. Microalgae biomolecules: extraction, separation and purification methods. Processes 2021, 9, 10.
Cite This Article
 Open Access
How to Cite
Download Citation
Export Citation File:
Type of Import
Tips on Downloading Citation
Citation Manager File Format
Type of Import
Direct Import: When the Direct Import option is selected (the default state), a dialogue box will give you the option to Save or Open the downloaded citation data. Choosing Open will either launch your citation manager or give you a choice of applications with which to use the metadata. The Save option saves the file locally for later use.
Indirect Import: When the Indirect Import option is selected, the metadata is displayed and may be copied and pasted as needed.
About This Article
Special Topic
Copyright

Data & Comments
Data
0











Comments
Comments must be written in English. Spam, offensive content, impersonation, and private information will not be permitted. If any comment is reported and identified as inappropriate content by OAE staff, the comment will be removed without notice. If you have any queries or need any help, please contact us at [email protected].