

Carbon trading and corporate climate risk absorption measured from disclosure in China
 0
 ,
Graphical Abstract
Abstract
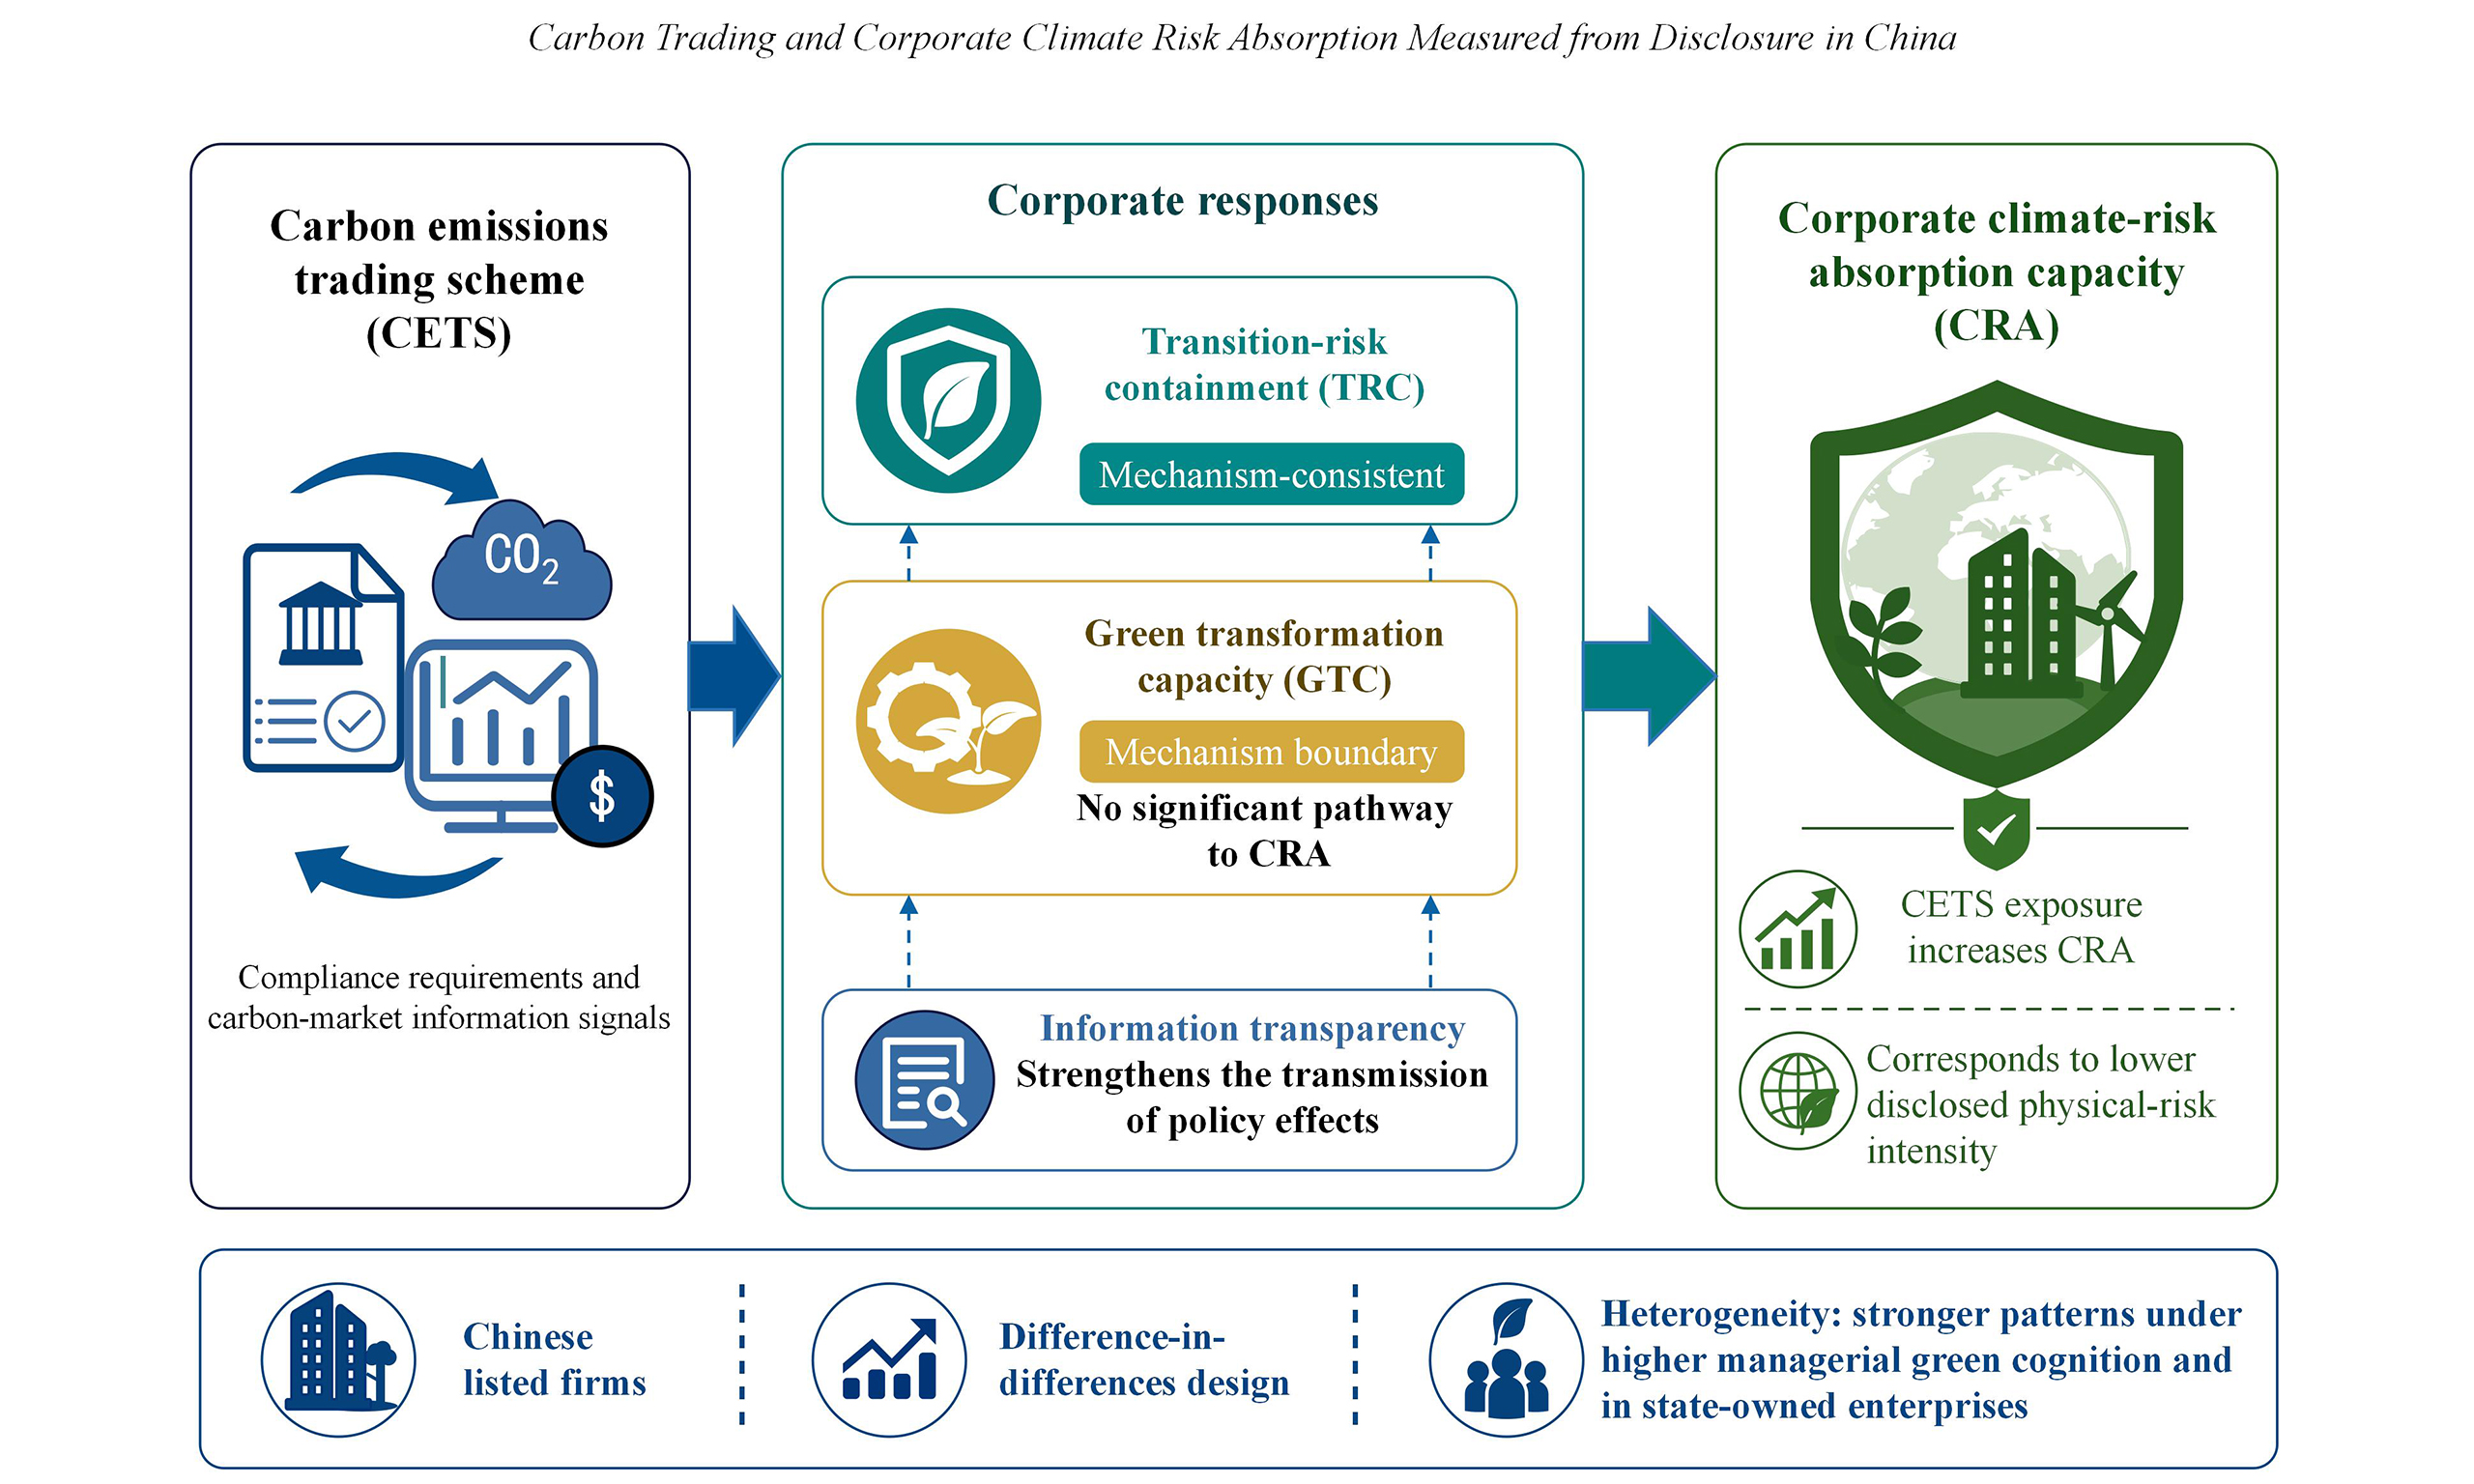
Carbon markets are primarily designed to reduce greenhouse-gas emissions, yet their relationship with corporate physical climate-risk signals remains insufficiently understood. This study examines whether exposure to China’s regional carbon markets is associated with corporate climate-risk absorption capacity (CRA). CRA is constructed as the sign-reversed standardized log-transformed intensity of physical climate-risk language in corporate annual reports. Using panel data for Chinese listed firms and a difference-in-differences design based on the staggered launch of regional carbon markets, we find that carbon-market exposure is associated with a higher CRA measure. Transition-risk containment provides evidence consistent with a potential mechanism, whereas improvements in green transformation capacity do not form a significant transmission channel. Information transparency strengthens the relationship between carbon-market exposure and CRA. Subgroup estimates are positive in both managerial-green-cognition groups and more pronounced among state-owned enterprises. Overall, the findings extend carbon-market evaluation beyond conventional mitigation outcomes and provide empirical evidence for the further conceptual development of a corporate climate-resilience footprint (CRF).
Keywords


 Download PDF
INTRODUCTION
Climate change is increasingly transmitted to firms through heat, floods, storms, droughts, wildfires, and compound disruptions that affect labor productivity, asset integrity, electricity supply, transport, logistics, and production networks. Adaptation is therefore a core condition for the continuity and recovery of economic systems. Nevertheless, global adaptation finance remains far below estimated needs, and private investment is constrained because avoided losses, service continuity, and adaptive capacity are difficult to measure and rarely create immediate cash flows[1,2]. Corporate adaptation is further impeded by incomplete risk information and short decision horizons[3,4]. Recent international evidence confirms that private adaptation investment is growing but remains uneven across firms, sectors, and hazards[5].
Carbon finance provides a potentially scalable bridge between mitigation and resilience. Carbon taxes, emissions trading systems, carbon crediting and carbon-linked financial contracts create price signals and cash flows around verified emissions outcomes. These mechanisms already mobilize substantial financial resources, but most were designed to reduce emissions rather than to finance adaptation[6]. Revenue recycling can improve the political durability and distributional performance of carbon pricing, and climate-policy packages can generate broader development benefits when revenues and complementary investments are well targeted[7,8]. The unresolved design question is whether carbon-market incentives can improve firms’ resilience before any explicit earmarking of revenues, and what information and governance conditions are required to convert a mitigation instrument into an adaptation-relevant financial signal.
Recent international discussions, including those surrounding the 30th Conference of the Parties (COP30), have broadened the carbon-finance agenda beyond industrial emissions trading toward land-use and nature-based crediting. In Southeast Asia, particularly Indonesia and Malaysia, attention has increasingly focused on carbon-finance arrangements involving tropical forests and perennial crops. A recent review discusses carbon-crediting opportunities for tropical forests and crops[9]. Related research examines the environmental sustainability of major vegetable-oil crops[10] and the conditions for securing Indonesian oil-palm smallholder livelihoods without further deforestation[11]. These studies provide complementary context; they do not establish that carbon credits necessarily improve smallholder livelihoods. At the same time, forest-carbon markets face substantial measurement and baseline uncertainty, making credible monitoring, reporting and verification, additionality, and uncertainty treatment central to market integrity[12]. These developments reinforce a general lesson relevant to corporate carbon markets: a financial or market signal should not itself be treated as verified evidence of the underlying environmental or resilience outcome it is intended to support.
Existing research establishes that emissions trading can reduce emissions, redirect innovation and influence firm performance. Evidence from the European Union Emissions Trading System shows measurable emissions reductions and directed low-carbon technological change[13,14]. Studies of China similarly find induced innovation, productivity effects and important consequences of market rollout design[15-18]. However, this literature mainly evaluates abatement, green innovation, productivity, financial performance or environmental disclosure. It seldom asks whether carbon pricing changes firms’ ability to absorb physical climate shocks. This omission matters because mitigation performance and resilience are related but non-equivalent: a firm can reduce emissions without protecting critical assets and supply chains, while some adaptation measures may increase near-term energy use or embodied carbon.
A growing climate-finance literature measures firm-level exposure and shows that climate risks affect investor decisions, financing conditions, and corporate risk management[19-21]. Organizational research further emphasizes that resilience depends on anticipatory capabilities, slack resources, learning, and the ability to reconfigure operations before and after disruptions[22,23]. Recent firm-level evidence shows that adaptation responses vary with the salience of physical exposure, managerial perception, organizational capability, and planning horizon[24]. Yet causal evidence on whether a carbon market builds these capabilities is scarce. Three mechanisms are especially relevant: transition-risk containment (TRC), green transformation capacity (GTC), and information transparency (Transparency).
Measurement is central to this research question. Adaptation indicators frequently track plans, spending, or installed measures rather than reduced vulnerability, continuity, recovery, or avoided damage; targets, time horizons, and data sources are often missing[25,26]. Corporate disclosure is scalable, but it is not equivalent to verified adaptation performance. Recent evidence shows that adaptation-and-resilience disclosure remains particularly sparse for risks, metrics, and targets and should be combined with other data sources[27]. Firm-level climate-risk signals have been measured using earnings-call text[19] and Chinese corporate annual reports[28]. Building on this approach, we construct corporate climate-risk absorption capacity (CRA) as the sign-reversed standardized log-transformed intensity of physical-climate-risk language in firms’ annual reports. Higher CRA therefore denotes a lower normalized intensity of disclosed physical-climate-risk language under the measurement convention used in this study.
Importantly, CRA is a disclosure-based indicator. It does not directly observe hazard probability, asset-level exposure, engineering vulnerability, business interruption, recovery time, or avoided losses. A higher CRA may be consistent with lower underlying exposure or stronger risk management, but it may also reflect differences in reporting strategy, disclosure composition, or managerial attention. Accordingly, the empirical results are interpreted as changes in the disclosure-based CRA measure rather than as direct evidence of realized physical resilience. This distinction also motivates the conceptual discussion later in the paper of what a more complete, asset-level climate-resilience footprint would require.
China offers a useful quasi-experimental setting. The National Development and Reform Commission of China (NDRC) designated seven regional carbon-emissions-trading pilots in late 2011[29]. Although the pilots were authorized earlier, active trading began at different times across jurisdictions. In the province-level data used in this study, Beijing, Tianjin, Shanghai, and Guangdong (including Shenzhen) enter treatment in 2013, Hubei and Chongqing in 2014, and Fujian in 2016. This staggered rollout provides cross-sectional and temporal variation in firms’ exposure to operating regional carbon markets. National rules later formalized allowance allocation, trading, emissions reporting, verification, and compliance arrangements[30]. The corporate information environment evolved alongside carbon-market development: annual reports provide a consistent longitudinal source for firm-level risk language, and recent Chinese evidence shows that environmental regulation can affect corporate climate-risk disclosure[31]. This institutional combination makes China useful for studying how carbon-market policy exposure is associated with disclosure-based climate-risk signals while keeping disclosure distinct from independently verified physical-resilience outcomes.
This study makes three main contributions. First, it extends the evaluation of emissions-trading policies beyond conventional mitigation outcomes by examining a disclosure-based firm-level indicator of physical climate risk. Rather than treating annual-report language as a direct measure of realized resilience, the study explicitly defines the empirical boundary of CRA and distinguishes the disclosed physical-risk signal from verified operational outcomes. Second, it examines coefficient patterns involving carbon-market exposure, transition-risk containment, green transformation capacity, and information transparency. This comparison helps distinguish a mechanism consistent with improved risk governance from a mitigation-oriented productivity pathway that does not automatically translate into the CRA measure. Third, the study describes subgroup patterns in corporate responses and connects the Chinese evidence to the broader international discussion on carbon finance, information integrity, and adaptation. Building on the empirical limitations identified here, the Discussion further outlines a corporate climate-resilience footprint as a conceptual direction for future asset-level measurement. Figure 1 summarizes the conceptual and empirical workflow.
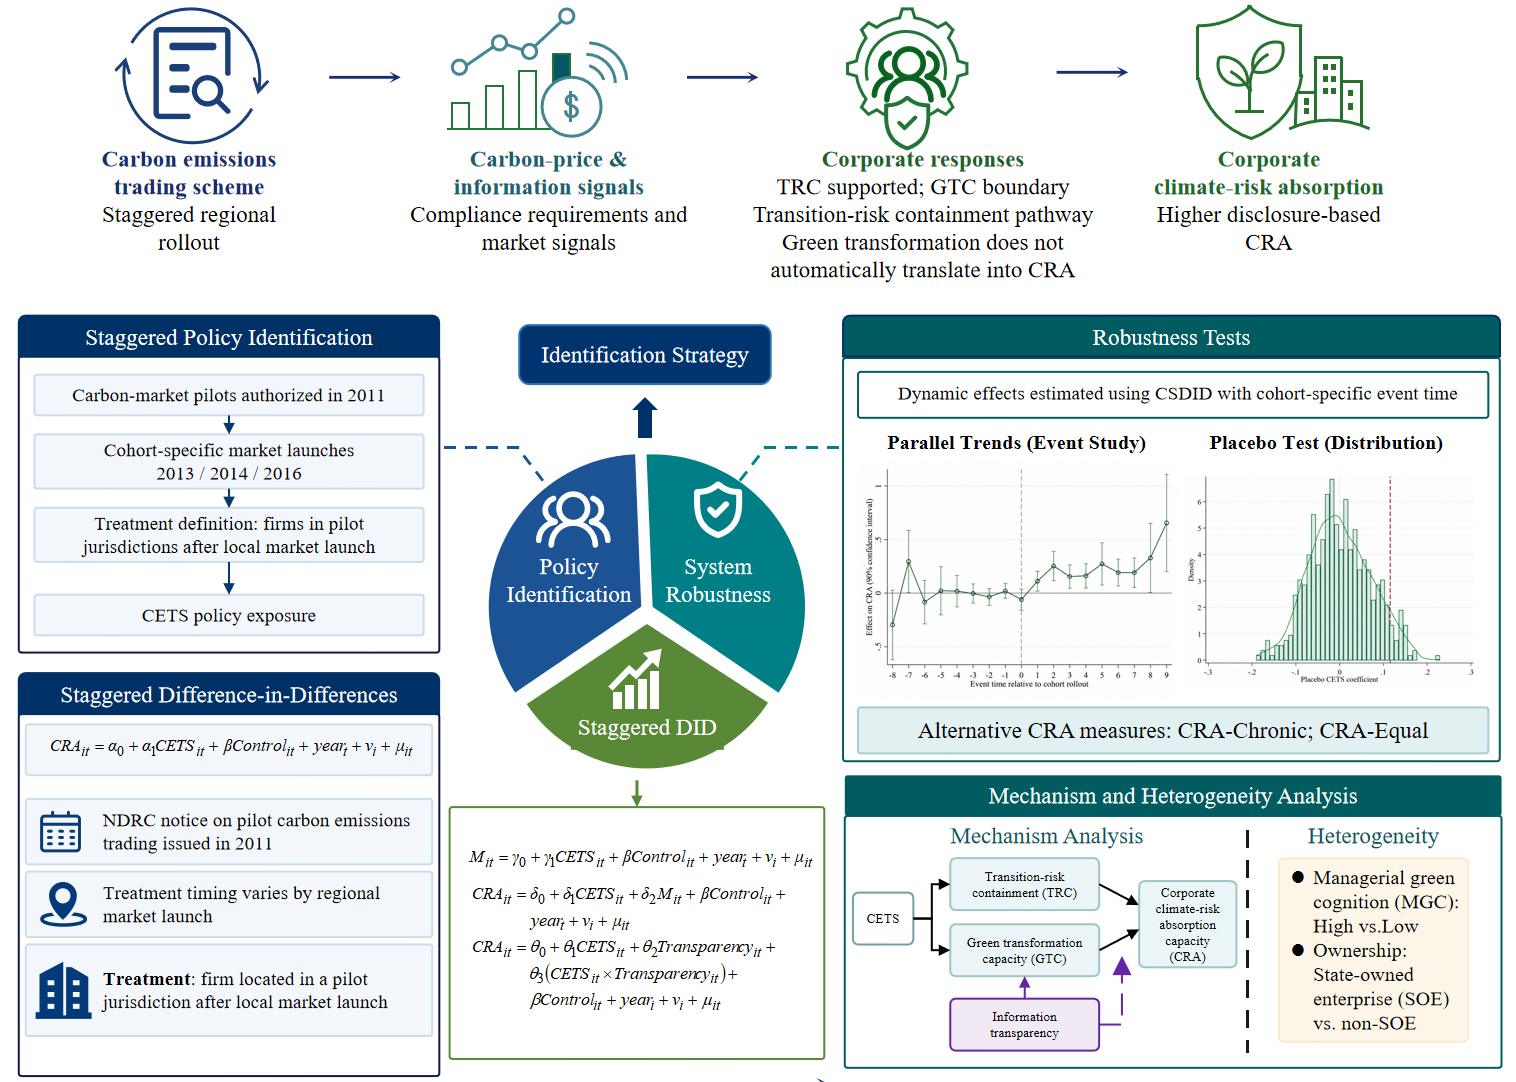
Figure 1. Conceptual and empirical research framework. CRA: Corporate climate-risk absorption capacity; TRC: transition-risk containment; GTC: green transformation capacity; CSDID: Callaway and Sant’Anna difference-in-differences estimator; CETS: carbon emissions trading scheme; NDRC: National Development and Reform Commission of China; DID: difference-in-differences.
METHODOLOGY AND DATA
Policy framework and hypotheses
A carbon emissions trading scheme (CETS) converts emissions rights into scarce, tradable assets and changes the expected returns to technologies, production arrangements, and risk-management activities. The Porter hypothesis suggests that well-designed environmental regulation can induce innovation and organizational upgrading that partly offset compliance costs[32], while the resource-based view emphasizes firms’ ability to develop valuable routines and capabilities in response to external constraints[33]. Organizational-resilience research further highlights anticipation, learning, coordination, slack resources, and resource reconfiguration as important capabilities under external shocks[22,23]. Together, these perspectives imply that carbon-market institutions may affect not only emissions and productivity but also the organizational processes through which firms identify and manage climate-related risks.
In China’s regional pilots, policy preparation and subsequent market operation required firms to respond to emissions accounting, allowance management, compliance obligations, and carbon-cost signals. Existing research shows that emissions trading can reshape innovation, productivity, and corporate decisions[13-15,17,18]. Repeated engagement with these requirements can institutionalize climate-related data collection, risk screening, longer planning horizons, and coordination across finance, operations, and environmental-management functions. If these routines are associated with lower disclosed physical-risk pressure, they should appear as a higher CRA measure. Because CRA is disclosure-based, the hypothesis concerns the empirical CRA index rather than directly verified physical resilience.
H1: CETS exposure is positively associated with the disclosure-based CRA measure.
Transition risk refers to regulatory, technological, market, and reputational pressures associated with the low-carbon transition. Active carbon-market institutions make part of this uncertainty more observable by establishing emissions-accounting rules, allowance constraints, compliance schedules, and carbon-cost signals. Repeated responses to external institutional demands can generate organizational routines, learning, and forward-looking capabilities[22,23,34]. Greater predictability of carbon liabilities may preserve managerial attention and financial flexibility, while established carbon-governance routines may improve the coordination of broader climate-risk management. We therefore expect transition-risk containment to constitute one mechanism through which CETS exposure is associated with the disclosure-based CRA measure.
H2: Transition-risk containment constitutes a potential mechanism linking CETS exposure to the disclosure-based CRA measure.
GTC captures a firm’s ability to generate economic output while limiting undesirable environmental outputs. Consistent with the Porter hypothesis, environmental regulation can stimulate technological innovation, resource reallocation, and productivity upgrading. Evidence from China shows that emissions-trading and related environmental policies can promote green innovation and green total factor productivity[15,17,18]. Cleaner production, energy efficiency, and process upgrading can preserve financial slack and operational flexibility, which may contribute to broader risk management[23,33]. However, green productivity is primarily a mitigation-oriented capability and does not necessarily address hazard exposure, flood protection, backup energy, water security, supply-chain redundancy, or business continuity. The transmission from GTC to CRA is therefore theoretically plausible but not automatic.
H3: Green transformation capacity constitutes a potential mechanism linking CETS exposure to the disclosure-based CRA measure.
Information transparency (Transparency) refers here to the quality of the firm’s external information environment rather than to the quantity of climate-risk words disclosed in the annual report. Importantly, Transparency is constructed from stock-market trading information rather than from the quantity or tone of climate-risk language in annual reports. It therefore measures a distinct information-environment construct and is not an alternative coding of CRA. Disclosure research shows that information asymmetry raises financing and transaction costs, while credible disclosure improves external monitoring and capital allocation[35,36]. Mandatory sustainability and carbon disclosure can alter firm behavior and valuation outcomes[37-39], and investors price carbon risk and use climate information in portfolio decisions[40]. In a more transparent information environment, firms and investors can interpret carbon-market signals more accurately and incorporate them into financing and operating decisions. This reasoning motivates the moderating mechanism proposed in H4.
H4: Information transparency positively moderates the association between CETS exposure and the disclosure-based CRA measure.
Figure 2 summarizes the proposed mechanisms and the distinction between the TRC coefficient pattern and the unsupported GTC transmission to CRA. The arrows represent hypothesized associations, not identified causal indirect effects. Upper-echelons theory suggests that managerial cognition can shape firms’ strategic responses to external policy signals[41]. Managerial green cognition (MGC) and state-owned enterprise status (SOE) are examined later as heterogeneity dimensions.
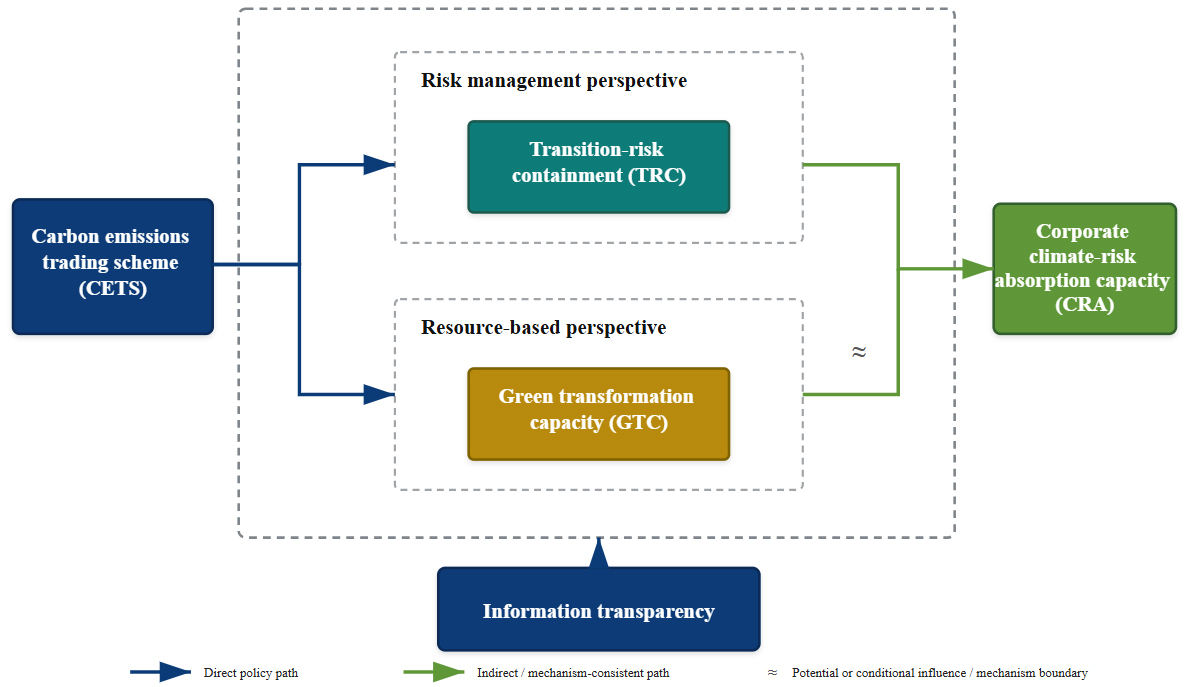
Figure 2. Empirical mechanism pathways linking CETS and corporate climate-risk absorption capacity.
Data and sample
The study uses a panel of Chinese A-share listed companies from 2006 to 2022. Corporate annual reports provide the textual material used to construct CRA, TRC, and MGC. Financial and ownership variables are obtained from the China Stock Market & Accounting Research (CSMAR) and Wind databases, while information used to estimate green total factor productivity is drawn from listed-company accounts and city-level statistical and environmental yearbooks. The sample is screened using standard listed-company eligibility and data-availability criteria, and continuous variables are winsorized at the 1st and 99th percentiles. The final main-regression sample contains 25,229 firm-year observations. Detailed sample construction and effective subsample sizes are reported in Supplementary Table 1.
The empirical design exploits the staggered launch of China’s regional carbon markets. CETS is defined as a jurisdiction-by-year policy-exposure indicator. It equals one beginning in the first year of active carbon-market trading in the firm’s jurisdiction and remains one thereafter; otherwise, it equals zero. In the province-level sample, Beijing, Tianjin, Shanghai, and Guangdong (including Shenzhen) are treated from 2013 onward, Hubei and Chongqing from 2014 onward, and Fujian from 2016 onward. Firms located outside these jurisdictions remain untreated throughout the sample period. The treatment therefore comprises seven province-level jurisdictions; Shenzhen is incorporated into Guangdong because the empirical data are organized at the province level. In the final main-regression sample, 1,125 firms are ever exposed to CETS and 1,742 firms remain untreated throughout the sample period. At the firm-year level, 6,581 observations have CETS = 1 and 18,648 have CETS = 0; the latter also include pre-treatment observations of firms that subsequently become exposed. CETS therefore captures exposure to an operating regional carbon-market institution rather than verified firm-level allowance trading.
Variable construction
Disclosure-based corporate climate-risk absorption capacity
We measure physical climate-risk disclosure using annual-report language and a physical- and transition-risk dictionary, consistent with the text-based approach in Cao and Zhou[28]. Let NA,it and NC,it denote the counts of acute- and chronic-physical-risk terms in firm i’s annual report in year t, and let Wit denote the report’s total word count. Physical disclosure intensity is
For robustness analysis, two alternative CRA measures are constructed. Define separate acute- and chronic-risk disclosure intensities, normalized per 10,000 annual-report words, as follows:
CRA-Chronic uses only chronic physical-risk terms while retaining the normalization, logarithmic transformation, standardization, and sign reversal applied to the baseline measure. CRA-Equal treats acute and chronic physical risks as separate components. Their term frequencies are first normalized by annual-report length, log-transformed, and standardized separately. The two standardized components are then combined with equal weights of 0.5, and the resulting composite is standardized again and sign-reversed. No additional logarithmic transformation is applied after aggregation. The standardization parameters are determined at the indicator-construction stage and remain fixed in subsequent regressions.
CRA is therefore an inverse disclosure-based physical-risk indicator: higher values denote lower standardized physical-climate-risk disclosure intensity under the study’s coding convention. The sign reversal facilitates interpretation of regression coefficients but does not add information beyond the underlying text measure. A higher CRA may reflect lower underlying exposure or vulnerability, stronger risk management, or a different reporting strategy; it may also reflect shifts in managerial attention or report composition. CRA does not directly measure hazard probability, engineering vulnerability, service continuity, downtime, recovery speed, or avoided loss. This qualification is important because corporate adaptation-and-resilience disclosure remains incomplete, especially for risks, metrics, and targets[27].
Mechanism, heterogeneity, and control variables
TRC is constructed from the intensity of annual-report language concerning climate-policy, technological, market, and reputational transition risks, using a dictionary-based approach consistent with Cao and Zhou[28]. The measure is log-transformed, sign-reversed, and standardized using a Z-score; higher TRC values indicate lower disclosed transition-risk pressure. GTC is measured by standardized green total factor productivity (GTFP). GTFP is estimated with a slacks-based measure (SBM)-Malmquist-Luenberger framework, consistent with the productivity-measurement framework in Zhang and Mao[42]. Inputs comprise net fixed assets, employment, and an electricity-use proxy derived from city-level industrial consumption; main business revenue is the desirable output, and proxies for industrial sulfur dioxide, wastewater, and smoke/dust emissions are the undesirable outputs. GTC captures green production efficiency rather than climate resilience itself. Information transparency (Transparency) is constructed from stock-market trading information. Consistent with the market-microstructure approach in Lyu et al.[43], the underlying information-asymmetry measure combines a liquidity ratio, an illiquidity measure, and a return-reversal measure. The index is sign-reversed and standardized using a Z-score so that a higher Transparency value denotes a more transparent information environment.
MGC is constructed in two steps. First, for each firm, we calculate the mean of its available standardized annual-report transition-risk-language values during 2006-2012, the baseline period preceding the first pilot market launches in 2013. This firm-level baseline measure is held fixed throughout the analysis. Second, firms with a valid baseline measure are divided at the cross-firm median: firms at or above the median are classified as high MGC and those below it as low MGC. Observations from 2013-2022 are not used in calculating the baseline MGC measure. Prior research uses annual-report language as a proxy for executives’ green perceptions[44]. The present measure specifically captures baseline transition-risk-language salience, an indirect proxy for managerial green cognition rather than a direct measure of managers’ knowledge. Its transition-risk vocabulary differs from the broader green-perception dictionary in that study. SOE equals one when the database explicitly classifies the firm’s ultimate ownership as state-owned and zero when it explicitly classifies the firm as non-state-owned. Observations without a valid ownership classification are treated as missing rather than assigned to the non-state-owned category.
The controls are defined as follows. Firm size (Size) is the natural logarithm of year-end total assets; leverage (Lev) is total liabilities divided by total assets; return on assets (ROA) is net profit divided by total assets; listing age (ListAge) is the natural logarithm of one plus the number of years since listing; operating cash flow (Cashflow) is net cash flow from operating activities divided by total assets; sales growth (Growth) is the annual growth rate of operating revenue; Tobin’s Q (TobinQ) is the market valuation indicator provided by the database; and ownership concentration (Top1) is the shareholding ratio of the largest shareholder. Table 1 summarizes the definition and measurement of all variables.
Variables and explanations of the empirical model
| Category | Symbol | Variable | Definition and measurement |
| Dependent variable | CRA | Corporate climate-risk absorption capacity | Let NA and NC be acute- and chronic-risk term counts and W the annual-report word count. Physical disclosure intensity equals |
| Independent variable | CETS | Carbon emissions trading scheme | Equals 1 from the first year of active carbon-market trading in the firm’s jurisdiction and thereafter, and 0 otherwise. Treatment begins in 2013 for Beijing, Tianjin, Shanghai, and Guangdong (including Shenzhen), in 2014 for Hubei and Chongqing, and in 2016 for Fujian. CETS measures regional policy exposure rather than verified firm-level allowance trading |
| Mechanism variables | TRC | Transition-risk containment | Constructed from annual-report language concerning policy, technological, market, and reputational transition risks. The text measure is log-transformed, sign-reversed, and standardized; higher values denote lower disclosed transition-risk pressure |
| GTC | Green transformation capacity | Measured by standardized green total factor productivity estimated using an SBM-Malmquist-Luenberger framework. Higher values denote stronger green production efficiency | |
| Transparency | Information transparency | Constructed from a composite information-asymmetry measure based on liquidity, illiquidity, and return reversal. The index is sign-reversed and standardized; higher values denote greater information transparency | |
| Control variables | Size | Firm size | Natural logarithm of year-end total assets |
| Lev | Leverage | Total liabilities divided by total assets | |
| ROA | Return on assets | Net profit divided by total assets | |
| ListAge | Listing age | Natural logarithm of one plus the number of years since listing | |
| Cashflow | Operating cash flow | Net cash flow from operating activities divided by total assets | |
| Growth | Sales growth | Annual growth rate of operating revenue | |
| TobinQ | Market valuation | Database-provided Tobin’s Q indicator | |
| Top1 | Ownership concentration | Shareholding ratio of the largest shareholder | |
| Heterogeneity variables | MGC | Managerial green cognition | Firm-level mean of standardized annual-report transition-risk-language values during 2006-2012. The measure is held fixed over time, and firms are classified as high or low MGC using the cross-firm median |
| SOE | State-owned enterprise status | Equals 1 when ultimate ownership is explicitly classified as state-owned, 0 when explicitly classified as non-state-owned, and missing when ownership classification is unavailable |
Econometric models
The study adopts a staggered-adoption difference-in-differences design that exploits variation in the timing of regional carbon-market launches across jurisdictions. The benchmark, mechanism, moderation, and heterogeneity specifications include firm and year fixed effects, with standard errors clustered at the province level, as given in:
where i and t index firms and years; CRAit is the disclosure-based physical-risk indicator defined in the subsection “Disclosure-based corporate climate-risk absorption capacity”; CETSit is the treatment indicator; Xit is the vector of controls with coefficient vector γ; μi and λt capture firm and year fixed effects; and εit is the idiosyncratic error. The treatment indicator CETS switches from zero to one when the regional carbon market associated with firm i begins active trading and remains one thereafter. Firm fixed effects absorb time-invariant firm characteristics, whereas year fixed effects control for common macroeconomic shocks. Standard errors are clustered at the province level. A positive treatment coefficient indicates that exposure to an operating regional carbon market is associated with a higher disclosure-based CRA measure and, by construction, a lower standardized intensity of physical climate-risk language. As emphasized above, the coefficient should not be interpreted as an equivalent change in realized physical resilience.
To examine whether the empirical patterns are consistent with the proposed mechanisms, we use a sequential three-equation coefficient-pattern analysis. The mechanism-variable equation is specified in:
where Mit denotes TRCit or GTCit, estimated separately.
The corresponding CRA including the mechanism variable is given in:
The symbols a and c denote intercepts, θ and β1 the respective CETS coefficients, η the coefficient on Mit, κ and γ the control-coefficient vectors, and νit and εit the error terms. The procedure evaluates whether CETS is associated with the proposed mechanism variable and whether that variable is subsequently associated with CRA when CETS is included in the same specification. Changes in the CETS coefficient are used as descriptive evidence on the proposed pathway. This procedure is not treated as a formal identification of an indirect causal effect; rather, it provides mechanism-consistent evidence under the panel fixed-effects framework.
The moderating model is expressed by
The coefficient φ measures whether the conditional association between CETS exposure and CRA varies with information transparency; δ is the standalone Transparency coefficient. Transparency is standardized in the direction defined in Table 1, and the interaction term captures how the marginal effect of CETS changes with the quality of the firm information environment.
Because treatment occurs at different times across jurisdictions, dynamic treatment effects are estimated using the Callaway and Sant’Anna difference-in-differences estimator (CSDID), which accommodates staggered treatment timing and cohort-specific treatment effects and permits doubly robust estimation[45,46]. Event time is defined relative to each cohort’s first treatment year rather than to a common calendar year. Because conventional fixed-effects estimates can be sensitive to treatment-effect heterogeneity and treatment timing[47,48], the dynamic analysis complements the benchmark regressions rather than removing all of their identification limitations.
EMPIRICAL RESULTS
Main effects
Table 2 reports the relationship between CETS pilot-policy exposure and the disclosure-based CRA measure. Column (1) controls for firm and year fixed effects but excludes time-varying firm characteristics. The CETS coefficient is 0.106, indicating a positive association between policy exposure and CRA. Column (2) adds all eight financial and governance controls, and the coefficient increases slightly to 0.115. Because CRA is standardized, the estimate corresponds to a 0.115-standard-deviation increase in the disclosure-based CRA index. By construction, this is equivalent to lower normalized physical-climate-risk language intensity among exposed firms; it should not be interpreted as a 0.115-standard-deviation improvement in realized physical resilience. The similarity of the two estimates shows that the positive coefficient is not substantially altered by adding these observed controls.
Results of main regression
| (1) CRA | (2) CRA | (3) CRA | ||
| CETS | 0.106*** | 0.115*** | ||
| (2.798) | (3.009) | |||
| One-year-delayed CETS exposure | 0.125*** | |||
| (3.187) | ||||
| Size | -0.109*** | -0.110*** | ||
| (-3.764) | (-3.829) | |||
| Lev | 0.059 | 0.060 | ||
| (0.763) | (0.768) | |||
| ROA | -0.094 | -0.087 | ||
| (-0.595) | (-0.549) | |||
| ListAge | 0.112** | 0.113** | ||
| (2.505) | (2.535) | |||
| Cashflow | -0.249** | -0.249*** | ||
| (-2.727) | (-2.752) | |||
| Growth | 0.008 | 0.008 | ||
| (0.465) | (0.482) | |||
| TobinQ | 0.004 | 0.004 | ||
| (0.569) | (0.539) | |||
| Top1 | -0.272* | -0.268* | ||
| (-1.898) | (-1.868) | |||
| _cons | -0.024** | 2.235*** | 2.254*** | |
| (-2.424) | (3.498) | (3.538) | ||
| Year | YES | YES | YES | |
| Firm | YES | YES | YES | |
| Controls | NO | YES | YES | |
| N | 25,235 | 25,229 | 25,229 | |
| R2 | 0.569 | 0.572 | 0.572 | |
Column (3) employs a one-year-delayed CETS exposure indicator, which assigns treatment beginning in the year following each regional carbon-market launch. The dependent variable and all eight control variables remain contemporaneous, with firm and year fixed effects and province-clustered standard errors retained. The estimated coefficient is 0.125 and remains statistically significant. Since the delayed indicator is constructed directly from the regional policy schedule rather than from preceding firm-year observations, the sample size remains unchanged at 25,229. This result indicates that the positive association between CETS exposure and the disclosure-based CRA measure is robust to a one-year shift in treatment timing, providing further support for H1.
Parallel-trend test
Figure 3 presents the dynamic treatment effects estimated using CSDID under staggered carbon-market adoption. Event time is defined as the observation year relative to the first treatment year of the corresponding cohort. Accordingly, event time 0 denotes the cohort-specific year in which active carbon-market trading begins and may correspond to 2013, 2014, or 2016 for different treated firms rather than to a common calendar year.
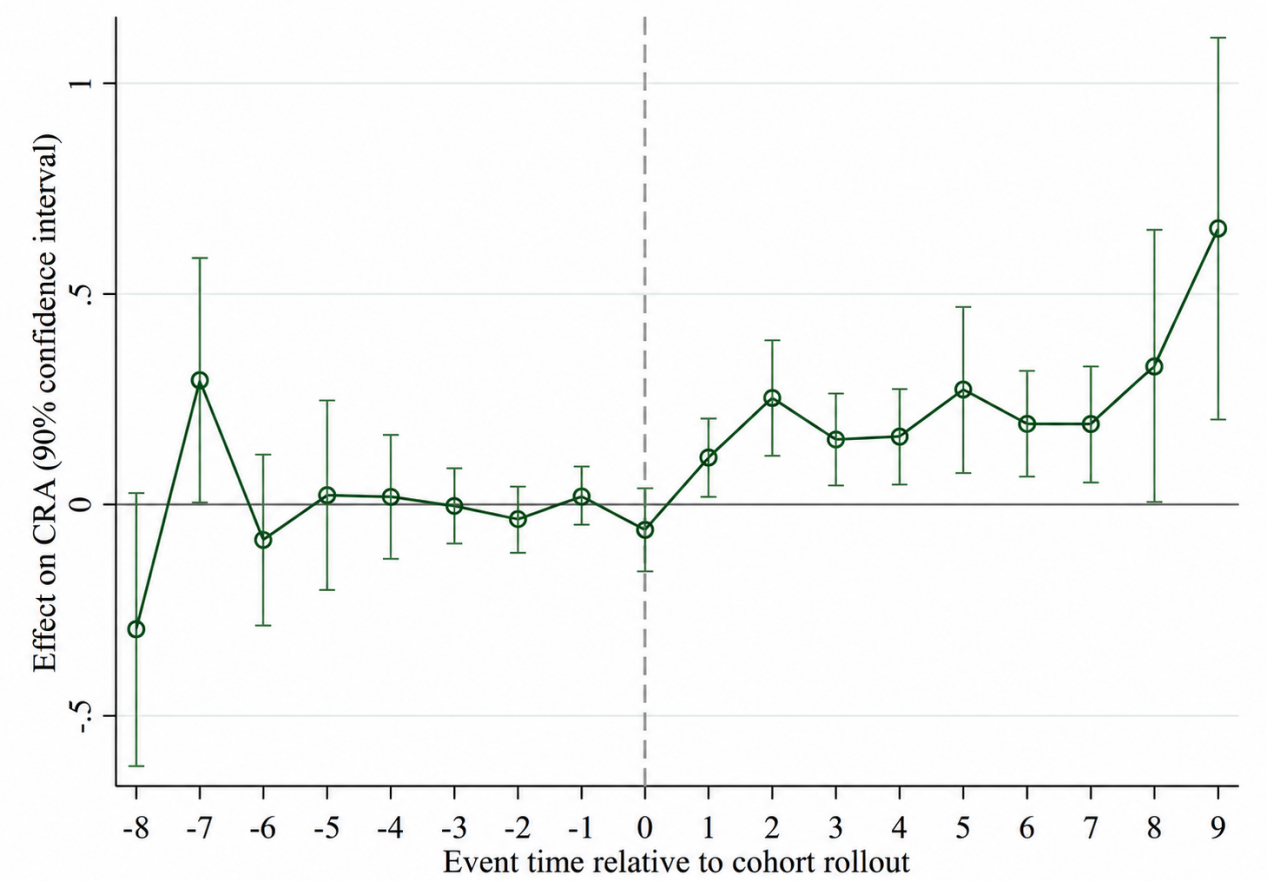
Figure 3. CSDID event-study results. Error bars represent pointwise 90% confidence intervals based on standard errors clustered at the provincial level. CSDID: Callaway and Sant’Anna difference-in-differences estimator, which accommodates staggered policy adoption; CRA: corporate climate-risk absorption capacity.
Most pre-treatment point estimates are close to zero, although the earliest event periods are less precisely estimated. This visual diagnostic does not establish the parallel-trends assumption or rule out anticipation effects. Post-treatment estimates are predominantly positive and are larger in several later periods. The figure displays event times from eight periods before to nine periods after treatment. Because cohorts contribute different observable event-time ranges within 2006-2022, changes across event times may also reflect differences in cohort composition.
Robustness to placebo assignment and alternative outcomes
A placebo test is conducted by randomly assigning pseudo-treatment under the staggered CETS setting. Figure 4 shows that the placebo coefficients are concentrated around zero, whereas the benchmark estimate lies in the positive tail of the placebo distribution. The position of the benchmark estimate is a descriptive diagnostic; its tail location alone does not establish statistical significance or rule out non-random policy selection. The placebo test provides complementary evidence alongside the CSDID dynamic analysis and the alternative CRA specifications.
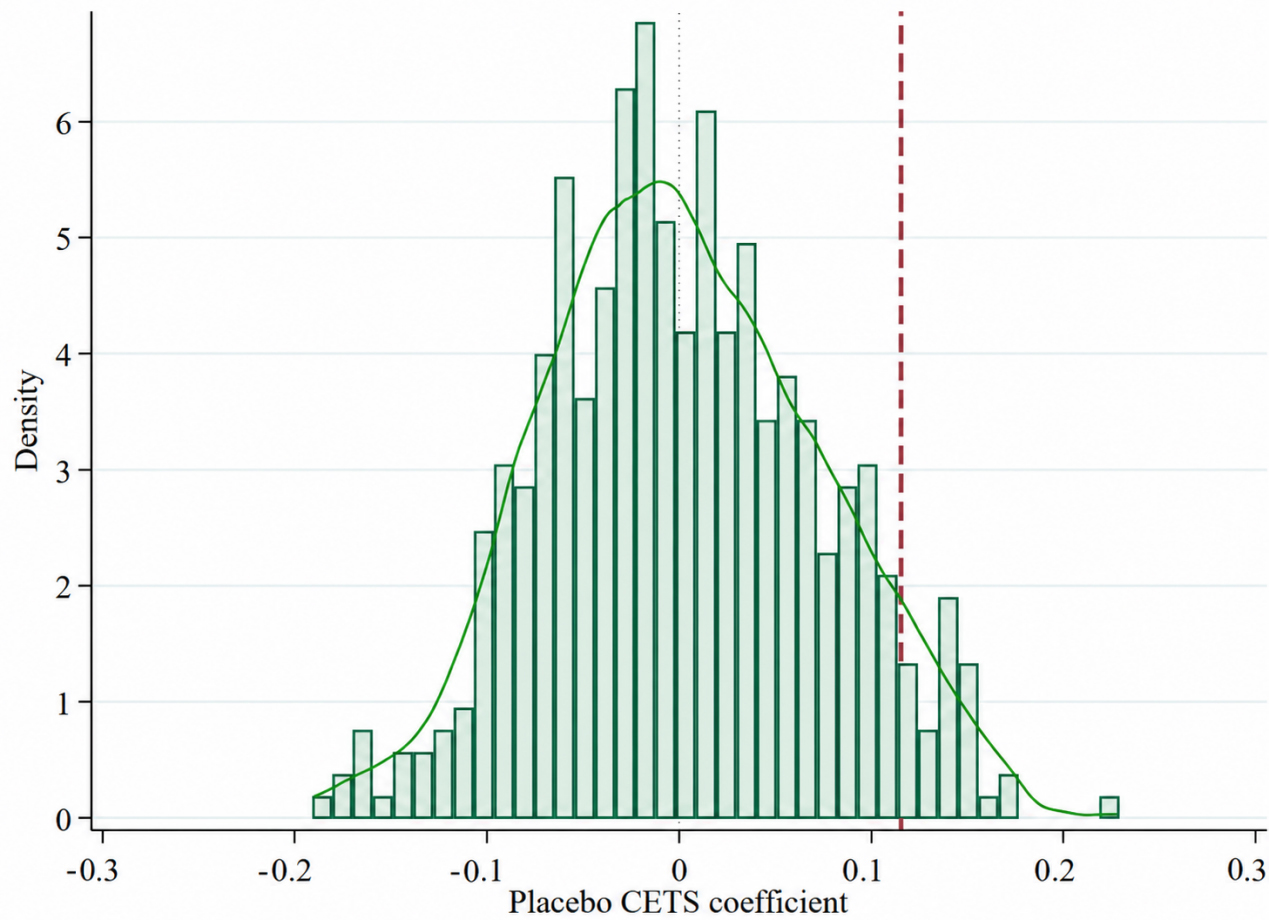
Figure 4. CETS placebo test. The red dashed line indicates the benchmark CETS coefficient, while the green solid curve represents the kernel density estimate of the placebo coefficients. CETS: Carbon emissions trading scheme.
Table 3 reports the robustness results using alternative CRA constructions while retaining all controls, firm and year fixed effects. Column (1) uses CRA-Chronic, which includes only chronic physical-risk language, and yields a CETS coefficient of 0.121. Column (2) uses CRA-Equal, which separately standardizes the log-transformed acute- and chronic-risk intensities before combining them with equal weights, and yields a coefficient of 0.101. Both coefficients remain positive and statistically significant. These results suggest that the positive association between CETS exposure and disclosure-based CRA is not specific to the inclusion of acute-risk terms or the baseline aggregation procedure.
Results of robustness tests using alternative CRA measures
| (1) CRA-Chronic | (2) CRA-Equal | |
| CETS | 0.121*** | 0.101** |
| (3.532) | (2.649) | |
| Size | -0.065*** | -0.115*** |
| (-3.584) | (-3.876) | |
| Lev | 0.001 | 0.077 |
| (0.018) | (0.988) | |
| ROA | -0.300* | -0.094 |
| (-2.028) | (-0.600) | |
| ListAge | 0.115*** | 0.112** |
| (2.793) | (2.526) | |
| Cashflow | -0.226** | -0.238** |
| (-2.600) | (-2.504) | |
| Growth | 0.016 | 0.007 |
| (0.978) | (0.434) | |
| TobinQ | 0.008 | 0.003 |
| (1.121) | (0.439) | |
| Top1 | -0.162 | -0.283* |
| (-1.035) | (-2.006) | |
| _cons | 1.231*** | 2.372*** |
| (2.921) | (3.607) | |
| Year | YES | YES |
| Firm | YES | YES |
| N | 25,229 | 25,229 |
| R2 | 0.569 | 0.580 |
Mechanism analysis
Table 4 first examines transition-risk containment. In column (2), the coefficient of CETS exposure on TRC is 0.085 and is significant at the 5% level. Because a higher TRC value represents lower disclosed transition-risk pressure, this estimate indicates that CETS exposure is associated with stronger transition-risk containment. In column (3), TRC has a positive coefficient of 0.234 and is significant at the 1% level, while the CETS coefficient decreases from the benchmark value of 0.115 to 0.095 but remains significant. This coefficient pattern is consistent with TRC representing one potential mechanism linking carbon-market exposure to the disclosure-based CRA measure. However, the attenuation in the CETS coefficient is descriptive and should not be interpreted as an estimated indirect effect. An important qualification is that TRC and CRA are constructed from different climate-risk dictionaries applied to the same annual reports. Their association may therefore partly reflect shared textual features, including reporting style, tone, document composition, or other common-source variation. The use of distinct physical- and transition-risk vocabularies reduces direct conceptual overlap but does not eliminate this common-text-source concern. CRA is normalized by total annual-report length before log transformation and standardization, which limits simple document-scale differences but does not remove possible common variation in reporting style, tone, or content composition. For these reasons, the TRC results are interpreted as mechanism-consistent evidence rather than as a causal mediation estimate.
Mechanism analysis of transition-risk containment and green transformation capacity
| (1) CRA | (2) TRC | (3) CRA | (4) GTC | (5) CRA | |
| CETS | 0.115*** | 0.085** | 0.095** | 0.008** | 0.115*** |
| (3.009) | (2.049) | (2.344) | (2.299) | (3.010) | |
| TRC | 0.234*** | ||||
| (12.639) | |||||
| GTC | -0.018 | ||||
| (-0.524) | |||||
| Size | -0.109*** | -0.142*** | -0.076*** | -0.002 | -0.109*** |
| (-3.764) | (-6.402) | (-2.777) | (-0.878) | (-3.765) | |
| Lev | 0.059 | 0.188*** | 0.015 | 0.003 | 0.059 |
| (0.763) | (2.882) | (0.189) | (0.290) | (0.764) | |
| ROA | -0.094 | 0.032 | -0.101 | -0.028 | -0.094 |
| (-0.595) | (0.241) | (-0.664) | (-1.036) | (-0.599) | |
| ListAge | 0.112** | -0.011 | 0.115** | -0.001 | 0.112** |
| (2.505) | (-0.492) | (2.541) | (-0.317) | (2.504) | |
| Cashflow | -0.249** | -0.161** | -0.211** | 0.019 | -0.249** |
| (-2.727) | (-2.571) | (-2.331) | (1.076) | (-2.726) | |
| Growth | 0.008 | 0.017** | 0.004 | -0.001 | 0.008 |
| (0.465) | (2.248) | (0.232) | (-0.652) | (0.463) | |
| TobinQ | 0.004 | 0.009 | 0.002 | 0.002* | 0.004 |
| (0.569) | (1.104) | (0.268) | (1.840) | (0.577) | |
| Top1 | -0.272* | -0.201* | -0.225 | 0.021** | -0.271* |
| (-1.898) | (-1.750) | (-1.517) | (2.185) | (-1.895) | |
| _cons | 2.235*** | 3.131*** | 1.504** | 0.024 | 2.236*** |
| (3.498) | (6.613) | (2.441) | (0.459) | (3.499) | |
| Year | YES | YES | YES | YES | YES |
| Firm | YES | YES | YES | YES | YES |
| N | 25,229 | 25,229 | 25,229 | 25,229 | 25,229 |
| R2 | 0.572 | 0.803 | 0.583 | 0.988 | 0.572 |
The remaining columns evaluate green transformation capacity. Column (4) shows that CETS exposure is associated with a 0.008 increase in GTC, with the coefficient significant at the 5% level, indicating that carbon-market exposure is associated with mitigation-oriented productive upgrading. However, after GTC is included in the CRA equation in column (5), its coefficient is -0.018 and statistically insignificant, while the CETS coefficient remains 0.115 and significant at the 1% level. Thus, the first link from CETS exposure to green transformation is supported, but the second link from green transformation to CRA is not. H3 is therefore not supported. The high R2 reported for the GTC equation reflects the fit of the full specification, which includes both firm and year fixed effects, and should not be interpreted as the explanatory power of CETS alone. Accordingly, the GTC mechanism is evaluated from the relevant coefficient pattern rather than from the magnitude of the overall R2. This finding limits support for the proposed GTC pathway in the present specification. An insignificant GTC coefficient does not establish the absence of a relationship, and the analysis does not observe changes in physical-hazard exposure. The result reinforces the distinction between mitigation-oriented production efficiency and adaptation-related risk capacity.
Table 5 tests the moderating mechanism of information transparency. Column (1) repeats the benchmark coefficient of 0.115. After Transparency and its interaction with CETS are added in column (2), the conditional coefficient on CETS is 0.100 and remains significant at the 5% level. The standalone coefficient on Transparency is negative, whereas the interaction coefficient CETS × Transparency is positive and statistically significant at the 1% level. The positive interaction means that a one-standard-deviation increase in information transparency raises the estimated conditional CETS coefficient by 0.049 standard deviations. The positive interaction is therefore consistent with H4: the association between CETS exposure and the disclosure-based CRA measure is stronger in more transparent information environments.
Moderating effect of information transparency
| (1) CRA | (2) CRA | |
| CETS | 0.115*** | 0.100** |
| (3.009) | (2.609) | |
| Transparency | -0.033* | |
| (-2.008) | ||
| CETS × transparency | 0.049*** | |
| (4.055) | ||
| Size | -0.109*** | -0.095*** |
| (-3.764) | (-3.170) | |
| Lev | 0.059 | 0.047 |
| (0.763) | (0.612) | |
| ROA | -0.094 | -0.058 |
| (-0.595) | (-0.359) | |
| ListAge | 0.112** | 0.112** |
| (2.505) | (2.517) | |
| Cashflow | -0.249** | -0.237** |
| (-2.727) | (-2.687) | |
| Growth | 0.008 | 0.007 |
| (0.465) | (0.419) | |
| TobinQ | 0.004 | 0.010 |
| (0.569) | (1.350) | |
| Top1 | -0.272* | -0.299* |
| (-1.898) | (-1.982) | |
| _cons | 2.235*** | 1.924*** |
| (3.498) | (2.968) | |
| Year | YES | YES |
| Firm | YES | YES |
| N | 25,229 | 25,229 |
| R2 | 0.572 | 0.572 |
Because the model includes an interaction term, the marginal effect of CETS exposure is 0.100 + 0.049 × Transparency. As Transparency is standardized, the estimated effect is 0.100 at the sample mean, rises to 0.149 at one standard deviation above the mean, and falls to 0.051 at one standard deviation below the mean. These values are point estimates; the central result is the positive interaction. The moderation result concerns the conditioning role of the external information environment rather than the unconditional relationship between Transparency and CRA. Because Transparency is derived from stock-market information whereas CRA is constructed from annual-report physical-risk language, the two variables capture distinct constructs and need not move in the same direction. The negative standalone Transparency coefficient is therefore a conditional association when CETS equals zero and does not determine the sign or interpretation of the interaction effect.
Heterogeneity analysis
Table 6 first divides the sample by baseline MGC. The MGC subsample contains 18,126 firm-year observations. Among the firms represented in the main-regression sample, 1,413 first enter the matched analytical panel in 2013 or later and therefore have no observations during the 2006-2012 baseline window from which firm-level MGC can be constructed. These firms account for 7,103 firm-year observations that cannot be assigned to either MGC group. The CETS coefficient is 0.109 in the low-MGC group and 0.128 in the high-MGC group. Both estimates are positive, with a somewhat larger point estimate among firms with higher managerial green cognition. The difference in point estimates does not establish a statistically significant difference between groups because no formal coefficient-equality test is reported. These results describe responses across baseline transition-risk-language groups.
Results of heterogeneous effects
| CRA | ||||
| (1) Low MGC | (2) High MGC | (3) Non-SOE | (4) SOE | |
| CETS | 0.109** | 0.128* | -0.055 | 0.231*** |
| (2.204) | (1.885) | (-1.288) | (4.051) | |
| Size | -0.115*** | -0.093* | -0.104*** | -0.109** |
| (-3.497) | (-1.760) | (-3.320) | (-2.085) | |
| Lev | -0.022 | 0.119 | 0.167 | -0.061 |
| (-0.177) | (0.852) | (1.676) | (-0.331) | |
| ROA | -0.205 | 0.201 | 0.013 | -0.381 |
| (-0.754) | (0.571) | (0.071) | (-1.146) | |
| ListAge | 0.149** | 0.066 | 0.077** | 0.153 |
| (2.255) | (0.983) | (2.067) | (1.491) | |
| Cashflow | -0.424*** | -0.062 | -0.201* | -0.272 |
| (-3.156) | (-0.381) | (-1.850) | (-1.631) | |
| Growth | 0.011 | -0.003 | -0.002 | 0.009 |
| (0.556) | (-0.097) | (-0.099) | (0.360) | |
| TobinQ | -0.013 | 0.033 | 0.000 | 0.005 |
| (-1.105) | (1.573) | (0.019) | (0.316) | |
| Top1 | -0.413* | -0.171 | -0.147 | -0.465* |
| (-1.940) | (-0.619) | (-0.786) | (-1.739) | |
| _cons | 2.547*** | 1.763 | 2.190*** | 2.177* |
| (3.898) | (1.375) | (3.265) | (1.765) | |
| Year | YES | YES | YES | YES |
| Firm | YES | YES | YES | YES |
| N | 9,031 | 9,095 | 14,791 | 9,942 |
| R2 | 0.425 | 0.501 | 0.616 | 0.545 |
When the sample is divided by ownership, 416 of the 25,229 observations in the main-regression sample lack a valid ownership classification and therefore cannot be assigned to either ownership group. After the ownership split, an additional 80 singleton observations are omitted by the fixed-effects estimation, leaving 24,733 observations across the SOE and non-SOE regressions. The CETS coefficient is -0.055 and statistically insignificant among non-state-owned enterprises, whereas it is 0.231 and significant at the 1% level among state-owned enterprises. This subgroup pattern may reflect differences in institutional responsiveness rather than as evidence that one ownership type necessarily possesses greater realized physical resilience. Differences in financing access, policy information, compliance infrastructure, organizational implementation capacity, and disclosure incentives may all contribute to the observed pattern. Because the non-SOE coefficient is negative and statistically insignificant whereas the SOE coefficient is positive and significant, the full-sample coefficient should be interpreted as an average across heterogeneous ownership responses rather than as a uniform positive response applying to all firms. Different within-group significance levels do not, by themselves, establish a statistically significant between-group coefficient difference.
DISCUSSION
Carbon-market exposure and disclosure-based climate-risk absorption
The main finding is that CETS pilot-policy exposure is associated with a higher disclosure-based CRA measure. This result extends the evaluation of carbon-market institutions beyond conventional outcomes such as emissions, innovation, and productivity, but its interpretation must remain tied to the construction of the dependent variable. A higher CRA indicates lower normalized physical-climate-risk language intensity; it does not by itself demonstrate lower realized disaster losses, shorter downtime, or faster operational recovery. The finding is therefore most appropriately interpreted as evidence that carbon-market institutions are associated with changes in firms’ disclosed physical-risk signal and potentially in the organizational processes underlying that signal. Existing evidence that investors price carbon risk and that internal carbon pricing can influence corporate environmental decisions provides a related financial channel[40,49], while broader evidence confirms that carbon pricing affects emissions and can diffuse across jurisdictions[50-52].
The result also connects with a broader international shift in carbon finance. Recent discussions surrounding COP30 and nature-based carbon markets have considered how transparent carbon-crediting arrangements could mobilize finance for tropical forests and perennial crops, including forest restoration and tropical-crop management in Southeast Asia[9]. Crop-sustainability research[10] and evidence on Indonesian smallholder livelihoods and deforestation[11] underline the need to assess environmental integrity and distributional outcomes separately. Indonesia and Malaysia are particularly relevant because of the economic importance of tropical land-use sectors and oil-palm production. At the same time, evidence on forest-credit baselines shows that carbon-market integrity depends critically on measurement choices and uncertainty management[12]. These international developments reinforce a central implication of the present study: carbon-finance institutions can create economically meaningful policy and information signals, but those signals should not be treated as verified resilience outcomes without independent measurement.
The disclosure-based nature of CRA also leaves several competing interpretations open. A reduction in normalized physical-risk language may reflect lower underlying exposure, stronger risk management, changes in reporting practice, or a reallocation of managerial attention toward carbon and transition issues. The present text-based measure cannot fully discriminate among these explanations. Accordingly, we do not interpret the CETS coefficient as definitive evidence that underlying physical vulnerability has declined. External validation against geolocated hazard exposure, realized disaster losses, business interruption, insurance claims, and recovery outcomes is necessary before CRA can be linked more directly to realized resilience. Asset-level research shows why geolocated exposure matters for adaptation finance[53], while recent corporate evidence documents persistent gaps in adaptation implementation, metrics, and targets[27].
Supported and unsupported mechanisms: a mitigation-adaptation boundary
The mechanism analysis identifies both a potential pathway and a policy boundary. The coefficient pattern is consistent with transition-risk containment constituting one potential mechanism linking carbon-market exposure to the disclosure-based CRA measure: exposure to operating carbon markets may clarify compliance responsibilities, improve internal carbon accounting, and embed forward-looking risk governance in investment decisions. This interpretation is deliberately limited to mechanism consistency because TRC and CRA are constructed from the same annual-report source and the sequential regressions do not identify a causal indirect effect. These organizational changes are consistent with the planning, monitoring, and coordination functions emphasized in recent corporate adaptation and resilience frameworks[54].
Green transformation capacity follows a different pattern. CETS exposure is positively associated with GTC, but GTC does not significantly predict CRA after policy exposure and firm characteristics are controlled for. This does not mean that green upgrading is unimportant. The present estimates do not establish that green productivity gains generate adaptation outcomes such as flood protection, backup energy, water security, supply-chain redundancy or emergency recovery capacity. Recent fiscal evidence similarly shows that mitigation receives substantially more attention than adaptation and that mitigation-oriented infrastructure can remain non-resilient when adaptation conditions are absent[55]. The Intergovernmental Panel on Climate Change (IPCC) also emphasizes the close linkages, but not equivalence, between mitigation, adaptation and climate-resilient development[56]. The unsupported GTC pathway should therefore be understood as a mechanism boundary that calls for deliberate coordination between low-carbon transition and resilience policy.
Information transparency and disclosure interpretation
The positive interaction indicates that the association between CETS exposure and CRA is stronger at higher values of the stock-market-based Transparency measure. The negative standalone coefficient is conditional on CETS equaling zero. Because Transparency and CRA measure different constructs, their coefficients do not imply contradictory mappings between disclosure and realized resilience. Improved monitoring and interpretation of policy signals offer a possible explanation, but the regression does not separately identify changes in disclosure completeness or the quality of policy transmission.
Recent evidence shows that environmental policy can improve corporate climate-risk disclosure[31], green credit can reduce corporate climate-risk exposure[57], and emissions trading can reduce enterprise energy intensity[58]. Yet credible disclosure and measurable progress remain essential because corporate climate commitments do not translate uniformly into target achievement[59]. A decision-grade architecture should therefore keep verified emissions accounting separate from any future resilience metric. Carbon-linked loans, insurance products, and transition bonds may reference both types of information, but resilience performance should never cancel unmitigated emissions.
Heterogeneity, financing constraints and policy reach
The subgroup regressions show positive CETS coefficients in both managerial-green-cognition groups, with a somewhat larger point estimate among high-MGC firms. Wit hout a formal between-group test, the small difference in point estimates cannot establish that higher MGC strengthens the policy association. The ownership results display a more pronounced positive pattern among state-owned enterprises, which may reflect advantages in financing access, policy information, data systems, compliance management, organizational implementation, or disclosure incentives. Because the non-SOE estimate is negative and statistically insignificant while the SOE estimate is positive and significant, the full-sample coefficient should be read as an average across heterogeneous ownership responses rather than as a uniform effect across firms. The stronger SOE response should not be interpreted as evidence that state ownership itself produces greater realized physical resilience. These descriptive subgroup patterns indicate limits to generalization; they do not establish causal effects of ownership or managerial cognition.
This interpretation is consistent with evidence that higher interest rates and financing barriers can weaken support for and adjustment to carbon pricing[60]. Economic theory also shows that uniform carbon pricing may be inefficient when social and private discount rates differ and sectoral technologies are heterogeneous[61], while complementary financial incentives can correct capital misallocation and support low-carbon investment[62]. For resilience policy, the implication is not to weaken the carbon-price signal, but to combine it with targeted and accountable support. Revenue recycling, guarantees, technical assistance, and shared climate-data services can broaden access, provided that allocation is transparent and linked to independently verified risk reduction.
From disclosure-based CRA to a conceptual climate-resilience footprint
The empirical analysis in this study does not estimate a complete corporate climate-resilience footprint. CRA is a disclosure-based text indicator and should not be mechanically converted into a footprint measure. Instead, the limitations of CRA motivate a broader conceptual question: what would be required to construct a decision-grade measure of residual corporate physical-climate risk? We use the term corporate climate-resilience footprint (CRF) for this prospective accounting concept. Consistent with general requirements for footprint indicators[63], a future CRF would need an explicit object, organizational and value-chain boundary, hazard and temporal boundary, measurement unit or normalization rule, and a transparent aggregation procedure. It would also require independently verified information on hazard intensity, asset and supply-chain exposure, vulnerability, adaptive capacity, business interruption, and recovery outcomes. The CRF is therefore proposed as a conceptual extension and future measurement agenda rather than as an empirically operationalized variable in the present study.
Such a CRF should remain separate from a carbon footprint. A carbon footprint accounts for attributable greenhouse-gas emissions, whereas a resilience-oriented footprint would characterize residual susceptibility to physical disruption after adaptation capacity is considered. The two may inform the same financing decision but should not be netted against one another: resilience investment cannot compensate for unmitigated emissions, and emissions reductions alone do not establish physical resilience. Asset-level climate-risk assessment and climate-resilience disclosure standards provide useful building blocks for future operationalization[53,64].
CONCLUSION AND POLICY IMPLICATIONS
Conclusions
This study examines the relationship between China’s regional carbon-market pilots and a disclosure-based measure of corporate climate-risk absorption. The empirical results indicate that CETS exposure is associated with a higher CRA measure, which corresponds by construction to lower standardized physical-climate-risk language intensity. The result should therefore be interpreted as a change in the disclosure-based physical-risk signal rather than as direct evidence of lower realized physical vulnerability. The benchmark, lagged-treatment, and alternative-CRA specifications yield positive coefficients. CSDID dynamic estimates and the placebo distribution provide complementary diagnostics, subject to the identification and inference limitations discussed below.
The mechanism analysis provides evidence consistent with transition-risk containment as a potential pathway, whereas green transformation capacity does not form a supported transmission channel to CRA. This distinction indicates that mitigation-oriented productivity improvements and adaptation-related risk capacity are connected but not interchangeable. The CETS-CRA association is stronger at higher measured information transparency. Subgroup estimates are positive in both MGC groups and more pronounced among SOEs, but formal between-group coefficient differences are not established. The full-sample estimate therefore represents an average across heterogeneous firm responses and should not be interpreted as a uniform effect across ownership types. These subgroup patterns should be interpreted as differences in institutional responsiveness rather than direct evidence of differences in realized physical resilience.
Empirically, the study extends carbon-market evaluation beyond conventional emissions and productivity outcomes while defining the limits of what disclosure-based climate-risk text can establish. Conceptually, the analysis motivates a broader corporate climate-resilience footprint that could integrate hazard, exposure, vulnerability, adaptive capacity, and recovery information. That footprint is not estimated in the present study and should be viewed as a future asset-level measurement framework rather than as an empirical transformation of CRA.
Policy implications
Build a dual-layer monitoring, reporting and verification architecture
Carbon-market monitoring, reporting, and verification (MRV) should remain centered on scientifically credible and comparable emissions footprints. Regulators and financial institutions may additionally develop an interoperable resilience-measurement layer, but it should remain separate from emissions accounting. The conceptual CRF outlined in the subsection “From disclosure-based CRA to a conceptual climate-resilience footprint” provides one possible future architecture: it would declare organizational and value-chain boundaries, hazard and scenario coverage, baseline and time horizon, asset-level exposure and vulnerability, adaptation measures, service-continuity thresholds, and recovery targets. Asset-level physical-risk assessment and credible disclosure are necessary for directing adaptation finance toward material risks rather than generic green labels[31,53].
The two layers should be connected but not merged. Emission reductions should be verified against carbon-accounting standards; any future CRF should be verified against hazard-specific baselines and continuity, recovery, or avoided-loss indicators. Resilience investment cannot offset emissions, and a lower carbon footprint cannot by itself demonstrate resilience. This separation preserves carbon-market integrity while allowing genuine mitigation-adaptation co-benefits to be identified. Independent assurance is particularly important because target progress varies substantially across firms[59], while adaptation disclosure remains patchy for risks, metrics, and targets[27].
Recycle carbon revenues toward additional and verifiable resilience investment
The present data do not identify how carbon-market revenues are used. Nevertheless, the mechanism results and the broader adaptation-finance literature motivate a policy-design option in which a defined share of auction proceeds, compliance revenues or related public funds could be allocated to resilience measures with clear additionality. Eligible activities may include facility-level risk assessment, flood protection, resilient cooling, backup energy, water-efficiency upgrades, supplier diversification and business-continuity systems. International evidence shows that adaptation and resilience remain underfunded relative to mitigation and can be locked out when fiscal programs lack explicit adaptation criteria[55,56].
Revenue allocation should follow exposure, additionality and distributional criteria rather than simple reimbursement of compliance costs. Projects should demonstrate a material climate hazard, measurable risk reduction and consistency with emissions goals. Competitive calls, public project registers, ex-post evaluation and clawback provisions can improve accountability. Where high interest rates constrain capital-intensive adjustment, recycling arrangements can combine grants, guarantees and concessional finance to preserve the effectiveness and acceptability of carbon pricing[60].
Expand inclusive access for non-state-owned and financially constrained firms
The ownership patterns motivate considering targeted measures for firms that lack the financing and information advantages of large state-owned enterprises. Policy support can include standardized physical-risk screening, shared data platforms, technical assistance for climate-risk governance, credit guarantees and resilience-linked lending facilities. Green credit has been shown to reduce corporate climate-risk exposure[57], but access conditions and verification standards should prevent benefits from being concentrated among firms that already possess stronger reporting and financing capacity.
Support should be conditional on measurable resilience improvements and should mobilize, rather than crowd out, private finance. Public finance can absorb early-stage assessment costs or part of the downside risk, while banks and insurers price verified reductions in expected disruption. Complementary financial contracts are especially relevant when market distortions delay investment responses to carbon pricing[62]. This approach would extend the reach of carbon finance without diluting the incentive to reduce emissions.
Preserve market credibility while allowing differentiated implementation support
The growing evidence that carbon pricing reduces emissions supports continued market expansion and stronger compliance rather than replacing the price mechanism[50,51]. Policy diffusion can also generate international benefits by normalizing carbon pricing and improving expectations about future regulation[52]. At the same time, the subgroup point estimates suggest that responses in the CRA measure may differ across firms, although these comparisons do not establish causal effects of subgroup membership.
Differentiation should therefore focus on implementation support, transition timelines, and access to finance, not on weakening measurement or allowing unverified resilience offsets. Sector-specific technical standards, phased compliance assistance, and targeted financing may be justified where technologies, capital lifetimes, and adjustment costs differ[58,61]. A credible carbon market and a credible resilience-finance framework are complements: the former requires consistent emissions accounting, while the latter requires separate, decision-grade indicators of physical risk and recovery.
Limitations and future research
Several limitations warrant caution. First, CRA is a disclosure-based text indicator rather than a direct measure of realized physical resilience. Although normalization by report length reduces simple document-scale differences, changes in reporting strategy, content composition, or managerial attention may still affect the measure. Normalization does not rule out denominator growth correlated with treatment timing. Second, CETS captures regional policy exposure based on firms’ locations rather than verified firm-level allowance trading. Because pilot jurisdictions were not randomly selected and treatment is concentrated in a limited number of regions, time-varying regional confounding and few-cluster inference remain potential concerns despite firm and year fixed effects, CSDID diagnostics, and placebo tests. Third, listed firms may not represent smaller firms, and overlapping policies cannot be fully excluded. The MGC baseline predates market launches but includes the pilot-designation and preparation period; it is not necessarily free from anticipation. Finally, the mechanism analysis is diagnostic rather than causal: TRC and CRA are derived from the same annual reports and may share common textual features, so the sequential regressions should not be interpreted as identifying a causal indirect effect.
Future research should validate disclosure-based CRA against independently observed physical-risk outcomes, such as geolocated hazard exposure, disaster losses, business interruption, insurance claims, supply-chain disruptions, and recovery time. Such evidence could also support future operationalization of the proposed CRF using independently measured hazard, exposure, vulnerability, adaptation, and recovery indicators. Further work should examine report-length trends, alternative textual controls, and formal indirect-effect inference, and assess whether resilience-related responses persist following major climate shocks.
DECLARATIONS
Authors’ contributions
Made substantial contributions to the conception and design of the study, methodology, formal analysis, visualization, and drafting of the manuscript: Guo, K.
Contributed to methodology, validation, interpretation of results, and critical revision of the manuscript: Zhang, T.
Contributed to validation, interpretation, and critical revision of the manuscript: Fan, S.
Performed data acquisition and curation, contributed to validation and interpretation, and critically revised the manuscript: Wang, B.
Made substantial contributions to the conception and design of the study, supervision, project administration, interpretation of results, and critical revision of the manuscript: Wang, C.
All authors reviewed and approved the final manuscript.
Availability of data and materials
The firm-level financial, ownership, and stock-market data used in this study were obtained from the China Stock Market & Accounting Research (CSMAR) Database (https://www.csmar.com/en/) and the Wind Database (https://www.wind.com.cn/) through institutional subscriptions. Access to these proprietary datasets is subject to the providers’ licensing and data-use agreements. Accordingly, the licensed underlying data are not publicly redistributed by the authors and may be obtained directly from the respective providers with appropriate authorization. Corporate annual reports are publicly accessible through CNINFO (https://www.cninfo.com.cn/). Statistical and environmental data were compiled from relevant statistical and environmental yearbooks, with official information accessible through the National Bureau of Statistics of China (https://www.stats.gov.cn/) and the Ministry of Ecology and Environment of China (https://www.mee.gov.cn/hjzl/sthjzk/sthjtjnb/). Further information regarding data sources and variable construction may be requested from the corresponding author, subject to applicable data-use restrictions.
AI and AI-assisted tools statement
During the preparation of this manuscript, the authors used ChatGPT (version GPT-5.6 Sol; OpenAI, released 2026-07-09) for language editing, improving readability, and grammar correction. In addition, ChatGPT (version GPT-5.6 Sol; OpenAI, released 2026-07-09) was used to assist in generating schematic design ideas and visual layouts for Figure 1 and the Graphical Abstract, which were subsequently reviewed, edited, and incorporated into the final figures by the authors. These AI tools did not influence the study design, data collection, analysis, interpretation, or the scientific content of the work. All authors take full responsibility for the accuracy, integrity, and final content of the manuscript.
Financial support and sponsorship
This research was funded by the National Natural Science Foundation of China (No. 72140002).
Conflicts of interest
All authors declared that there are no conflicts of interest.
Ethical approval and consent to participate
Not applicable.
Consent for publication
Not applicable.
Copyright
© The Author(s) 2026.
Supplementary Materials
REFERENCES
1. Intergovernmental Panel on Climate Change (IPCC). Climate change 2022 - impacts, adaptation and vulnerability. Working Group II contribution to the sixth assessment report of the Intergovernmental Panel on Climate Change. Cambridge University Press, Cambridge; 2023.
2. United Nations Environment Programme (2024). Adaptation gap report 2024. Come hell and high water - As fires and floods hit the poor hardest, it is time for the world to step up adaptation actions. Nairobi.
3. Goldstein, A.; Turner, W. R.; Gladstone, J.; Hole, D. G. The private sector’s climate change risk and adaptation blind spots. Nat. Clim. Change. 2019, 9, 18-25.
5. Filatova, T.; Taberna, A.; Chatzivasileiadis, T.; Cortés Arbués, I. Private sector investments in climate change adaptation. Nat. Clim. Chang. 2025, 15, 1249-56.
6. World Bank. 2024. State and Trends of Carbon Pricing 2024. Washington, DC: World Bank. https://documents1.worldbank.org/curated/en/099081624122529330/pdf/P502283-5fd8d191-282d-4e50-8634-ea02e1c107bc.pdf? (accessed 2026-11-13).
7. Klenert, D.; Mattauch, L.; Combet, E.; et al. Making carbon pricing work for citizens. Nat. Clim. Change. 2018, 8, 669-77.
8. Soergel, B.; Kriegler, E.; Weindl, I.; et al. A sustainable development pathway for climate action within the UN 2030 Agenda. Nat. Clim. Chang. 2021, 11, 656-64.
9. Murphy, D. J.; Yong, S. Global carbon sequestration and the roles of tropical forests and crops: prospects for using innovative carbon trading approaches to address the climate emergency. Earth 2026, 7, 22.
10. Murphy, D. J. Agronomy and environmental sustainability of the four major global vegetable oil crops: oil palm, soybean, rapeseed, and sunflower. Agronomy 2025, 15, 1465.
11. Li, T. M. Securing oil palm smallholder livelihoods without more deforestation in Indonesia. Nat. Sustain. 2024, 7, 387-93.
12. Teo, H. C.; Tan, N. H. L.; Zheng, Q.; et al. Uncertainties in deforestation emission baseline methodologies and implications for carbon markets. Nat. Commun. 2023, 14, 8277.
13. Bayer, P.; Aklin, M. The European Union Emissions Trading System reduced CO2 emissions despite low prices. Proc. Natl. Acad. Sci. U. S. A. 2020, 117, 8804-12.
14. Calel, R.; Dechezleprêtre, A. Environmental policy and directed technological change: evidence from the European carbon market. Rev. Econ. Stat. 2016, 98, 173-91.
15. Ren, S.; Yang, X.; Hu, Y.; Chevallier, J. Emission trading, induced innovation and firm performance. Energy. Econ. 2022, 112, 106157.
16. Wang, K.; Wang, Z.; Xian, Y.; et al. Optimizing the rolling out plan of China’s carbon market. iScience 2023, 26, 105823.
17. Zhang, S.; Cheng, L.; Ren, Y.; Yao, Y. Effects of carbon emission trading system on corporate green total factor productivity: does environmental regulation play a role of green blessing? Environ. Res. 2024, 248, 118295.
18. Zhou, F.; Wang, X. The carbon emissions trading scheme and green technology innovation in China: a new structural economics perspective. Econ. Anal. Policy. 2022, 74, 365-81.
19. Sautner, Z.; Van, Lent. L.; Vilkov, G.; Zhang, R. Firm-level climate change exposure. J. Finance. 2023, 78, 1449-98.
20. Krueger, P.; Sautner, Z.; Starks, L. T.; Karolyi, A. The importance of climate risks for institutional investors. Rev. Financ. Stud. 2020, 33, 1067-111.
21. Kling, G.; Volz, U.; Murinde, V.; Ayas, S. The impact of climate vulnerability on firms’ cost of capital and access to finance. World. Dev. 2021, 137, 105131.
22. Sakhel, A. Corporate climate risk management: are European companies prepared? J. Clean. Prod. 2017, 165, 103-18.
23. Ortiz-de-Mandojana, N.; Bansal, P. The long-term benefits of organizational resilience through sustainable business practices. Strateg. Manage. J. 2016, 37, 1615-31.
24. Li, X. Physical climate change exposure and firms’ adaptation strategy. Strateg. Manage. J. 2025, 46, 750-89.
25. Goonesekera, S. M.; Olazabal, M. Climate adaptation indicators and metrics: state of local policy practice. Ecol. Indic. 2022, 145, 109657.
26. Massetti, E.; Mendelsohn, R. Measuring climate adaptation: methods and evidence. Rev. Environ. Econ. Policy. 2018, 12, 324-41.
27. Spacey Martín, R.; Ranger, N.; Schimanski, T.; Leippold, M. Empirically assessing corporate adaptation and resilience disclosure using AI. NPJ. Clim. Action. 2026, 5, 22.
28. Cao, L.; Zhou, F. Can climate transition risks enhance enterprise green innovation? An analysis employing a dual regulatory mechanism. Climate 2026, 14, 18.
29. National Development and Reform Commission of China (NDRC), 2011. Notice on Carrying Out Pilot Work for Carbon Emissions Trading (Fa Gai Ban Qi Hou [2011] No. 2601). https://www.ndrc.gov.cn/xxgk/zcfb/tz/201201/t20120113_964370.html (accessed 2026-11-13).
30. Ministry of Ecology and Environment of China (MEE), 2021. Measures for the Administration of Carbon Emissions Trading (Trial). https://www.mee.gov.cn/xxgk2018/xxgk/xxgk02/202101/t20210105_816131.html (accessed 2026-11-13).
31. Cui, X.; Ding, Q.; Yang, L.; Yu, C. Environmental protection tax reform and corporate climate risk disclosure. J. Clean. Prod. 2024, 478, 143931.
32. Porter, M. E.; Linde, C. V. D. Toward a new conception of the environment-competitiveness relationship. J. Econ. Perspect. 1995, 9, 97-118.
34. Bansal, P. Evolving sustainably: a longitudinal study of corporate sustainable development. Strateg. Manage. J. 2005, 26, 197-218.
35. Healy, P. M.; Palepu, K. G. Information asymmetry, corporate disclosure, and the capital markets: a review of the empirical disclosure literature. J. Account. Econ. 2001, 31, 405-40.
36. Leuz, C.; Wysocki, P. D. The economics of disclosure and financial reporting regulation: evidence and suggestions for future research. J. Account. Res. 2016, 54, 525-622.
37. Krueger, P.; Sautner, Z.; Tang, D. Y.; Zhong, R. The effects of mandatory ESG disclosure around the world. J. Account. Res. 2024, 62, 1795-847.
38. Downar, B.; Ernstberger, J.; Reichelstein, S.; Schwenen, S.; Zaklan, A. The impact of carbon disclosure mandates on emissions and financial operating performance. Rev. Account. Stud. 2021, 26, 1137-75.
39. Matsumura, E. M.; Prakash, R.; Vera-Muñoz, S. C. Firm-value effects of carbon emissions and carbon disclosures. Account. Rev. 2014, 89, 695-724.
40. Bolton, P.; Kacperczyk, M. Do investors care about carbon risk? J. Financ. Econ. 2021, 142, 517-49.
41. Hambrick, D. C.; Mason, P. A. Upper echelons: the organization as a reflection of its top managers. Acad. Manage. Rev. 1984, 9, 193-206.
42. Zhang, Q.; Mao, Z. The impact of corporate digital transformation on green total factor productivity - The role of environmental regulation. Sustainability 2026, 18, 2048.
43. Lyu, Y.; Ji, Z.; Zhang, X.; Zhan, Z. Can fintech alleviate the financing constraints of enterprises? - Evidence from the chinese securities market. Sustainability 2023, 15, 3876.
44. Huang, M.; Chen, S.; Cheng, P. Green path without waste: zero-waste city pilot construction and corporate green innovation. Humanit. Soc. Sci. Commun. 2025, 12, 1771.
45. Callaway, B.; Sant’anna, P. H. Difference-in-differences with multiple time periods. J. Econom. 2021, 225, 200-30.
46. Sant’anna, P. H.; Zhao, J. Doubly robust difference-in-differences estimators. J. Econom. 2020, 219, 101-22.
47. Sun, L.; Abraham, S. Estimating dynamic treatment effects in event studies with heterogeneous treatment effects. J. Econom. 2021, 225, 175-99.
48. Goodman-Bacon, A. Difference-in-differences with variation in treatment timing. J. Econom. 2021, 225, 254-77.
49. Zhu, B.; Xu, C.; Wang, P.; Zhang, L. How does internal carbon pricing affect corporate environmental performance? J. Bus. Res. 2022, 145, 65-77.
50. Döbbeling-Hildebrandt, N.; Miersch, K.; Khanna, T. M.; et al. Systematic review and meta-analysis of ex-post evaluations on the effectiveness of carbon pricing. Nat. Commun. 2024, 15, 4147.
51. Adamolekun, G. Carbon price and firm greenhouse gas emissions. J. Environ. Manage. 2024, 349, 119496.
52. Linsenmeier, M.; Mohommad, A.; Schwerhoff, G. Global benefits of the international diffusion of carbon pricing policies. Nat. Clim. Chang. 2023, 13, 679-84.
53. Bressan, G.; Đuranović, A.; Monasterolo, I.; Battiston, S. Asset-level assessment of climate physical risk matters for adaptation finance. Nat. Commun. 2024, 15, 5371.
54. Hennes, K.; Bendig, D.; Löschel, A. Facing the storm: developing corporate adaptation and resilience action plans amid climate uncertainty. npj. Clim. Action. 2024, 3, 37.
55. Sadler, A.; Ranger, N.; Fankhauser, S.; Marotta, F.; O’callaghan, B. The impact of COVID-19 fiscal spending on climate change adaptation and resilience. Nat. Sustain. 2024, 7, 270-81.
56. Intergovernmental Panel on Climate Change (IPCC). AR6 Synthesis Report: climate change 2023. Contribution of Working Groups I, II and III to the Sixth Assessment Report of the Intergovernmental Panel on Climate Change [Core Writing Team, Lee, H; Romero, J. Eds.]. IPCC, Geneva, Switzerland.
57. He, F.; Duan, L.; Cao, Y.; Wen, S. Green credit policy and corporate climate risk exposure. Energy. Econ. 2024, 133, 107509.
58. Shi, W.; Zhang, Y.; Liu, J. Investigating the role of emissions trading system in reducing enterprise energy intensity: evidence from China. Energy. Econ. 2024, 140, 108005.
59. Bolay, A.; Bjørn, A.; Patouillard, L.; Weber, O.; Margni, M. What drives companies’ progress on their emission reduction targets? J. Clean. Prod. 2024, 468, 143124.
60. Funke, F.; Mattauch, L.; Douenne, T.; Fabre, A.; Stiglitz, J. E. Supporting carbon pricing when interest rates are higher. Nat. Clim. Chang. 2024, 14, 665-7.
61. Kalsbach, O.; Rausch, S. Pricing carbon in a multi-sector economy with social discounting. J. Environ. Econ. Manage. 2024, 125, 102991.
62. Edenhofer, O.; Lessmann, K.; Tahri, I. Asset pricing and the carbon beta of externalities. J. Environ. Econ. Manage. 2024, 125, 102969.
63. Matuštík, J.; Kočí, V. What is a footprint? A conceptual analysis of environmental footprint indicators. J. Clean. Prod. 2021, 285, 124833.
64. International Sustainability Standards Board (ISSB), 2023. IFRS S2 Climate-related Disclosures. IFRS Foundation, London. https://www.ifrs.org/issued-standards/ifrs-sustainability-standards-navigator/ifrs-s2-climate-related-disclosures/ (accessed 2026-11-13).
Cite This Article
 Open Access
How to Cite
Guo, K.; Zhang, T.; Fan, S.; Wang, B.; Wang, C. Carbon trading and corporate climate risk absorption measured from disclosure in China. Carbon Footprints 2026, 5, 61. https://dx.doi.org/10.20517/cf.2026.123
Download Citation
If you have the appropriate software installed, you can download article citation data to the citation manager of your choice. Simply select your manager software from the list below and click on download.
Export Citation File
Type of Import
Tips on Downloading Citation
Citation Manager File Format
Type of Import
Direct Import: When the Direct Import option is selected (the default state), a dialogue box will give you the option to Save or Open the downloaded citation data. Choosing Open will either launch your citation manager or give you a choice of applications with which to use the metadata. The Save option saves the file locally for later use.
Indirect Import: When the Indirect Import option is selected, the metadata is displayed and may be copied and pasted as needed.
About This Article
Special Topic
Copyright

Data & Comments
Data
0












Comments
Comments must be written in English. Spam, offensive content, impersonation, and private information will not be permitted. If any comment is reported and identified as inappropriate content by OAE staff, the comment will be removed without notice. If you have any queries or need any help, please contact us at [email protected].