
Accelerating the efficient recycling of drink bottles through deposit refund system: intention, WTP, and key determinants
 0
0 Abstract
With the rapid expansion of the bottled beverage industry, the escalating consumption of single-use plastic containers has intensified the challenge of plastic pollution. Deposit-refund system (DRS) has emerged as a viable strategy for mitigating this issue, garnering growing interest from both public and private sectors. Taking Macao city as a typical case, this study constructs a comprehensive cognitive analysis of consumers’ intention, willingness to pay (WTP), and the key determinants of DRS using the extended theory of planned behavior and the contingent valuation method. The findings reveal that behavioral intention is significantly shaped primarily by attitude (effect value = 0.512), followed by green perceived value (effect value = 0.351). Moreover, attitude is substantially driven by environmental concern and environmental emotion, with path coefficients of 0.554 and 0.508, respectively. Notably, 82.3% of respondents expressed WTP for DRS, with a mean value of 1.26 Macanese pataca (MOP). The main reasons for consumers’ reluctance to receive DRS are uncertainty about the popularity, convenience and accessibility of recycling locations (67.10%). This study offers a conceptual paradigm for elucidating consumer preferences toward DRS within the broader context of environmental sustainability.
Keywords
INTRODUCTION
Owing to their remarkable stability, cost-effectiveness, and versatility, plastics have found extensive application across packaging, industry, agriculture, and numerous other sectors, driving a sharp escalation in global production over recent decades. Statistical data reveal that global plastic production has surged from 2 million tons in 1950 to 367 million tons by 2020, with plastic waste projected to reach 53 million tons annually by 2030[1]. Packaging represents the predominant source of plastic use within the consumer sector, primarily comprising single-use materials intended for the containment of goods and typically discarded immediately after use.
Global consumption of bottled drinks has risen steadily over recent decades. China stands as the world’s leading producer of plastics, generating 114.88 million tons of primary plastic in 2022[2]. Currently, polyethylene terephthalate (PET) remains the dominant packaging choice in the bottled drink industry. Although PET bottles are theoretically reusable, their safe reuse is limited by the risk of chemical leaching - an issue compounded by repeated use and posing significant health concerns. Sustainability is gaining prominence among consumers, with over 71% worldwide reporting adjustments to their lifestyles and purchasing behaviors in pursuit of more sustainable living[3]. Yet, heightened environmental awareness does not consistently translate into greener consumption choices; pragmatic factors such as price, brand appeal, and convenience often take precedence[4]. Unravelling how consumers navigate trade-offs between environmentally benign and conventional products remains a critical challenge for researchers, business leaders, and policymakers aiming to foster meaningful behavioral shifts toward sustainability.
Several researchers have analyzed consumer attitudes towards plastic beverages and explored the key factors influencing the psychological processes of consumers. For example, Chatterjee and Barbhuiya employ the theory of planned behavior (TPB) to examine how beliefs, attitudes, social norms, and perceptions of cost and benefit shape tourists’ intentions to reduce bottled drink consumption[5]. Marchi et al. explored consumer preferences and willingness to pay (WTP) for PET and more sustainable plastic alternatives through a hypothetical discrete choice experiment[6]. Starting from the social science theory, Galati et al. used mineral water bottles made from environmentally friendly packaging to study the purchasing behavior and the relevant factors affecting their purchasing behavior, using the college student population as a reference sample[7]. Herrmann et al. employed a mixed-method approach - combining a Discrete Choice Experiment with qualitative free-text analysis - to elucidate the role of consumers in the transition to sustainable packaging[8]. Kokthi et al. investigated how trust influences consumer value judgements of a widely consumed bottled beverage[9]. A review of prior studies reveals that consumer valuations of bottled drink products are markedly influenced by packaging characteristics, with a general preference for bioplastics[10] and recycled materials[11]. Nonetheless, product origin often exerts a stronger effect on WTP than packaging type[12], and while consumers may favor the absence of packaging altogether, such an option is often impractical for certain goods[13]. As for intervention strategies, labeling has been shown to enhance the appeal of bioplastics[14], and providing information on environmental impacts may heighten awareness of sustainability issues[15] - though such awareness does not necessarily translate into increased WTP for more sustainable alternatives.
While considerable research has examined consumer attitudes and WTP for sustainable beverage packaging, several critical gaps remain. First, much of the existing literature focuses on in-store beverage containers, while overlooking the context of deposit-refund systems (DRS), which are increasingly pivotal in advancing Extended Producer Responsibility (EPR) frameworks. DRS incentivizes consumers to return used containers by charging a refundable deposit, thereby enhancing recycling rates. However, the determinants of consumer acceptance of DRS - particularly in the bottled beverage sector - are not well understood. Second, although DRS has been implemented in various regions, little is known about how cognitive and psychological factors - such as environmental concern (EC), emotion, policy awareness, and perceived green value - shape consumers’ behavioral intentions (BI) and WTP within such systems. Existing theoretical frameworks have not been sufficiently extended to incorporate these constructs in the context of DRS.
To curb the excessive use of plastic bags and encourage the adoption of reusable alternatives, the Macao Government has implemented a plastic bag levy. Recognizing the relatively high recycling value of PET beverage bottles, the government has also installed resource recovery bins and smart recycling machines in public spaces, with drop-off ports optimized for item shape to enhance collection efficiency.
Considering the fact that a policy needs to be examined in detail from the moment it is proposed to the moment it is implemented, this study focuses on PET beverage bottles in Macao - a region actively promoting recycling infrastructure - and aims to: (1) establish the complex structure of the cognitive dynamics of consumer acceptance of DRS and examine in depth its influencing factors, providing a basis for the development of behavioral guidance strategies; (2) explore the prospect of enriching the combined TPB frameworks with “EC”, “environmental emotion (EE)”, “policy cognition (PC)”, and “green perceived value (GPV)”, thus enhancing their capacity to explain phenomena in the context of DRS; and (3) reveal the frequency distribution of personal characteristics in terms of use intentions and provide an effective strategy to simplify investment and save time.
LITERATURE REVIEW AND RESEARCH HYPOTHESES
Theoretical foundation
The TPB serves as a robust foundational framework for predicting and understanding pro-environmental behaviors, including consumer participation in recycling initiatives[16,17]. As posited by Srivastava et al.[18], TPB articulates that an individual’s BI - the most immediate antecedent of actual behavior - is jointly determined by three core constructs: attitude (AT) toward the behavior, subjective norm (SN), and perceived behavioral control (PBC). While TPB provides a powerful baseline model, its parsimony can sometimes limit its explanatory power in complex behavioral contexts such as sustainable consumption. To more fully capture the cognitive and affective drivers specific to consumers’ acceptance of a DRS for beverage bottles, we propose an extended TPB model. This extension integrates four additional constructs: EC, EE, PC, and GPV. The conceptual roles of these added variables and their hypothesized relationships within the TPB framework are illustrated in Figure 1 and elaborated in the subsequent sections. We posit that EC and EE act as distal antecedents that shape the foundational attitudinal component of TPB. PC is hypothesized to strengthen the social normative component. Finally, GPV is introduced as a direct determinant of BI, capturing a consumer’s holistic evaluation of the trade-offs involved in participating in DRS, thereby augmenting the model’s predictive capacity.
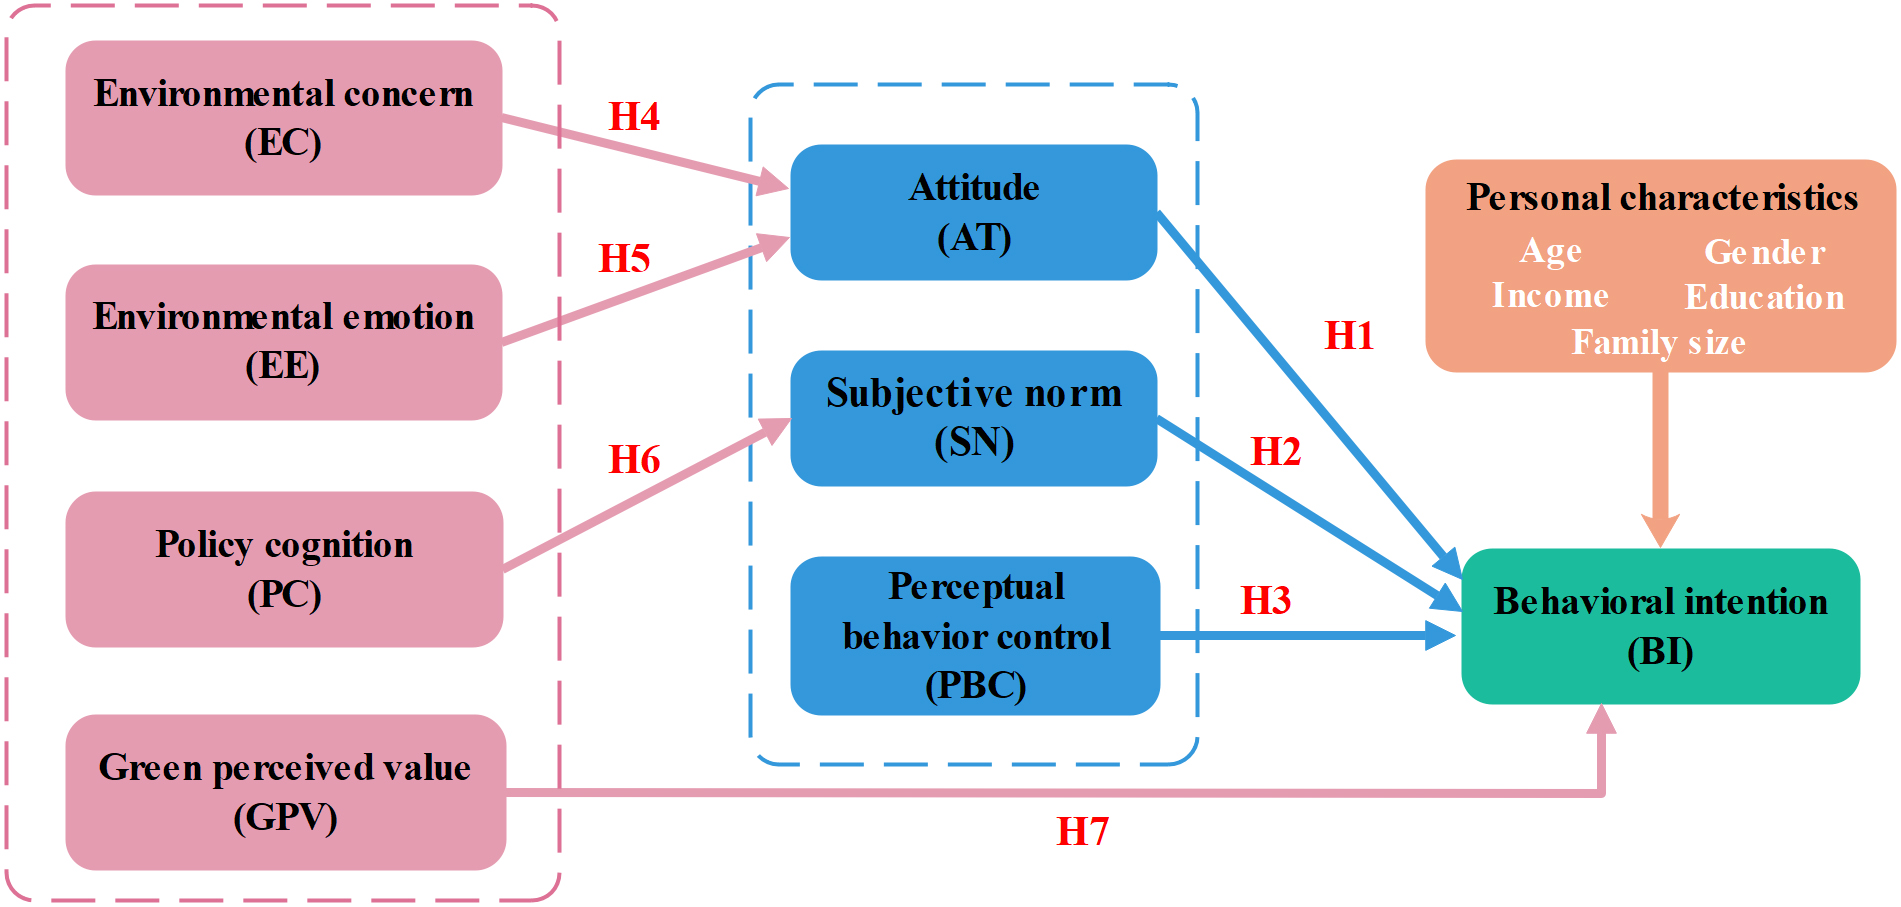
Figure 1. The theoretical framework of intention to use DRS. H = Hypothesis (e.g., H1, H2, H3, etc.).
Standard TPB constructs
AT refers to the degree to which an individual has a favorable or unfavorable evaluation of the behavior in question. In the context of DRS, a positive attitude towards returning bottles for a refund is a critical motivator. Empirical studies consistently identify AT as a dominant predictor of intention in
H1: AT has a significant positive effect on BI.
SN reflects the perceived social pressure to perform or not perform the behavior, influenced by the expectations of important referents (e.g., family, friends, community)[20]. Prior research confirms that SN significantly influences BIs in recycling behaviors[21,22]. In a DRS, endorsement from one’s social circle can create normative pressure to participate. Therefore:
H2: SN has a significant positive effect on BI.
PBC denotes the perceived ease or difficulty of performing the behavior, factoring in control beliefs about required resources and opportunities[18]. A strong sense of control over the process of returning bottles (e.g., knowing where and how to return them) is likely to strengthen one’s intention to do so. While the strength of PBC’s effect varies across contexts[23], it is particularly relevant for DRS, which involves a specific logistical action. Hence:
H3: PBC has a significant positive effect on BI.
Extension constructs
The standard TPB model does not explicitly account for the underlying psychological dispositions that form an individual’s attitude. We introduce EC- defined as an individual’s level of awareness and worry about ecological problems[24] - and EE - referring to affective responses to environmental issues (e.g., guilt, worry, satisfaction)[25] - to serve as these foundational antecedents.
Theoretically, EC represents a cognitive evaluation of environmental issues, which is expected to inform one’s overall attitude toward a pro-environmental behavior such as DRS participation[26,27]. Simultaneously, EE represents the affective counterpart; emotions are potent drivers that can fortify positive attitudes, especially when a behavior is perceived as a moral imperative[28,29]. By integrating both cognitive (EC) and affective (EE) dimensions of environmental consciousness, we provide a more nuanced explanation of how a positive attitude toward DRS is formed, moving beyond the standard TPB which treats attitude as a given. We therefore hypothesize:
H4: EC has a significant positive effect on AT.
H5: EE has a significant positive effect on AT.
PC is defined as an individual’s awareness and understanding of relevant government policies and regulations[30]. We posit that PC is not redundant with SN but rather acts as an external stimulus that can amplify it. Government policies, such as the promotion of DRS, can be interpreted by consumers as a strong signal of societal priorities and values[31]. When consumers are cognizant of such policies, they may perceive greater social expectation and normative pressure to comply, thereby strengthening the SN construct. This role of PC in activating and intensifying social norms has been observed in other policy-driven consumption contexts, such as new energy vehicle adoption and organic food purchases[32,33]. Thus, we hypothesize that PC uniquely enhances the TPB framework by explaining variance in SN that originates from institutional, rather than purely interpersonal, sources:
H6: PC has a significant positive effect on SN.
GPV is defined as a consumer’s overall assessment of the net benefit of a product or action, based on perceptions of its environmental, functional, and emotional utility in relation to its costs[34]. We introduce GPV as a direct predictor of BI because participation in a DRS involves a clear trade-off: a small economic cost (the initial deposit) and logistical effort versus environmental and potential psychological benefits.
The standard TPB constructs may not fully capture this cost-benefit calculus. GPV serves this distinct conceptual role by representing the consumer’s final integrative judgment of “whether it is worth it”. A high GPV, where the environmental and ethical benefits outweigh the perceived costs, is expected to directly and positively influence the intention to participate, over and above the influences of AT, SN, and PBC[35]. This construct is particularly critical in a DRS context, as it helps explain why consumers with similar attitudes and social norms might differ in their intentions based on their personal valuation of the “green” outcome[36,37]. Therefore, we hypothesize:
H7: GPV has a significant positive effect on BI.
METHODOLOGY
Survey design
The flow structure of the questionnaire is shown in Figure 2. The questionnaire consists of three distinct sections: (1) socio-economic characteristics and basic information of the respondents (age, gender, education, income, family size); (2) BIs and attitudes of the respondents towards DRS (including EC, EE, PC, and GPV); and (3) capturing the respondents’ WTP for DRS.
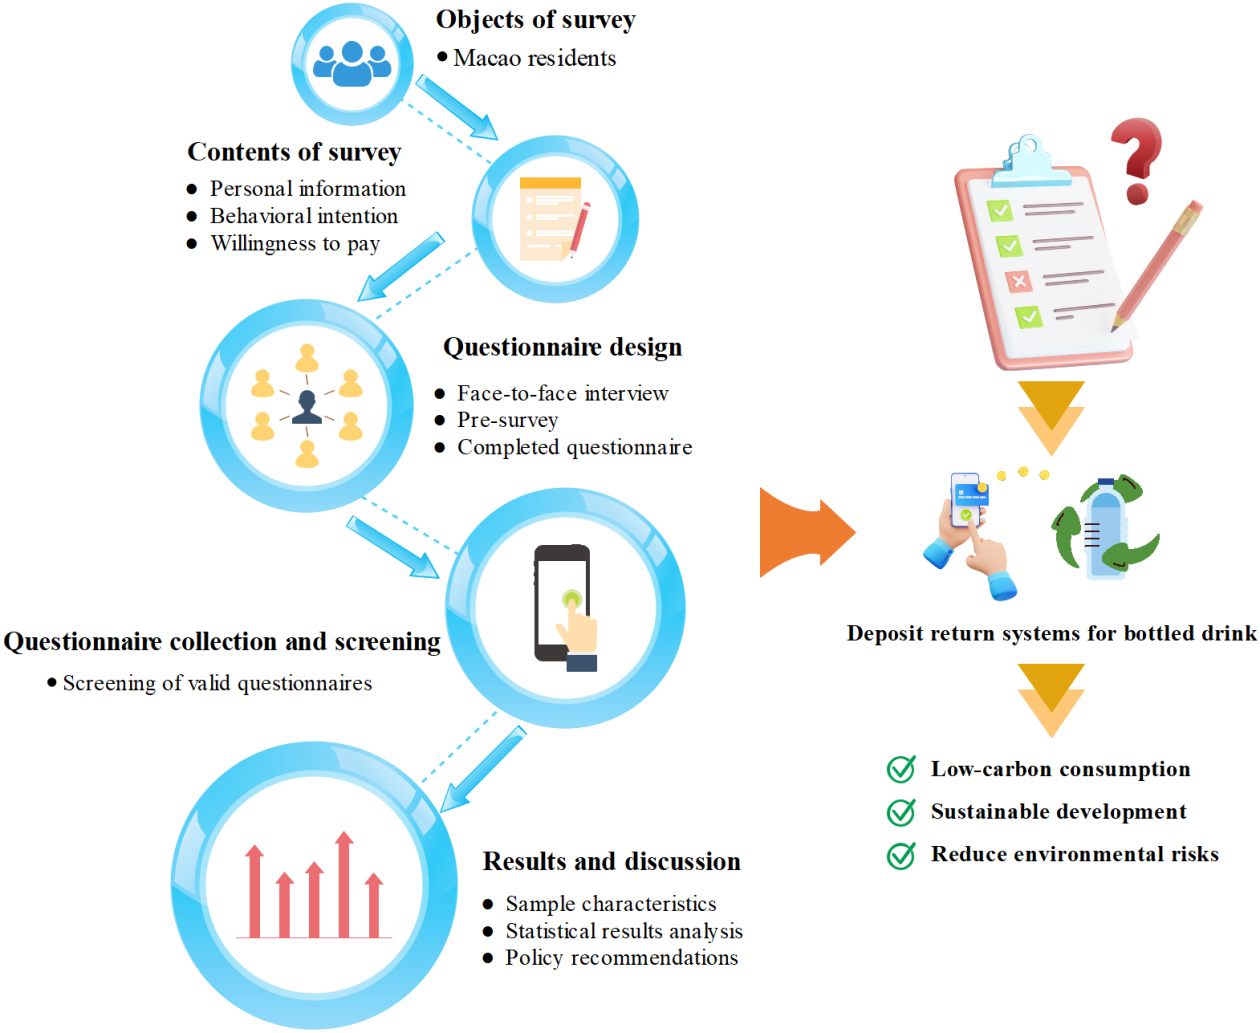
Figure 2. The main structure of the questionnaire survey.
The questionnaire was meticulously crafted, drawing upon established, validated, and reliable scales from existing literature, and tailored to align with the objectives of this study [Table 1]. A 5-point Likert scale served as the evaluative framework, with responses ranging from 1 (strongly disagree) to 5 (strongly agree), capturing the gradations of participant sentiment. The three-item EC scale was adapted from Drescher et al.[24] and Vázquez et al.[25], while measures of EE were derived from Lavuri et al.[27] and Huang et al.[29]. Items addressing PC were informed by Filho et al.[38] and Fu et al.[32]. Constructs related to GPV were formulated based on Shashi et al.[36] and Yue et al.[37]. The constructs of AT, SN, PBC, and BI were drawn from the works of Zhao et al.[14] and Srivastava et al.[18].
Constructs and measurement items
| Potential variables | Observation variables | Measurement items | Key references |
| Environmental concern (EC) | EC1 | You will make efforts to protect the environment and reduce the waste of resources | [24,25] |
| EC2 | Your environmentally friendly behavior will improve the quality of the ecological environment | ||
| EC3 | You think that deposit return systems (DRS) can help improve the recovery rate of resources, save resources and protect the environment | ||
| Environmental emotion (EE) | EE1 | If you choose DRS, you will be proud of your behavior | [27,29] |
| EE2 | If your relatives or friends choose DRS, you will appreciate their behavior | ||
| EE3 | If you choose DRS, you’ll be happy with your behavior | ||
| Policy cognition (PC) | PC1 | You know that the “Extended Producer Responsibility System” and the “Deposit Return System” are important environmental policies | [32,38] |
| PC2 | You know that some countries in the world have carried out the recovery deposit model of beverage bottles | ||
| PC3 | You are aware of Macao’s policies on the management of plastic products, such as “Restrictions on the supply of plastic bags” | ||
| PC4 | You know or have experienced the smart recycling machine (used to recycle beverage bottles and get certain environmental Fun points) set up by the Macao Environmental Protection Bureau | ||
| Green perceived value (GPV) | GPV1 | You endorse DRS because this behavior is more ecologically conscious | [36,37] |
| GPV2 | You endorse the DRS because it is environmentally friendly behavior | ||
| GPV3 | You endorse the DRS because it is more environmentally friendly | ||
| Attitude (AT) | AT1 | DRS is a great pleasure for you | [14,18] |
| AT2 | DRS is a very valuable thing for you | ||
| AT3 | DRS is a very positive thing for you | ||
| AT4 | DRS is a very popular thing for you | ||
| Subjective norm (SN) | SN1 | When your relatives or friends suggest choosing DRS, you will agree | |
| SN2 | When your relatives or friends choose DRS, you will choose to pay the same as them | ||
| SN3 | When you actively choose DRS, your relatives or friends will recognize your behavior | ||
| Perceptual behavior control (PBC) | PBC1 | You can make independent decisions about DRS | |
| PBC2 | You have the ability to choose DRS | ||
| PBC3 | You will definitely choose DRS when you have the intention to pay | ||
| Behavioral intention (BI) | BI1 | You are willing to choose the DRS | |
| BI2 | You would strive to do so by choosing the DRS | ||
| BI3 | You would advise your loved ones or friends to choose DRS | ||
| BI4 | You will choose DRS in the future |
Data collection
To ensure methodological rigor, a preliminary survey was conducted to refine the questionnaire. This pilot study involved a demographically diverse cohort of 30 students and office workers, achieving a 100% response rate and 90% validity rate. Insights from this phase informed the final questionnaire design. The main data collection was carried out from November 2022 to January 2023. To enhance the representativeness of the sample and mitigate the limitations of any single sampling method, a hybrid stratified convenience sampling approach was employed, combining online and offline channels. Offline sampling and recruitment: In-person surveys were conducted at high-traffic public locations across Macao, including shopping centers, public parks, and transit hubs. The selection of these sites aimed to capture a diverse range of residents engaged in routine activities. Interviewers systematically approached potential respondents at different times of the day and days of the week to vary the sample. Participation was voluntary, and anonymity was assured. Online sampling and recruitment: The online survey was distributed via the Questionnaire Star platform. To target residents of Macao specifically, two primary measures were implemented: (1) IP address geolocation restrictions limited participation to devices within Macao, and (2) the survey link was disseminated through community forums and social media groups popular among Macao residents to enhance reach within the target population. Technical measures prevented multiple submissions from the same device. Following the approach of Xiao et al.[39], the minimum required sample size was calculated to be 385, based on a 95% confidence level, a 5% margin of error, and a conservative population proportion of 0.5. After adjusting for a finite population, the target was 322. To account for an anticipated 80% response rate, approximately 403 questionnaires needed to be distributed. To ensure a sufficient number of valid responses, 517 questionnaires were disseminated across both channels. Following data collection, rigorous screening procedures - including checks for straight-lining, implausible response times, and multivariate outlier analysis[14] - were applied. This resulted in 446 valid responses. The sampling strategy of this study aimed to capture a diverse cross-section of Macao residents, with a focus on individuals likely to engage with bottled beverage consumption and recycling systems. The gender distribution is in reasonable alignment with data from the Statistics and Census Bureau of the Macao Special Administrative Region Government (DSEC)[40], indicating good representativeness [Supplementary Table 1]. The age distribution in the sample skews toward the young and middle-aged groups, whereas the age data from the DSEC exhibits a more even distribution. This reflects the deliberate focus of this study on the active consumer groups most relevant to bottled beverage purchasing and recycling behaviors.
Data analysis
Data analyses were conducted using the statistical package for social sciences (SPSS 28) and analysis of moment structures (AMOS 28) software. SPSS 28 was used to test the reliability of measurement items, descriptive analysis, and regression analysis. With AMOS 28, using SEM to test hypothesized relationships. A P-value < 0.05 was considered statistically significant[13].
Structural equation model
To illuminate the interplay among pivotal determinants of DRS, a structural equation model (SEM) integrating latent variables was developed. This approach facilitates the concurrent estimation of multiple interdependent relationships, while providing a robust quantitative evaluation of the model’s overall fit.
(1) Measurement model
Confirmatory factor analysis, a cornerstone of the measurement model, affirms the structural integrity of latent constructs as manifested through their corresponding observed variables. The relationship between latent and observed variables is given as follows:
where X denotes the vector of observed exogenous variables, while Y represents the vector of observed endogenous variables. The matrix λx captures the loadings between observed and latent exogenous constructs, and λy reflects the corresponding relationships for endogenous constructs. Latent exogenous variables are denoted by ξ, and latent endogenous variables by η. Measurement errors associated with X and Y are represented by the vectors δ and ε, respectively.
(2) Structural model
Within the domain of structural modelling, regression and path analyses form the bedrock for elucidating the complex interdependencies among latent constructs. Concurrently, the measurement model unveils the latent variables underpinning the structural framework. This relationship can be expressed as:
where β denotes the coefficient matrix regulating the relationships among endogenous latent constructs; Γ signifies the matrix of coefficients associated with exogenous latent variables; and ζ represents the latent disturbance term inherent to the structural model.
Contingent valuation method
The contingent valuation method (CVM) was utilized to probe respondent behavior within a hypothetical market framework, employing a structured survey to elicit WTP and related pricing considerations.
“Willingness” was gauged through a unidirectional assessment of respondents’ preparedness to commit to a specified monetary amount, as depicted in Figure 3. A single-bounded dichotomous choice CVM algorithm was implemented to estimate the most probable WTP, as expressed by:
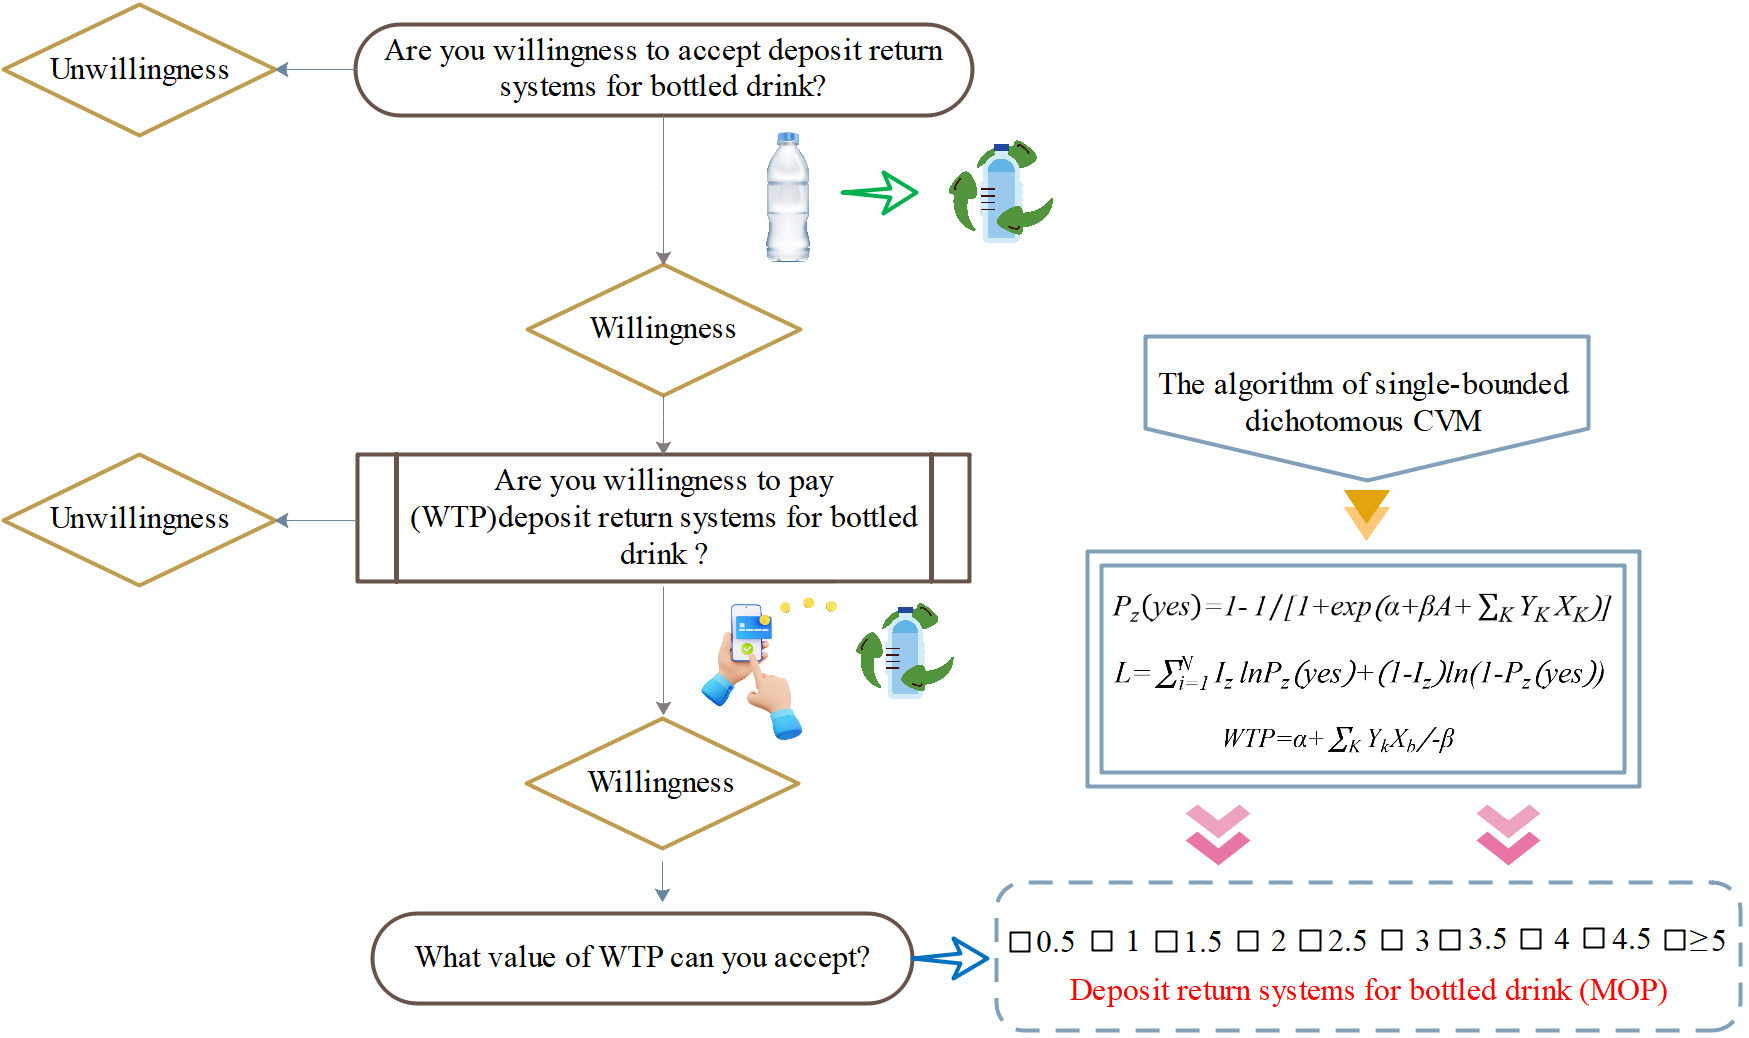
Figure 3. The flow chart of WTP. WTP: Willingness to pay; CVM: contingent valuation method; MOP: Macanese pataca.
Here, Pz denotes the probability that respondent z exhibits WTP; α and β represent the estimated parameters; A corresponds to the bid value presented to respondent z; Xk and Yk is the independent variable.
Assuming that the latent variable Iz reflects respondents’ underlying propensity toward willingness, the corresponding log-likelihood function is expressed as follows:
The parameters denoted by “α” and “β” were estimated using the maximum likelihood method. Accordingly, the mean WTP was computed as follows:
RESULTS
Descriptive statistical analysis
This study explores the socio-economic and demographic profiles of the respondents, as detailed in Figure 4. The data reveal a gender distribution of 43.9% male and 56.1% female, closely reflecting the demographic composition of Macao. Regarding age, the majority of respondents are concentrated within the 20-29 and 30-39 age groups, representing 51.3% and 24.2%, respectively. Moving to monthly income, the largest proportion falls within the brackets of below 9,000 MOP, (26.9%) and 9,000-20,000 MOP (60.1%), with a smaller segment earning between 20,000 and 30,000 MOP (7.4%). In terms of education, the predominant group holds a college qualification (63.2%), followed by those with a high school diploma (19.5%), and a smaller proportion with a master’s degree or higher. Households with five or more members represent the largest share at 32.3%, while those with three or four members account for 28.9% and 29.6%, respectively.
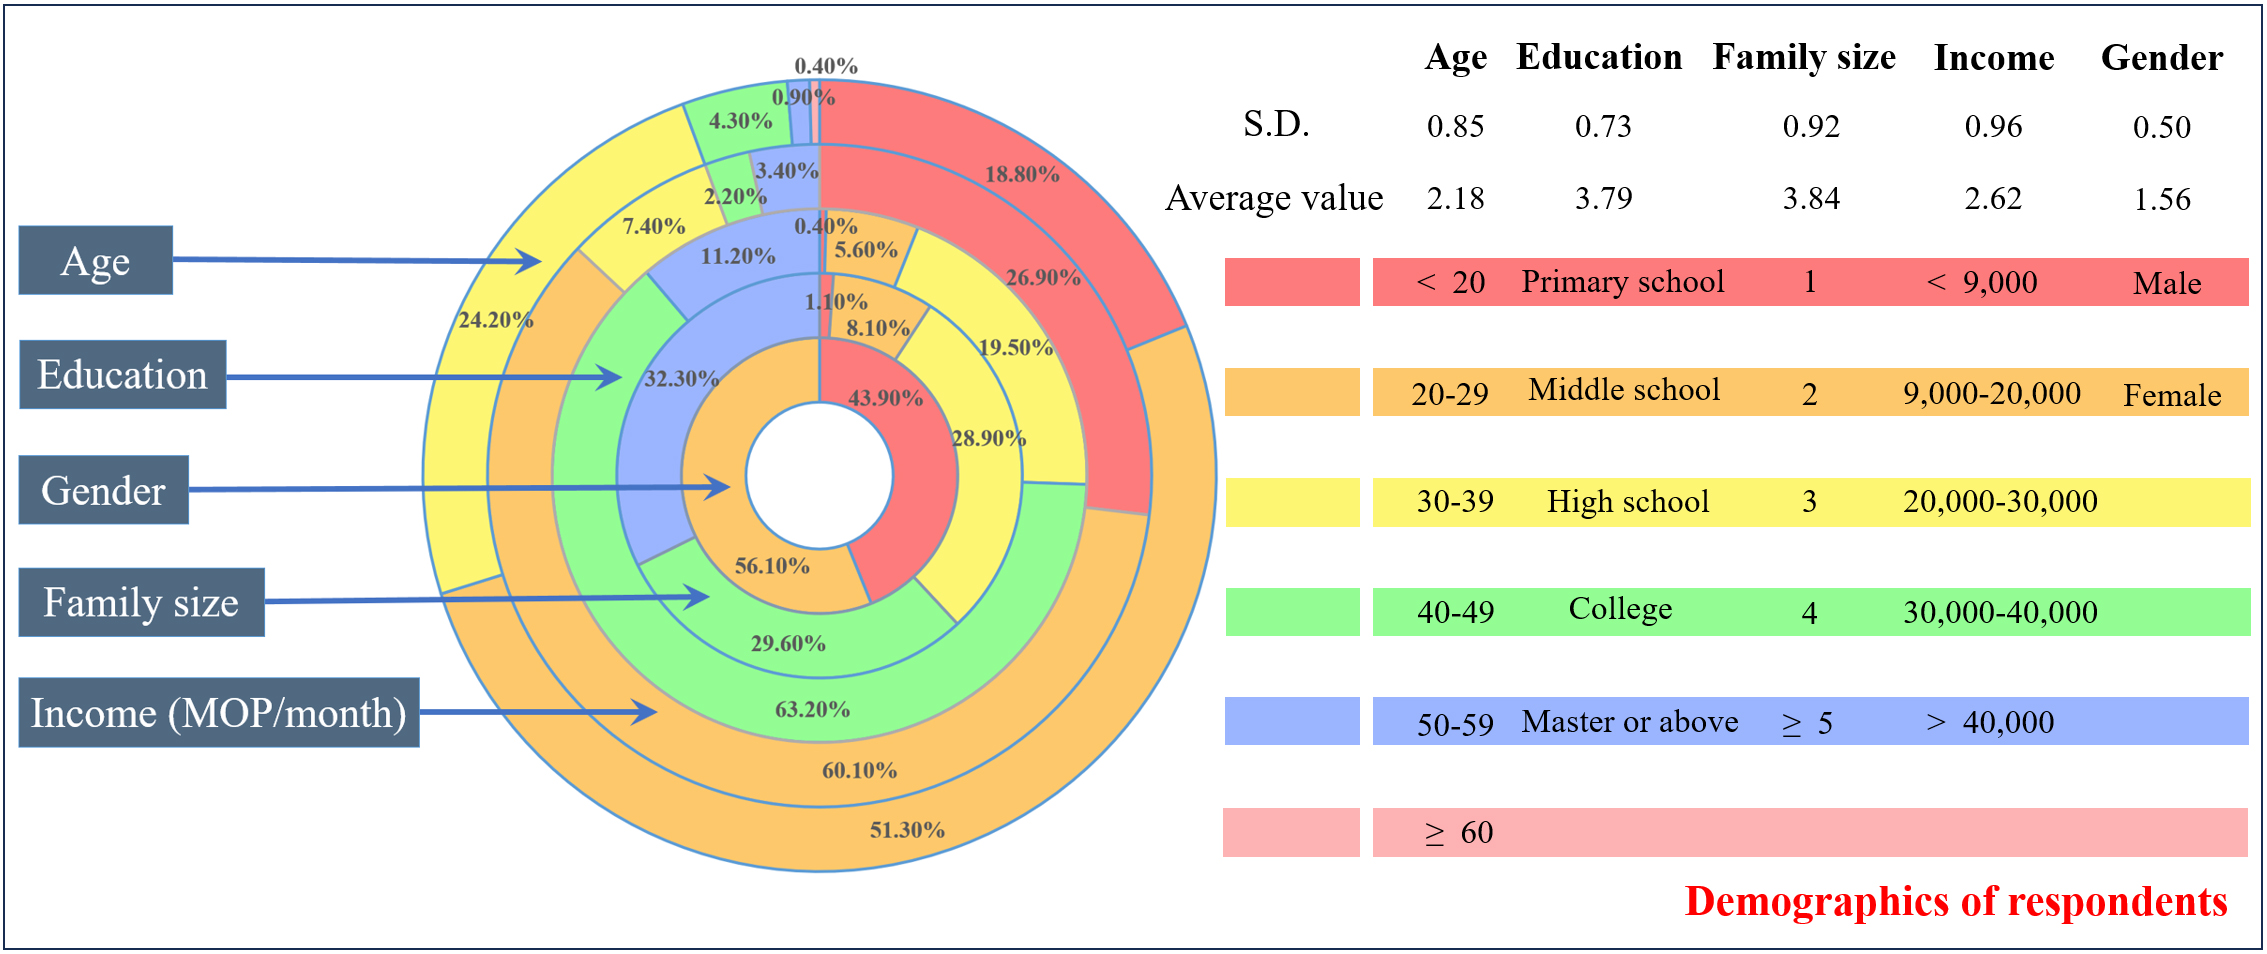
Figure 4. Proportions of personal information for respondents. MOP: Macanese pataca.
Measurement model
Each measurement item had a factor loading higher than 0.5 on its related latent construct. Model fit indices showed the model fit the data well: Chi-square to degrees of freedom ratio (CMIN/DF) = 2.098 (Criteria < 3), root mean square error of approximation (RMSEA) = 0.05 (Criteria < 0.08), comparative fit index (CFI) = 0.971(Criteria > 0.90), Tucker-Lewis Index (TLI) = 0.965 (Criteria > 0.90), Incremental Fit Index (IFI) = 0.971 (Criteria > 0.90), Relative Fit Index (RFI) = 0.935 (Criteria > 0.90), Adjusted Goodness-of-Fit Index (AGFI) = 0.906 (Criteria > 0.90), and Normed Fit Index (NFI) = 0.945 (Criteria > 0.90)[13], all meeting standard criteria. The average variance extracted (AVE) for each construct was above 0.5, which supports construct validity, as shown in Table 2. The composite reliability (CR) for all constructs was above 0.7, confirming the scales were consistent. Data reliability was also confirmed with SPSS 28 using Cronbach’s α, with all scores above 0.7, demonstrating that the measurement scales were strong and dependable.
Confirmatory factor analysis and reliability test
| Latent variable | Observation variable | Factor load | AVE | CR | α | Latent variable | Observation variable | Factor load | AVE | CR | α |
| PC | PC1 | 0.791 | 0.580 | 0.846 | 0.845 | AT | AT1 | 0.894 | 0.785 | 0.936 | 0.936 |
| PC2 | 0.806 | AT2 | 0.878 | ||||||||
| PC3 | 0.759 | AT3 | 0.897 | ||||||||
| PC4 | 0.785 | AT4 | 0.874 | ||||||||
| EC | EC1 | 0.828 | 0.642 | 0.843 | 0.839 | EE | EE1 | 0.853 | 0.735 | 0.848 | 0.848 |
| EC2 | 0.817 | EE2 | 0.862 | ||||||||
| EC3 | 0.757 | EE3 | 0.845 | ||||||||
| SN | SN1 | 0.893 | 0.749 | 0.899 | 0.895 | PBC | PBC1 | 0.812 | 0.686 | 0.867 | 0.868 |
| SN2 | 0.896 | PBC2 | 0.835 | ||||||||
| SN3 | 0.804 | PBC3 | 0.837 | ||||||||
| GPV | GPV1 | 0.896 | 0.768 | 0.908 | 0.908 | BI | BI1 | 0.913 | 0.795 | 0.939 | 0.939 |
| GPV2 | 0.881 | BI2 | 0.903 | ||||||||
| GPV3 | 0.851 | BI3 | 0.866 | ||||||||
| BI4 | 0.884 |
Structural model
As shown in Table 3, all hypothesized relationships were statistically validated at significance thresholds of
Structural path analysis
| Hypothesis | Path | Effect size | S.E. | C.R. | P | Std. (β) | R2 | Supported |
| H1 | AT → BI | 0.512 | 0.043 | 11.863 | *** | 0.498 | 0.774 | Yes |
| H2 | SN → BI | 0.104 | 0.05 | 2.084 | *** | 0.101 | Yes | |
| H3 | PBC → BI | 0.118 | 0.082 | 1.447 | *** | 0.105 | Yes | |
| H4 | EC → AT | 0.554 | 0.132 | 4.199 | *** | 0.403 | 0.66 | Yes |
| H5 | EE → AT | 0.508 | 0.128 | 11.795 | *** | 0.238 | Yes | |
| H6 | PC → SN | 0.912 | 0.065 | 14.099 | *** | 0.812 | 0.895 | Yes |
| H7 | GPV → BI | 0.351 | 0.086 | 4.066 | *** | 0.299 | 0.774 | Yes |
Determinants of WTP for DRS
Respondents’ WTP plays a pivotal role in the establishment of DRS. Of the surveyed population, 367 individuals - representing approximately 82.3% of the sample - expressed a readiness to incur additional costs in support of DRS implementation. However, 17.7% of respondents were reluctant to accept DRS. Among them, the main concerns of the respondents included whether the designated recycling sites were popular, convenient, and smooth (67.10%); whether the government has issued corresponding laws, regulations, and policy support (51.90%); accepting DRS will increase daily workload and bring inconvenience to a certain extent (50.60%); lack of existing infrastructure, it is difficult to be really beneficial to the environment (41.80%); and little knowledge of relevant information (38%). To further elucidate respondents’ WTP valuations for DRS and the underlying determinants, a linear regression analysis was conducted, as illustrated in Figure 5.
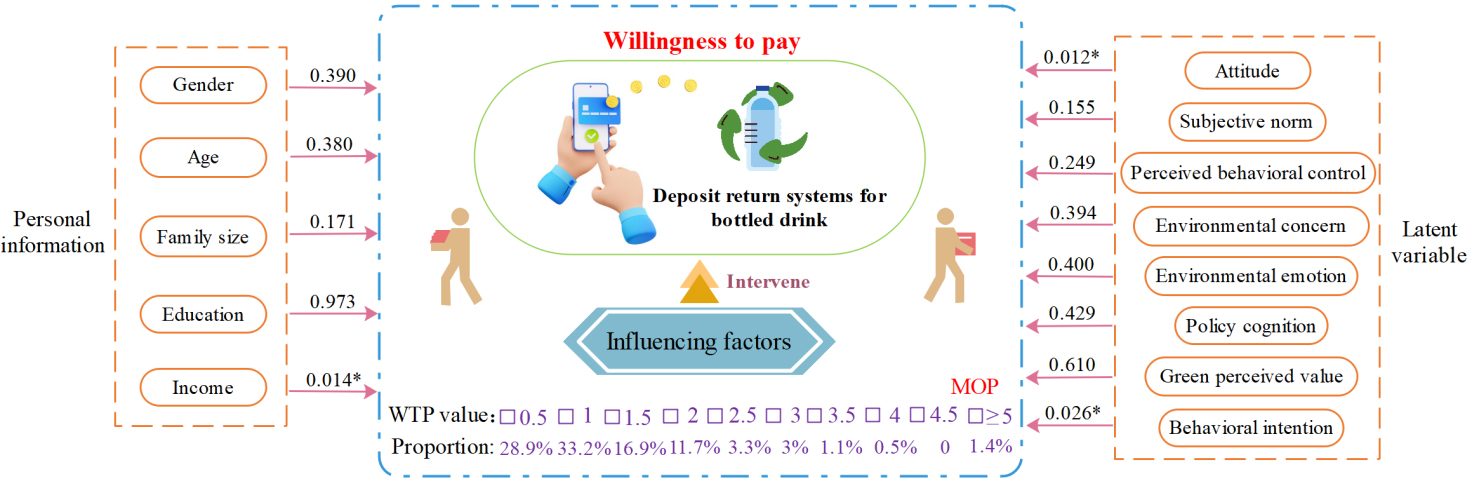
Figure 5. Determinants of WTP value for DRS. WTP: Willingness to pay; DRS: deposit-refund systems; MOP: Macanese pataca. * is the significant level; * P-value < 0.05.
Respondents’ WTP values were predominantly clustered around 1 MOP, comprising 33.20% of the sample, followed by 0.5 MOP at 28.90%. The mean WTP value was 1.26 MOP. Notably, WTP was significantly influenced by several factors, including income, AT, and BI. Among demographic variables, income emerged as the most salient predictor (P < 0.05), indicating that individuals with higher income levels demonstrated a greater propensity to invest in DRS. Regarding latent constructs, AT and BI exhibited the strongest associations with WTP (P < 0.05), underscoring the critical role of AT and behavioral predispositions. These findings suggest that governmental initiatives should prioritize public education campaigns aimed at fostering more favorable consumer attitudes toward the DRS of bottled beverages, thereby enhancing public engagement with DRS schemes. Intriguingly, SN and PBC were not found to exert significant influence on WTP, diverging from initial expectations. The main reason may be that the decision to pay a monetary deposit (WTP) is fundamentally different from the BI to physically return bottles. While PBC (e.g., perceived convenience) might directly affect the latter, the former is a broader endorsement of the system’s principle, driven more by internal attitudes than by perceptions of ease. Second, the influence of SN might be attenuated in contexts where the behavior has a strong personal and financial component. In the case of WTP for DRS, individuals may rely more on their own cost-benefit analysis and environmental values than on social pressures. This could be particularly relevant in Macao’s cosmopolitan urban setting, where consumer behavior is often highly individualized. Finally, if the proposed DRS is perceived as a well-defined and government-backed system, individuals might assume that the necessary infrastructure (ease of use) will be provided, thereby diminishing the explanatory power of PBC in their WTP.
DISCUSSION
Key determinants for DRS intention
The foregoing analysis reveals that AT is positively correlated with both EE and EC, buttressing the notion that consumers - recognizing the multifaceted benefits of DRS in addressing diverse needs, curbing environmental degradation, and enhancing public health - are predisposed to develop favorable attitudes toward its adoption. Collectively, EE and EC account for 66.0% of the variance in AT. Further scrutiny of the regression coefficient β indicates that EC exerts a stronger influence on AT than EE, with a β value of 0.403 compared to 0.238 for EE. This implies that a one-unit increase in EC amplifies AT toward DRS by 0.403 units, surpassing the effect of EE. These findings suggest that respondents are motivated to safeguard the environment and minimize resource waste, with their degree of EC significantly shaping their willingness to invest in DRS. Meanwhile, younger and well-educated demographics often exhibit stronger
In terms of BI, the pivotal role of attitude in shaping DRS adoption was affirmed, suggesting that favorable perceptions significantly foster individuals’ intentions to adopt the system - an observation consistent with Han et al.[41]. In contrast, Ben-Othmen and Kavouras contend that consumer behavior is predominantly mediated through specific attitudinal pathways, with personal characteristics exerting minimal direct influence[42]. This indicates that when respondents purchase bottled drinks, if they hold a positive attitude toward DRS and perceive it as beneficial to the ecological environment, it will largely determine whether they pay the DRS deposit. If the attitude and GPV of Macao residents increase by 1 unit, their BI will increase by 0.498 and 0.299 units, respectively. Therefore, improving the GPV and AT of Macao residents for DRS has an important impact on promoting better implementation of the system.
WTP value comparison with other studies
In a market-oriented economy, the development of sustainable consumption systems constitutes a shared responsibility among stakeholders, including governmental authorities and the public. As shown in Table 4, the WTP for DRS in this study was notably lower than that reported in other countries. While environmental awareness is growing globally, the translation of concern into actionable behavior varies widely. In Macao, despite high educational attainment among respondents, EEs and perceived value may not yet be strong enough to override cost sensitivity. In cultures with longer histories of pro-environmental policy and public campaigns - such as Germany or the Netherlands - environmental norms are more deeply embedded, making residents more willing to pay a premium for sustainable systems. Furthermore, DRS is still in a developmental phase in Macao, with no dedicated policy framework. The lack of exposure and tangible benefits may contribute to lower WTP, as residents do not yet perceive the system as mainstream or reliable. This suggests that consumer acceptance may be enhanced through robust advocacy by governments or affiliated institutions. Thus, a nuanced understanding of consumer receptivity is essential to inform evidence-based policymaking. Moreover, price-related concerns surrounding DRS adoption could be mitigated if governments position DRS as a mainstream alternative, simultaneously leveraging its aesthetic and functional value to elevate public appeal.
Comparing the WTP value of different DRS
| Country/Region | Scope | Price | Reference |
| Macao, China | PET | 1.26 MOP | This work |
| Sweden | Refillable PET | $0.56 (4.48 MOP) | [43] |
| Austria | PET bottles expect non-refillable | $0.4 (3.20 MOP) | [44] |
| Germany | Not containers for wine, fruit juice or spirits | $0.28 (2.24 MOP) | |
| Netherlands | Soft drinks water in one-way, refillable glass and PET containers | $0.28 (2.24 MOP) | [45] |
Policy implications
This study provides valuable insights for policymakers, government agencies, and stakeholders in the bottled beverage industry. To ensure the successful implementation of a DRS, we propose a phased approach, progressing from initial efforts to the development of a fully mature and self-sustaining system. The first step involves launching targeted public education campaigns aimed at fostering positive AT and enhancing the GPV, which our findings identify as key factors in driving acceptance. These campaigns should clearly communicate the environmental and economic benefits of DRS, utilizing EC and EE to engage the public. Simultaneously, encouraging market adoption through pilot programs with prominent retailers - such as testing reverse vending machines - can build both practical experience and public familiarity in the short term.
Building on this foundation, medium-term efforts should concentrate on expanding infrastructure and formalizing collaboration among key stakeholders. This includes broadening the network of accessible return points, informed by insights from pilot programs. A critical step involves the establishment of a dedicated DRS coordination body. Initially led by the government and supported by seed funding and producer fees, this entity would be entrusted with concrete operational responsibilities: setting technical standards for collection, overseeing the financial flows of deposits and handling fees, and monitoring system performance. This shifts the concept from a vague institutional idea to a fully functional organization with clearly defined duties.
In the long term, the aim is to evolve this coordinating body into a fully independent, non-profit producer responsibility organization, funded and governed by the beverage industry, with oversight from the government. This final structure reflects the core principle of EPR, placing both the operational and financial burden on producers. To ensure its success, the government must support this system with robust legislation that mandates participation, establishes binding return rate targets, and imposes penalties for non-compliance. Ultimately, the high-quality recycled materials generated by the DRS can be integrated into a broader circular economy strategy, fostering the growth of the recycling industry and closing the loop on packaging waste. This system is poised to deliver significant environmental benefits: a well-implemented DRS could achieve PET collection rates exceeding 90%, potentially reducing the carbon footprint of beverage packaging by 30%-50% through the avoidance of virgin material production and reduced waste incineration. In this way, the DRS would transcend waste management, becoming a vital climate action strategy that directly advances Macao’s sustainable development goals.
Limitations and future research directions
While this study offers valuable insights with substantive implications, several limitations must be acknowledged to inform future research. First, the present analysis focuses on BI toward adopting DRS rather than actual consumer practices. Subsequent studies should therefore seek to capture real-world behavioral patterns in DRS engagement. Second, although this study extends the TPB with additional constructs, it remains essential to consider other influential factors - such as economic incentives, perceived convenience, and product-related perceptions - that may significantly shape consumer adoption. These dimensions warrant further empirical exploration to yield a more holistic understanding. Finally, this study primarily focuses on individuals who may participate in bottled beverage consumption and recycling systems. To enhance the generalizability and policy relevance of the findings, future research should investigate samples more representative of Macao’s age distribution to reflect broader socioeconomic diversity and regional particularities.
CONCLUSIONS
The adoption of environmentally sustainable DRS represents a pivotal strategy for alleviating pollution associated with bottled drinks. While DRS has garnered public interest due to its intrinsic ecological advantages, its successful implementation hinges on broad consumer acceptance. This study extends the TPB by incorporating EC, EE, PC, and GPV to investigate consumer predispositions toward DRS adoption. The results indicate that BI toward DRS is primarily driven by AT, which exerts the strongest influence among all predictors, underscoring the importance of fostering positive perceptions of the system. GPV also emerges as a significant motivator, indicating that consumers are more likely to adopt DRS when they recognize its environmental utility. Second, a majority of respondents (82.3%) expressed WTP for DRS, with a mean value of 1.26 MOP. WTP is significantly shaped by income level, attitude, and BI, whereas social norms and PBC show limited influence - suggesting that financial and personal conviction factors outweigh social or convenience considerations in monetary commitment. From a policy perspective, the most critical message is the need to prioritize communication and education strategies that strengthen consumer attitudes and emphasize the green value of DRS, rather than relying on social pressure or perceived ease of use.
The main contribution of this work lies in empirically validating an enriched TPB model within the context of DRS, revealing the distinct roles of cognitive, economic, and environmental factors in shaping BI and payment willingness. These results provide a theoretical foundation and practical guidance for accelerating the transition toward sustainable packaging systems.
DECLARATIONS
Authors’ contributions
Writing - original draft, writing - review and editing, methodology, software, conceptualization, data curation: Zhao, S.
Software, investigation, formal analysis, data curation: Yuan, Z.
Writing - review and editing, funding acquisition, methodology, software, conceptualization: Song, Q.
Writing - review and editing: Li, J.
Conflicts of interest
Not applicable.
Availability of data and materials
Data will be made available upon request from the corresponding author.
Financial support and sponsorship
This work was supported by the Science and Technology Development Fund, Macao SAR, China (0011/2023/AMJ and 001/2022/NIF).
Ethical approval and consent to participate
Not applicable.
Consent for publication
Not applicable.
Copyright
© The Author(s) 2026.
Supplementary Materials
REFERENCES
1. Borrelle, S. B.; Ringma, J.; Law, K. L.; et al. Predicted growth in plastic waste exceeds efforts to mitigate plastic pollution. Science 2020, 369, 1515-8.
2. NBSC. 2022. China Statistical Yearbook. https://data.stats.gov.cn/easyquery.htm?cn=C01 (2022) (accessed 2025-12-30).
3. Czine, P.; Gorton, M.; Bauerné Gáthy, A.; et al. Bottling it? Consumer responses to less environmentally friendly products: a choice experiment for water in plastic packaging in the UK. J. Environ. Manage. 2025, 373, 123649.
4. Tariq, G.; Sun, H.; Ali, S. Environmental footprint impacts of green energies, green energy finance and green governance in G7 countries. Carbon. Footprints. 2024, 3, 5.
5. Chatterjee, D.; Barbhuiya, M. R. Bottled water usage and willingness to pay among Indian tourists: visual nudges and the theory of planned behaviour. Scand. J. Hosp. Tour. Res. 2021, 21, 531-49.
6. Marchi, E.; Pigliafreddo, S.; Banterle, A.; Parolini, M.; Cavaliere, A. Plastic packaging goes sustainable: an analysis of consumer preferences for plastic water bottles. Environ. Sci. Pol. 2020, 114, 305-11.
7. Galati, A.; Alaimo, L. S.; Ciaccio, T.; Vrontis, D.; Fiore, M. Plastic or not plastic? That’s the problem: analysing the Italian students purchasing behavior of mineral water bottles made with eco-friendly packaging. Resour. Conserv. Recycl. 2022, 179, 106060.
8. Herrmann, C.; Rhein, S.; Sträter, K. F. Consumers’ sustainability-related perception of and willingness-to-pay for food packaging alternatives. Resour. Conserv. Recycl. 2022, 181, 106219.
9. Kokthi, E.; Thoma, L.; Saary, R.; Kelemen-Erdos, A. Disconfirmation of taste as a measure of trust in brands: an experimental study on mineral water. Foods 2022, 11, 1276.
10. Wensing, J.; Caputo, V.; Carraresi, L.; Bröring, S. The effects of green nudges on consumer valuation of bio-based plastic packaging. Ecol. Econ. 2020, 178, 106783.
11. Xu, Y. C.; Ward, P. S. Environmental attitudes and consumer preference for environmentally-friendly beverage packaging: the role of information provision and identity labeling in influencing consumer behavior. Front. Agric. Sci. Eng. 2023, 10, 95-108.
12. Van Loo, E. J.; Grebitus, C.; Roosen, J. Explaining attention and choice for origin labeled cheese by means of consumer ethnocentrism. Food. Qual. Prefer. 2019, 78, 103716.
13. Zhao, S.; Tan, Q.; Li, Y.; Li, J. Revealing determinants shaping the sustainable consumption of single-use plastic food container substitutes. Environ. Impact. Asses. Rev. 2025, 110, 107670.
14. Zhao, S.; Duan, W.; Zhao, D.; Song, Q. Identifying the influence factors of residents’ low-carbon behavior under the background of “carbon neutrality”: an empirical study of Qingdao city, China. Energy. Rep. 2022, 8, 6876-86.
15. Chen, X.; Zhen, S.; Li, S.; Yang, J.; Ren, Y. Consumers' willingness to pay for carbon-labeled agricultural products and its effect on greenhouse gas emissions: evidence from beef products in urban China. Environ. Impact. Asses. Rev. 2024, 106, 107528.
16. Masrahi, A.; Wang, J.; Abudiyah, A. K. Factors influencing consumers’ behavioral intentions to use renewable energy in the United States residential sector. Energy. Rep. 2021, 7, 7333-44.
17. Wang, Y.; Zhang, Z.; Xu, Y.; Li, R.; Chen, W. Motivation, preference, and willingness of Chinese consumers to purchase carbon-labeled eggs. Carbon. Footprints. 2025, 4, 10.
18. Srivastava, S. K.; Mishra, A.; Singh, S.; Jaiswal, D. Household food waste and theory of planned behavior: a systematic review and meta-analysis. Environ. Sci. Pollut. Res. 2023, 30, 97645-59.
19. Baah, C.; Saleem, M. A.; Greenland, S.; Tenakwah, E. S.; Chakrabarty, D. Do the theories of planned behaviour and protection motivation provide probabilistic sufficient and necessary conditions for residential water conservation? Combined use of PLS-SEM and NCA. J. Environ. Manage. 2024, 372, 123354.
20. Patel, S.; Parkins, J. R. Assessing motivations and barriers to renewable energy development: Insights from a survey of municipal decision-makers in Alberta, Canada. Energy. Reports. 2023, 9, 5788-98.
21. Okur, Ö.; Fiori, F.; Fouladvand, J. Adoption of renewable heating systems and thermal energy communities in the Netherlands: an empirical study. Energy. Rep. 2024, 11, 3815-23.
22. Wang, Q.; Ren, Y.; Liu, X.; Chang, R.; Zuo, J. Exploring the heterogeneity in drivers of energy-saving behaviours among hotel guests: Insights from the theory of planned behaviour and personality profiles. Environ. Impact. Asses. Rev. 2023, 99, 107012.
23. Fu, X.; Liu, G.; Wu, H.; et al. Dissecting behavioral inertia in shaping different resident participation behaviors in neighborhood regeneration: a quantitative behavioral experiment. Environ. Impact. Asses. Rev. 2024, 109, 107632.
24. Drescher, M.; Kim, Y. H.; Warriner, G. K. Private landowners’ childhood nature experiences affect their feelings of connectedness-to-nature and land stewardship as adults. Biol. Conserv. 2022, 274, 109713.
25. Vázquez, J.; Lanero, A.; García, J. A.; Moraño, X. Segmentation of consumers based on awareness, attitudes and use of sustainability labels in the purchase of commonly used products. Sustain. Prod. Consump. 2023, 38, 115-29.
26. Kushwah, S.; Gokarn, S.; Ahmad, E.; Pant, K. K. An empirical investigation of household's waste separation intention: a dual-factor theory perspective. J. Environ. Manage. 2023, 329, 117109.
27. Lavuri, R.; Roubaud, D.; Grebinevych, O. Sustainable consumption behaviour: mediating role of pro-environment self-identity, attitude, and moderation role of environmental protection emotion. J. Environ. Manage. 2023, 347, 119106.
28. Wöhler, J.; Haase, E. Exploring investment processes between traditional venture capital investors and sustainable start-ups. J. Clean. Prod. 2022, 377, 134318.
29. Huang, H.; Long, R.; Chen, H.; Li, Q.; Wu, M.; Gan, X. Knowledge domain and research progress in green consumption: a phase upgrade study. Environ. Sci. Pollut. Res. 2022, 29, 38797-824.
30. Wang, Z.; Zhao, C.; Yin, J.; Zhang, B. Purchasing intentions of Chinese citizens on new energy vehicles: How should one respond to current preferential policy? J. Clean. Prod. 2017, 161, 1000-10.
31. Lin, B.; Qiao, Q. Exploring the acceptance of green electricity and relevant policy effect for residents of megacity in China. J. Clean. Prod. 2022, 378, 134585.
32. Fu, W.; Zhou, Y.; Li, L.; Yang, R. Understanding household electricity-saving behavior: Exploring the effects of perception and cognition factors. Sustain. Prod. Consump. 2021, 28, 116-28.
33. Basha, M. B.; Lal, D. Indian consumers’ attitudes towards purchasing organically produced foods: an empirical study. J. Clean. Prod. 2019, 215, 99-111.
34. Hamzah, M. I.; Tanwir, N. S. Do pro-environmental factors lead to purchase intention of hybrid vehicles? The moderating effects of environmental knowledge. J. Clean. Prod. 2021, 279, 123643.
35. Ahmad, W.; Zhang, Q. Green purchase intention: effects of electronic service quality and customer green psychology. J. Clean. Prod. 2020, 267, 122053.
36. Shashi.; Centobelli, P.; Cerchione, R.; Jhamb, D. Double-edged circularity: comparative assessment of circular and non-circular consumers. Ecol. Econ. 2023, 212, 107931.
37. Yue, T.; Liu, J.; Long, R.; et al. Effects of perceived value on green consumption intention based on double-entry mental accounting: taking energy-efficient appliance purchase as an example. Environ. Sci. Pollut. Res. 2021, 28, 7236-48.
38. Filho, M.; Gonella, J. D. S. L, Latan, H.; Ganga, G. M. D. Awareness as a catalyst for sustainable behaviors: a theoretical exploration of planned behavior and value-belief-norms in the circular economy. J. Environ. Manage. 2024, 368, 122181.
39. Xiao, H.; Xie, W.; Liu, B. An empirical study on the influence of new generation employees’ job satisfaction on contextual performance in the energy industry. Heliyon 2024, 10, e30073.
40. DSEC (Statistics and Census Service of Macao), 2024. Yearbook of Statistics. Macao Statistics and Census Service, Macao. https://www.dsec.gov.mo/zh-CN/ (accessed 2025-12-30).
41. Han, Y.; Cheng, J.; An, D.; He, Y.; Tang, Z. Occurrence, potential release and health risks of heavy metals in popular take-out food containers from China. Environ. Res. 2022, 206, 112265.
42. Ben-Othmen, M. A.; Kavouras, J. H. Exploring the nexus of food citizenship and local food consumption in America’s rural-urban blend: insights from Will County (Illinois). J. Rural. Stud. 2024, 109, 103323.
43. Reloop. Deposit systems for one-way beverage containers: global overview. 2016. https://www.reloopplatform.org/resources/global-deposit-2016/?utm_source (accessed 2025-12-30).
44. Zhou, G.; Gu, Y.; Wu, Y.; et al. A systematic review of the deposit-refund system for beverage packaging: operating mode, key parameter and development trend. J. Clean. Prod. 2020, 251, 119660.
Cite This Article
How to Cite
Download Citation
Export Citation File:
Type of Import
Tips on Downloading Citation
Citation Manager File Format
Type of Import
Direct Import: When the Direct Import option is selected (the default state), a dialogue box will give you the option to Save or Open the downloaded citation data. Choosing Open will either launch your citation manager or give you a choice of applications with which to use the metadata. The Save option saves the file locally for later use.
Indirect Import: When the Indirect Import option is selected, the metadata is displayed and may be copied and pasted as needed.
About This Article
Copyright

Data & Comments
Data
0


Comments
Comments must be written in English. Spam, offensive content, impersonation, and private information will not be permitted. If any comment is reported and identified as inappropriate content by OAE staff, the comment will be removed without notice. If you have any queries or need any help, please contact us at [email protected].