

Indirect carbon emissions of enhanced weathering in Malaysia
 0
0 Abstract
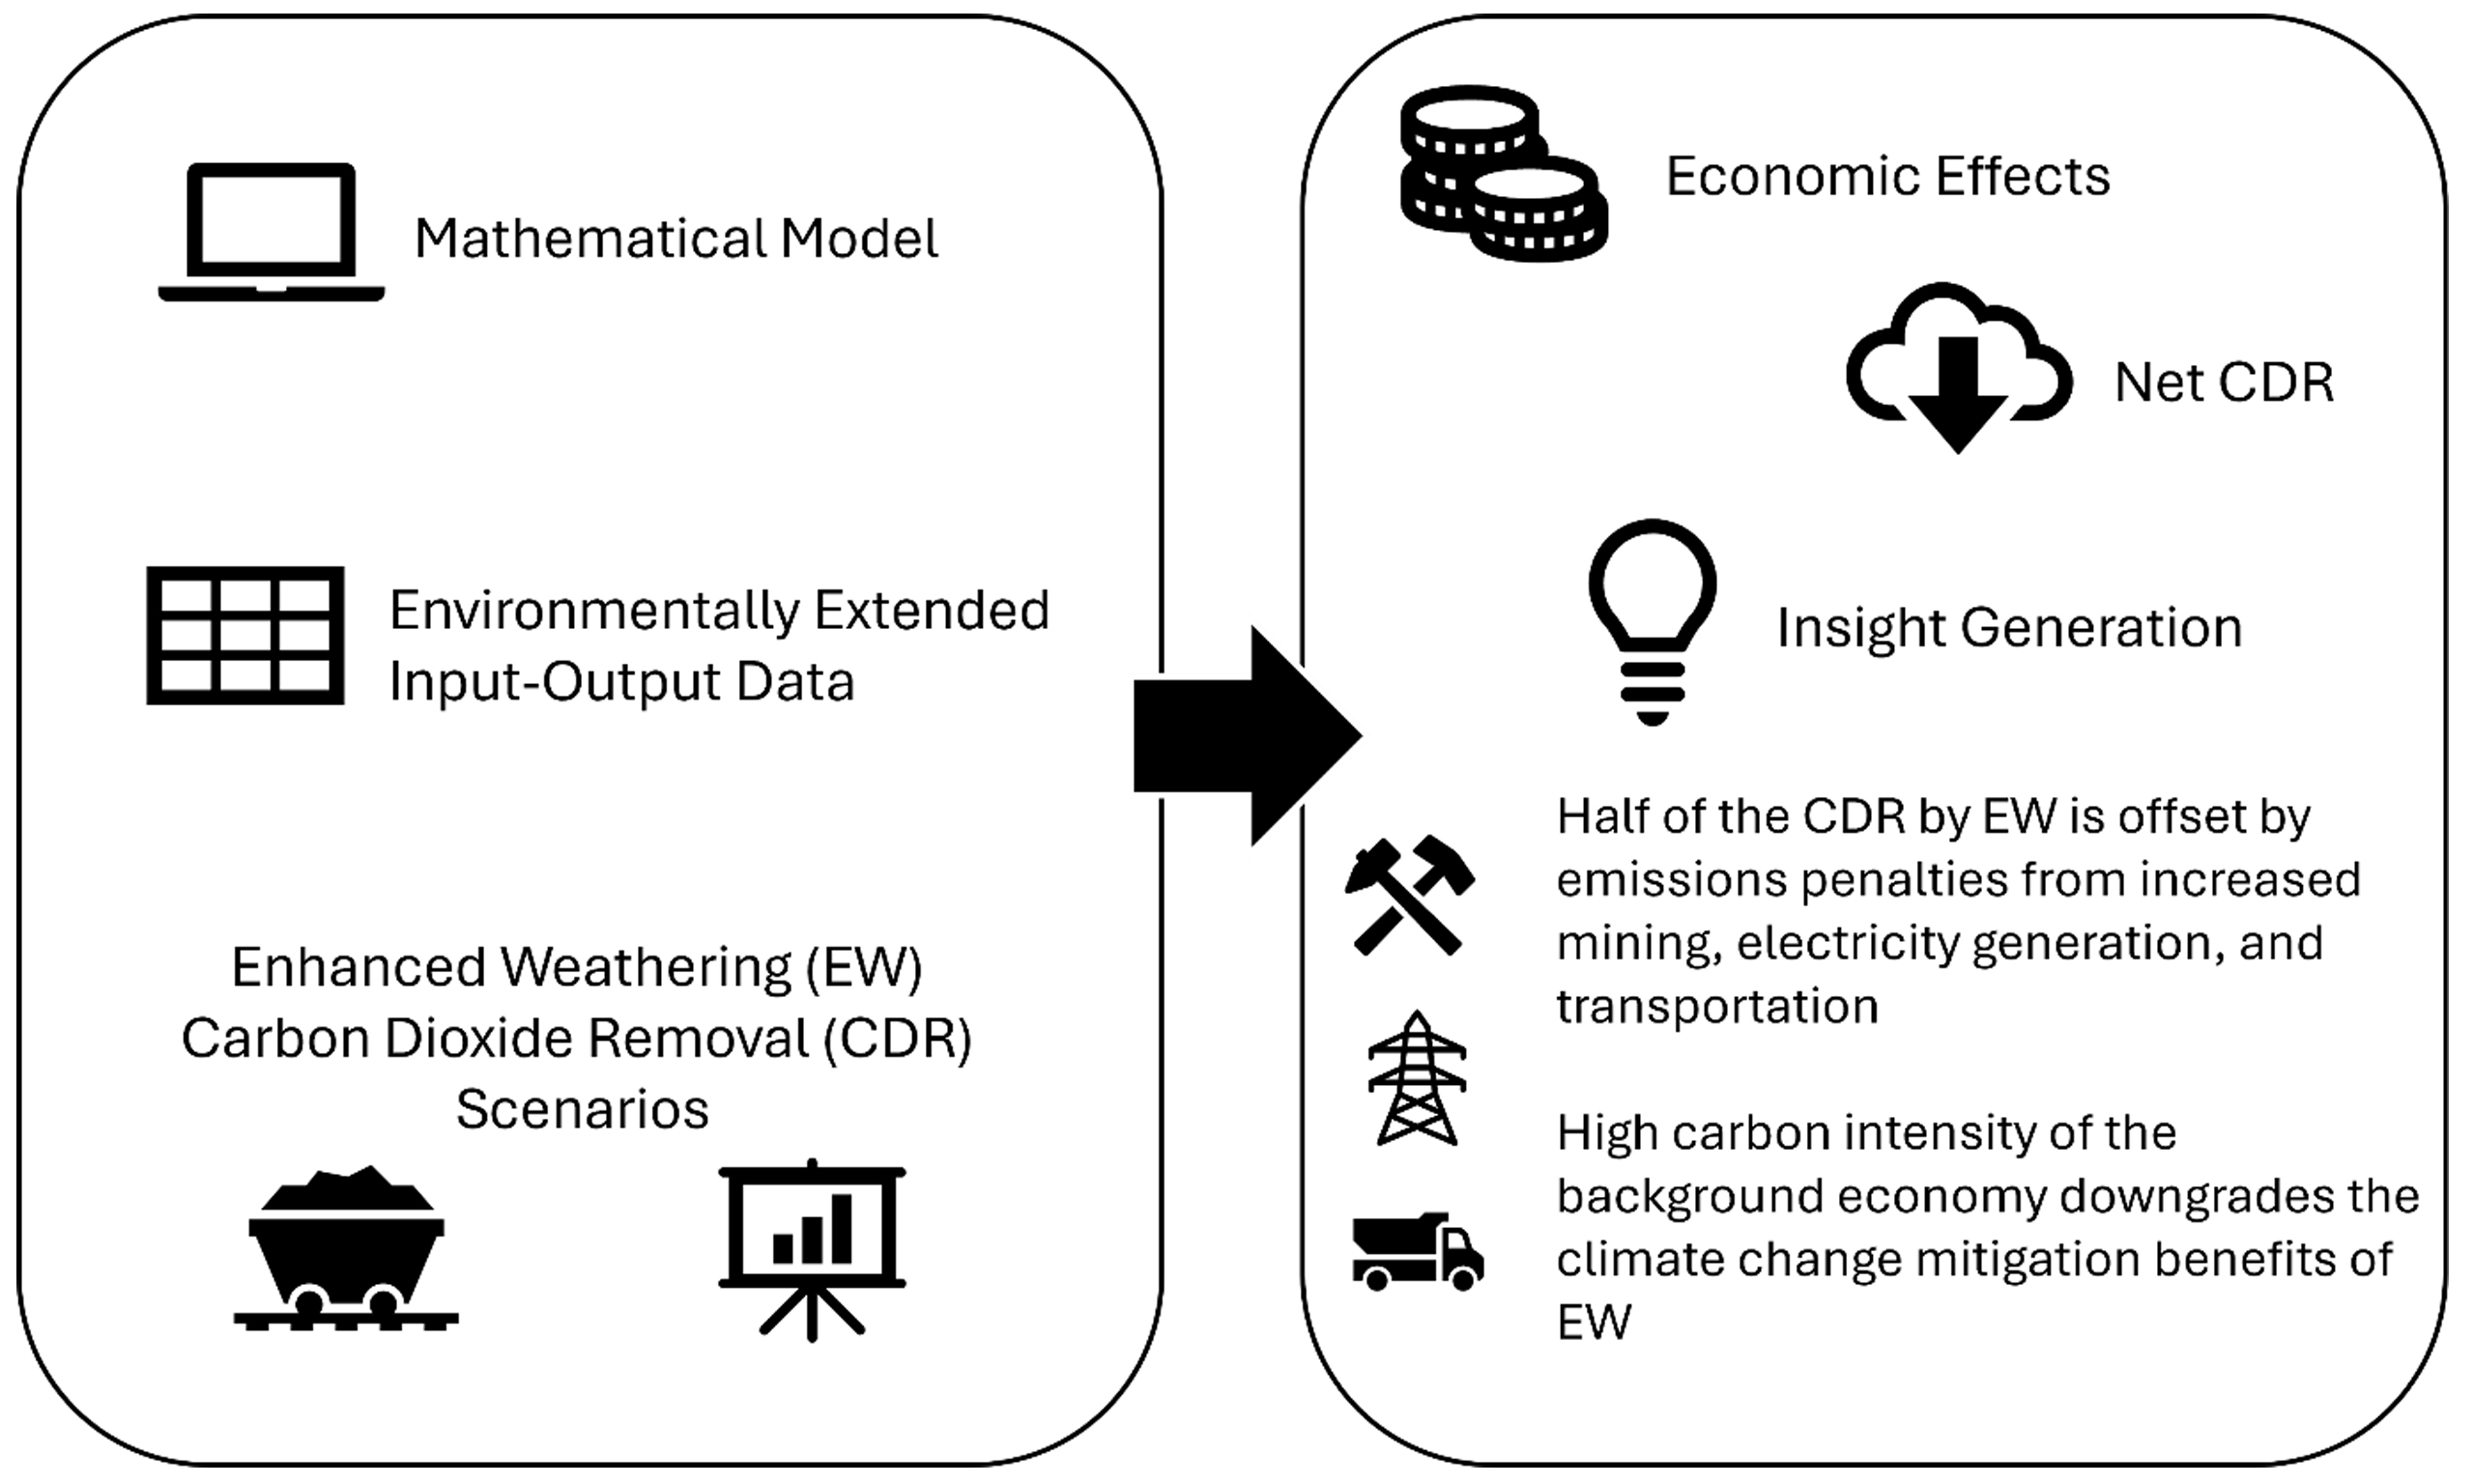
Enhanced weathering (EW) of rocks and minerals can be used as a carbon dioxide removal (CDR) technique. EW relies on accelerated geochemical reactions between carbonic acid in rainwater and slightly alkaline minerals to permanently sequester carbon atoms as bicarbonate ions in runoff water. The material needs to be crushed into a fine powder to increase its reactive surface area and then spread on land at a rate calibrated to local weather and soil conditions. However, large-scale EW using virgin material will increase outputs and carbon footprints across various economic sectors to support the CDR system. Input-output analysis is used to model such indirect effects when basalt EW is used in all oil palm plantations in Malaysia to cut greenhouse gas emissions. Results at a fixed electricity carbon intensity show that about half of the direct CDR will be offset by incremental carbon footprints from the mining, electricity generation, and transportation sectors due to the requirements of EW operations; total greenhouse gas emissions are reduced by up to 11.0% to 213.7 Mt CO2 equivalent (CO2e)/y. Cutting the carbon intensity of electricity supply in half reduces emissions further to 126.9 Mt CO2e/y. The scenario analyses demonstrate the synergy between renewable energy deployment and EW implementation, supporting the development of carbon management policies in Malaysia.
Keywords
INTRODUCTION
Greenhouse gas (GHG) emissions need to be eliminated by mid-century to limit climate change to a safe level. Carbon dioxide (CO2) removal (CDR) techniques, also known as negative emissions technologies (NETs), will be needed to offset residual GHG emissions from sectors that cannot be decarbonised completely due to technical or economic constraints; they are expected to play a critical role in the mitigation of carbon footprints of economic sectors and goods[1]. CDR is also projected to develop into a distinct economic sector linked to the industrial supply chains of carbon-intensive products and services[2]. NETs rely on different physical, chemical, and biological pathways to remove CO2 from the atmosphere and transfer it (or the carbon) into different storage compartments. For example, direct air capture (DAC) can skim CO2 from the atmosphere and store it as a pressurised fluid; photosynthesis-based CDR can store carbon in live biomass (afforestation), detritus (soil carbon sequestration), or thermochemically stabilised organic matter (biochar sequestration)[3]. These alternatives have varying costs[4], storage permanence[3], and environmental impacts[5]. Models can be used to optimise CDR portfolios to meet local constraints[6].
Enhanced weathering (EW) is a CDR technique based on the engineered acceleration of natural geochemical weathering reactions of CO2 and water with rocks or minerals. This concept was first proposed by Seifritz[7]. A more detailed EW scheme was then proposed and analysed by Kojima et al.[8]. In terrestrial ex-situ EW, suitable rocks and minerals are ground into fine particles with high specific surface area; this material is then transported and applied to sites where weathering reactions with carbonic acid in rainwater occur. The energy requirement for grinding is a critical parameter in determining the practical viability of EW[7-9]. The dosing on land also needs to be calibrated to match expected precipitation. Significant co-benefits can result from the application of EW in conventional[10] and urban[11] agriculture. Alternatively, EW can be applied in coastal environments, where particle attrition due to wave motion allows the use of coarser grains produced with lower energy input and reduced GHG emissions penalties[12,13]. EW in remote ecosystems has also been proposed via aircraft-based application of rock dust[14]. Many alkaline industrial wastes, such as metallurgical slag, may also be used in EW to reduce the need to mine fresh rocks and minerals[15]. A review of EW and related NETs is provided by Campbell et al.[16], while a companion paper discusses their future roadmap[17]. Field tests[10,18] and natural analogues[19] provide real-world evidence of CDR from EW. Although most of the component processes of EW systems are technologically mature, there are still fundamental knowledge gaps that pose challenges for scale-up[20,21]. Techniques for measuring the amount of CDR generated are still under development based on tests for reaction products in the soil or runoff water[22]. Social acceptance issues also need to be addressed, especially when waste materials are used for EW[23].
The efficacy of EW depends on key factors, such as the choice of material[8], particle size[9], and the energy mix[24]. Early analysis of the energy and carbon footprints of EW was reported by Kojima et al.[8]. More recent work reports life cycle assessment (LCA) of EW in terrestrial[25] and coastal[13] sites. Dedicated EW models have recently been developed that account for geochemistry[26]. Input-output (IO) analysis has also been applied to gauge the effects of EW in single-[27] and multi-region [28] contexts. A single-region environmentally-extended IO (EEIO) modelling approach was recently used to analyse the effectiveness of basalt EW in the Philippines[29]. This technique explicitly represents EW as a distinct economic sector whose economic output is CDR[2], using the approach originally developed by Leontief[30]. However, this work did not consider the incremental carbon footprint of activities related to the monitoring, reporting, and verification (MRV) of CDR generation. The provision of MRV services is critical to ensuring the credibility of traded CDR credits generated using EW[17]. MRV is also expected to account for a significant share of the cost of CDR credits in a mature market[2].
CDR can play an important role in decarbonising economic sectors with hard-to-abate emissions. For example, palm oil production in countries such as Malaysia and Indonesia is problematic due to GHG emissions from the entire agro-industrial supply chain[31]. The carbon footprint of palm oil is roughly 1.1 t CO2 equivalent (CO2e)/t[32], and significant effort is being invested in finding effective decarbonisation measures such as land-based CDR[33]. Basalt EW field tests have been conducted in Malaysian oil palm plantations as a proof-of-concept[18]. A recent stakeholder survey also noted concerns about the sustainability of mineral resource supply, the adverse impacts of basalt processing and logistics, and agricultural co-benefits[34].
This work is especially relevant given the new decarbonisation policies recently introduced in Malaysia to achieve zero emissions by 2050. The Carbon Capture, Utilisation and Storage Act 2025 provides a comprehensive framework for CO2 capture, utilisation, storage, and transportation, and created the Malaysia Carbon Capture, Utilisation and Storage (MyCCUS) Agency. At present, the act is only applicable to Peninsular Malaysia and the Labuan Island (which belongs to the Federal Territory). In Sarawak (Borneo), several related policies have also been established. These include the Land (Carbon Storage) Rules 2022, the Environment (Reduction of Greenhouse Gases Emission) Ordinance 2023, the Sarawak Forest Ordinance (Amendment) 2022, and the Forests (Forest Carbon Activity) Rules 2022. It is also worth noting the Bursa Carbon Exchange (BCX), was launched in 2024 to support voluntary carbon trading. Given these developments, a systematic modelling approach is necessary to assess the economic impacts of large-scale EW implementation in Malaysia under the current carbon management trend. However, no systematic modelling studies have been reported on the potential ripple effects of large-scale EW in this country.
To address this research gap, our work presents a novel analysis of the potential of basalt EW to decarbonise the Malaysian economy using a modification of the approach developed by Aviso et al.[29]. MRV and soil fertility effects are explicitly considered in this improved modelling framework to address the limitations of the earlier work. The rest of the paper is organised as follows. The next section presents the methodology, consisting of the formal problem definition and the modelling technique. The subsequent section discusses the results of applying this model to the Malaysian decarbonisation scenario; it analyses the impact of basalt EW on the extensive oil palm plantations in Malaysia. Finally, the conclusions are given along with future research directions.
METHODOLOGY
In this section, the modelling problem is first formally defined, followed by a discussion of the EEIO modelling framework. Finally, the input data and working assumptions used to implement this technique for modelling basalt EW deployment in Malaysia are described in detail.
Formal problem definition
The modelling problem, based on a previous work[29], is formally defined as follows:
• Given the state of technology in an economy that quantifies the input and output flows of resources and wastes defined by an EEIO system;
• Given the resource requirements and waste streams of a new economic sector meant for CDR;
• Given the baseline economic and environmental performance of an economy;
• Given the targeted CDR scale;
The objective is to determine the economic and environmental ripple effects (i.e., changes in sector output and the associated direct GHG emissions) of the large-scale implementation of CDR.
EEIO modelling framework
Leontief[35] developed IO analysis by using linear equations to model economic networks. Miller and Blair[36] provide a comprehensive tutorial on this topic. One fundamental assumption in all IO models is that the average technology mix across sectors remains constant and is described by a fixed-recipe Leontief production function. Sensitivity or scenario analysis can be used to relax this limiting assumption. The standard model[35] is given by
where
EEIO is a standard technique for computing carbon[37] and other environmental footprints[36]. It relies on augmenting economic data with environmental flows (natural resources and pollutants). EEIO can be used as a stand-alone technique or in hybrid models combined with process-based LCA. For the analysis of a single pollutant such as CO2, the footprint can be calculated from the sectoral total outputs[36] using
Alternatively, it can be calculated from final demands[36] using
where
Leontief[30] also proposed an alternative EEIO model by extending the basic model to include a pollutant and an additional pollution control sector, which can be expressed as
where
These calculations can be easily implemented in a Microsoft Excel spreadsheet or other software with equation-solving capabilities.
Data and assumptions
The EEIO model is applied to the Malaysia scenario using data from 2019, the most recent year for which non-pandemic data is available. The 35-sector IO table of the Asian Development Bank[38] is reduced to eight sectors using the standard approach to facilitate analysis [Table 1]. Procedural details can be found in the textbook of Miller and Blair[36]. Each column in Table 1 gives the Leontief production function (i.e., purchased inputs per unit of economic output) of the average technology mix used in the sector. This technology mix is assumed to be fixed in the simulations that follow, except where otherwise indicated.
Matrix of dimensionless technical coefficients
| Sector | S1 | S2 | S3 | S4 | S5 | S6 | S7 | S8 |
| Agriculture (S1) | 0.017 | 0.001 | 0.050 | 0.001 | 0.002 | 0.002 | 0.002 | 0.008 |
| Mining (S2) | 0.000 | 0.064 | 0.050 | 0.007 | 0.020 | 0.001 | 0.002 | 0.001 |
| Manufacturing (S3) | 0.105 | 0.041 | 0.271 | 0.112 | 0.262 | 0.282 | 0.216 | 0.087 |
| Electricity (S4) | 0.003 | 0.002 | 0.017 | 0.023 | 0.002 | 0.003 | 0.003 | 0.015 |
| Construction (S5) | 0.004 | 0.017 | 0.001 | 0.146 | 0.122 | 0.004 | 0.005 | 0.039 |
| Land transport (S6) | 0.002 | 0.002 | 0.007 | 0.002 | 0.011 | 0.005 | 0.003 | 0.002 |
| Other transport (S7) | 0.003 | 0.006 | 0.008 | 0.003 | 0.012 | 0.005 | 0.015 | 0.008 |
| Services (S8) | 0.050 | 0.044 | 0.110 | 0.056 | 0.106 | 0.144 | 0.318 | 0.186 |
Total sector outputs and final demands, adapted from the Asian Development Bank[38], are shown in Table 2. These economic data are then combined with GHG emissions data from the United Nations Environment Programme[39] to derive the direct GHG intensities shown in the last column of Table 2. The emissions data are aggregated to match the sectors in the technical coefficients matrix in Table 1.
Baseline sectoral total outputs, final demands, and direct GHG intensities
| Sector | Total output (million USD/y) | Final demand (million USD/y) | Direct GHG intensity (Mt CO2e/million USD) |
| Agriculture (S1) | 34,038 | 12,805 | 0.0003 |
| Mining (S2) | 39,946 | 18,030 | 0.0002 |
| Manufacturing (S3) | 355,300 | 201,886 | 0.0001 |
| Electricity (S4) | 20,059 | 8,148 | 0.0075 |
| Construction (S5) | 58,241 | 33,910 | 0.0001 |
| Land transport (S6) | 8,588 | 4,395 | 0.0008 |
| Other transport (S7) | 13,691 | 7,106 | 0.0008 |
| Services (S8) | 333,935 | 216,327 | 0.0000 |
The generation of CDR using EW is treated as a new economic sector with backward linkages to the rest of the economy. The basalt application rate in oil palm plantations is assumed to be 20-50 t/ha/y (tonnes per hectare per year). The cost of CDR is estimated at 77.78-82.35 USD/t of basalt, with fresh basalt specifically mined for EW. Techno-economic data are adapted from Strefler et al.[8] under the assumption that the CDR rate of basalt is 0.15-0.2 kg CO2 per kg of basalt[19]. It is further assumed that MRV (i.e., auditing) and other services (e.g., trading, financial, and consulting) account for 10%-15% of the cost of CDR credits, based on the projection of Mannion et al.[2]. The coefficients and underlying assumptions are summarised in Table 3. In addition, a 0-10% reduction in fertiliser demand is considered[10]; the effect of this change on Manufacturing (S3) inputs into Agriculture (S1) is estimated based on national fertiliser consumption statistics[40]. To gauge the effects of these uncertainties, a full factorial design of experiment (DOE) approach is used for global sensitivity analysis[41], where results are computed for every possible combination of the best and worst values of the parameter intervals.
Cost of inputs into the CDR sector
| Sector | Input (USD/t basalt) | Assumptions and remarks |
| Mining (S2) | 30 | Fresh basalt is mined for EW |
| Manufacturing (S3) | 20 | 70% of this cost is fuel for land application |
| Electricity (S4) | 10 | Electricity consumption for grinding is 5 GJ/t |
| Land transport (S6) | 10 | 200 km transport distance by truck |
| Services (S8) | 7.78-12.35 | Cost of MRV and other services |
Combining data in Tables 1-3 gives the full EEIO model. Two main scenarios aim to reduce GHG emissions from the baseline level of 240 Mt CO2e/y[39] if basalt EW is applied to all oil palm plantations in Malaysia. These plantations have a combined area of 5.67 Mha, which is about 17% of the national total land area[33]. The first scenario assumes that the current average carbon intensity of electricity generation of 0.6 kg CO2e/kWh[42] is maintained in the deployment of EW; the second scenario assumes that the carbon intensity is cut by 50%, a reduction consistent with recent decarbonisation projections[43].
The analysis assumes that most model coefficients remain constant (i.e., the technology mix used remains the same), except as indicated for the scenario and sensitivity analyses. For details, the spreadsheet implementation of the EEIO model is provided in the Supplementary Materials.
RESULTS AND DISCUSSION
The results of implementing the EEIO model given by Equation (6) are discussed here for the two grid carbon-intensity scenarios.
Scenario 1: baseline electricity grid carbon intensity
This scenario assumes that additional electricity generation occurs at the current grid carbon intensity of 0.6 kg CO2e/kWh[42] to support large-scale EW and its ripple effects. The best-case result reduces total GHG emissions by 11.0% from 240 Mt CO2e/y[39] to 213.7 Mt CO2e/y. The amount of CDR generated is 56.7 Mt CO2e/y, but approximately 54% of this is offset by GHG emissions penalties, leaving a net reduction of only 26.3 Mt CO2e/y. This result is comparable to the results reported for the Philippines[29], where approximately half of the CDR benefit is lost due to emissions penalties from other carbon-intensive parts of the EW supply chain. Figure 1 shows pronounced changes in total sector output of the Mining (S2), Electricity (S4), and Land transport (S6) to support EW supply chain operations, while the increments for the other sectors are negligible.
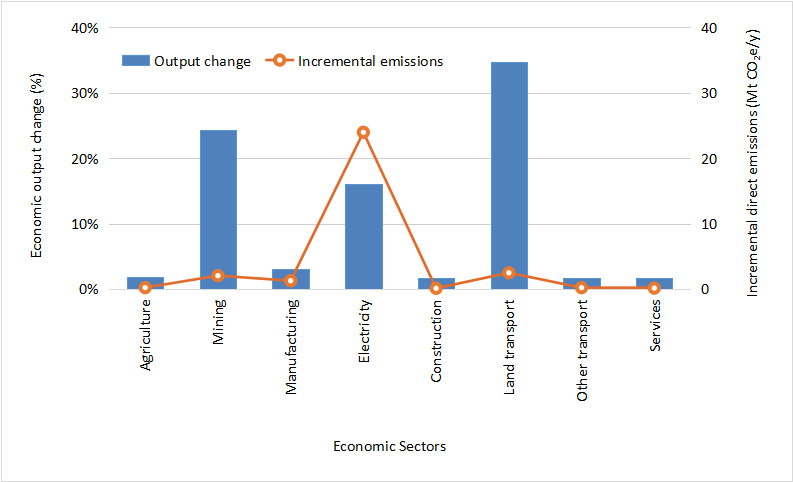
Figure 1. Percentage increase in sectoral total outputs and incremental direct sectoral emissions for Scenario 1 (authors’ original work, generated using Microsoft Excel).
The CDR credits generated by EW can be used to offset GHG emissions from other parts of the economy, thereby reducing the carbon footprints of various products and services[2]. However, the substantial increases in basalt quarrying (Mining, S2), electricity generation (primarily for basalt grinding) (Electricity, S4), and EW logistics (Land transport, S6) also result in a cumulative GHG emissions penalty that reduces the climate change mitigation efficacy of the system. Although the incremental emissions from Land transport (S6) are not as substantial as those from Electricity (S4), the large fractional increase over the baseline economic output implies the need for additional capital stock in vehicles and road infrastructure. In addition, there is a small GHG emissions penalty due to the increased electricity requirement to support Manufacturing (S3) to provide fuel and auxiliary inputs. The GHG emissions penalty from Services (S8) for MRV and other supplementary services occurs indirectly (e.g., via additional electricity demand). Smaller high-order effects also arise from other supply chain linkages.
The results of the global sensitivity analysis for this scenario are summarised in Figure 2, showing the effects of basalt application rate, CO2 capture rate per unit of basalt, MRV cost, and fertiliser demand reduction on net GHG emissions reduction. Using the DOE approach to global sensitivity, each of these parameters is treated as an experimental factor whose best- and worst-case values are coded on a dimensionless scale as +1 and -1, respectively. For example, a basalt application rate of 50 t/ha/y is coded as +1, while a rate of 20 t/ha/y is coded as -1. The sensitivity to each parameter can be gauged by comparing the collective results at +1 with the collective results at -1. In Figure 2A, the basalt application rate has a pronounced effect on net GHG emissions reduction, while Figure 2B shows that the CO2 capture rate has a slightly weaker effect. On the other hand, Figure 2C and D shows that MRV cost and fertiliser demand reduction resulting from soil quality enhancement have negligible effects. The results highlight the importance of efforts to decarbonise the electricity grid in Malaysia and to enhance the effectiveness of EW implementation. Scenario 1 may represent the transitional carbon intensity of 0.6 kg CO2e/kWh towards net-zero emissions by 2050[43]. A decarbonised electricity grid is demonstrated in Scenario 2.
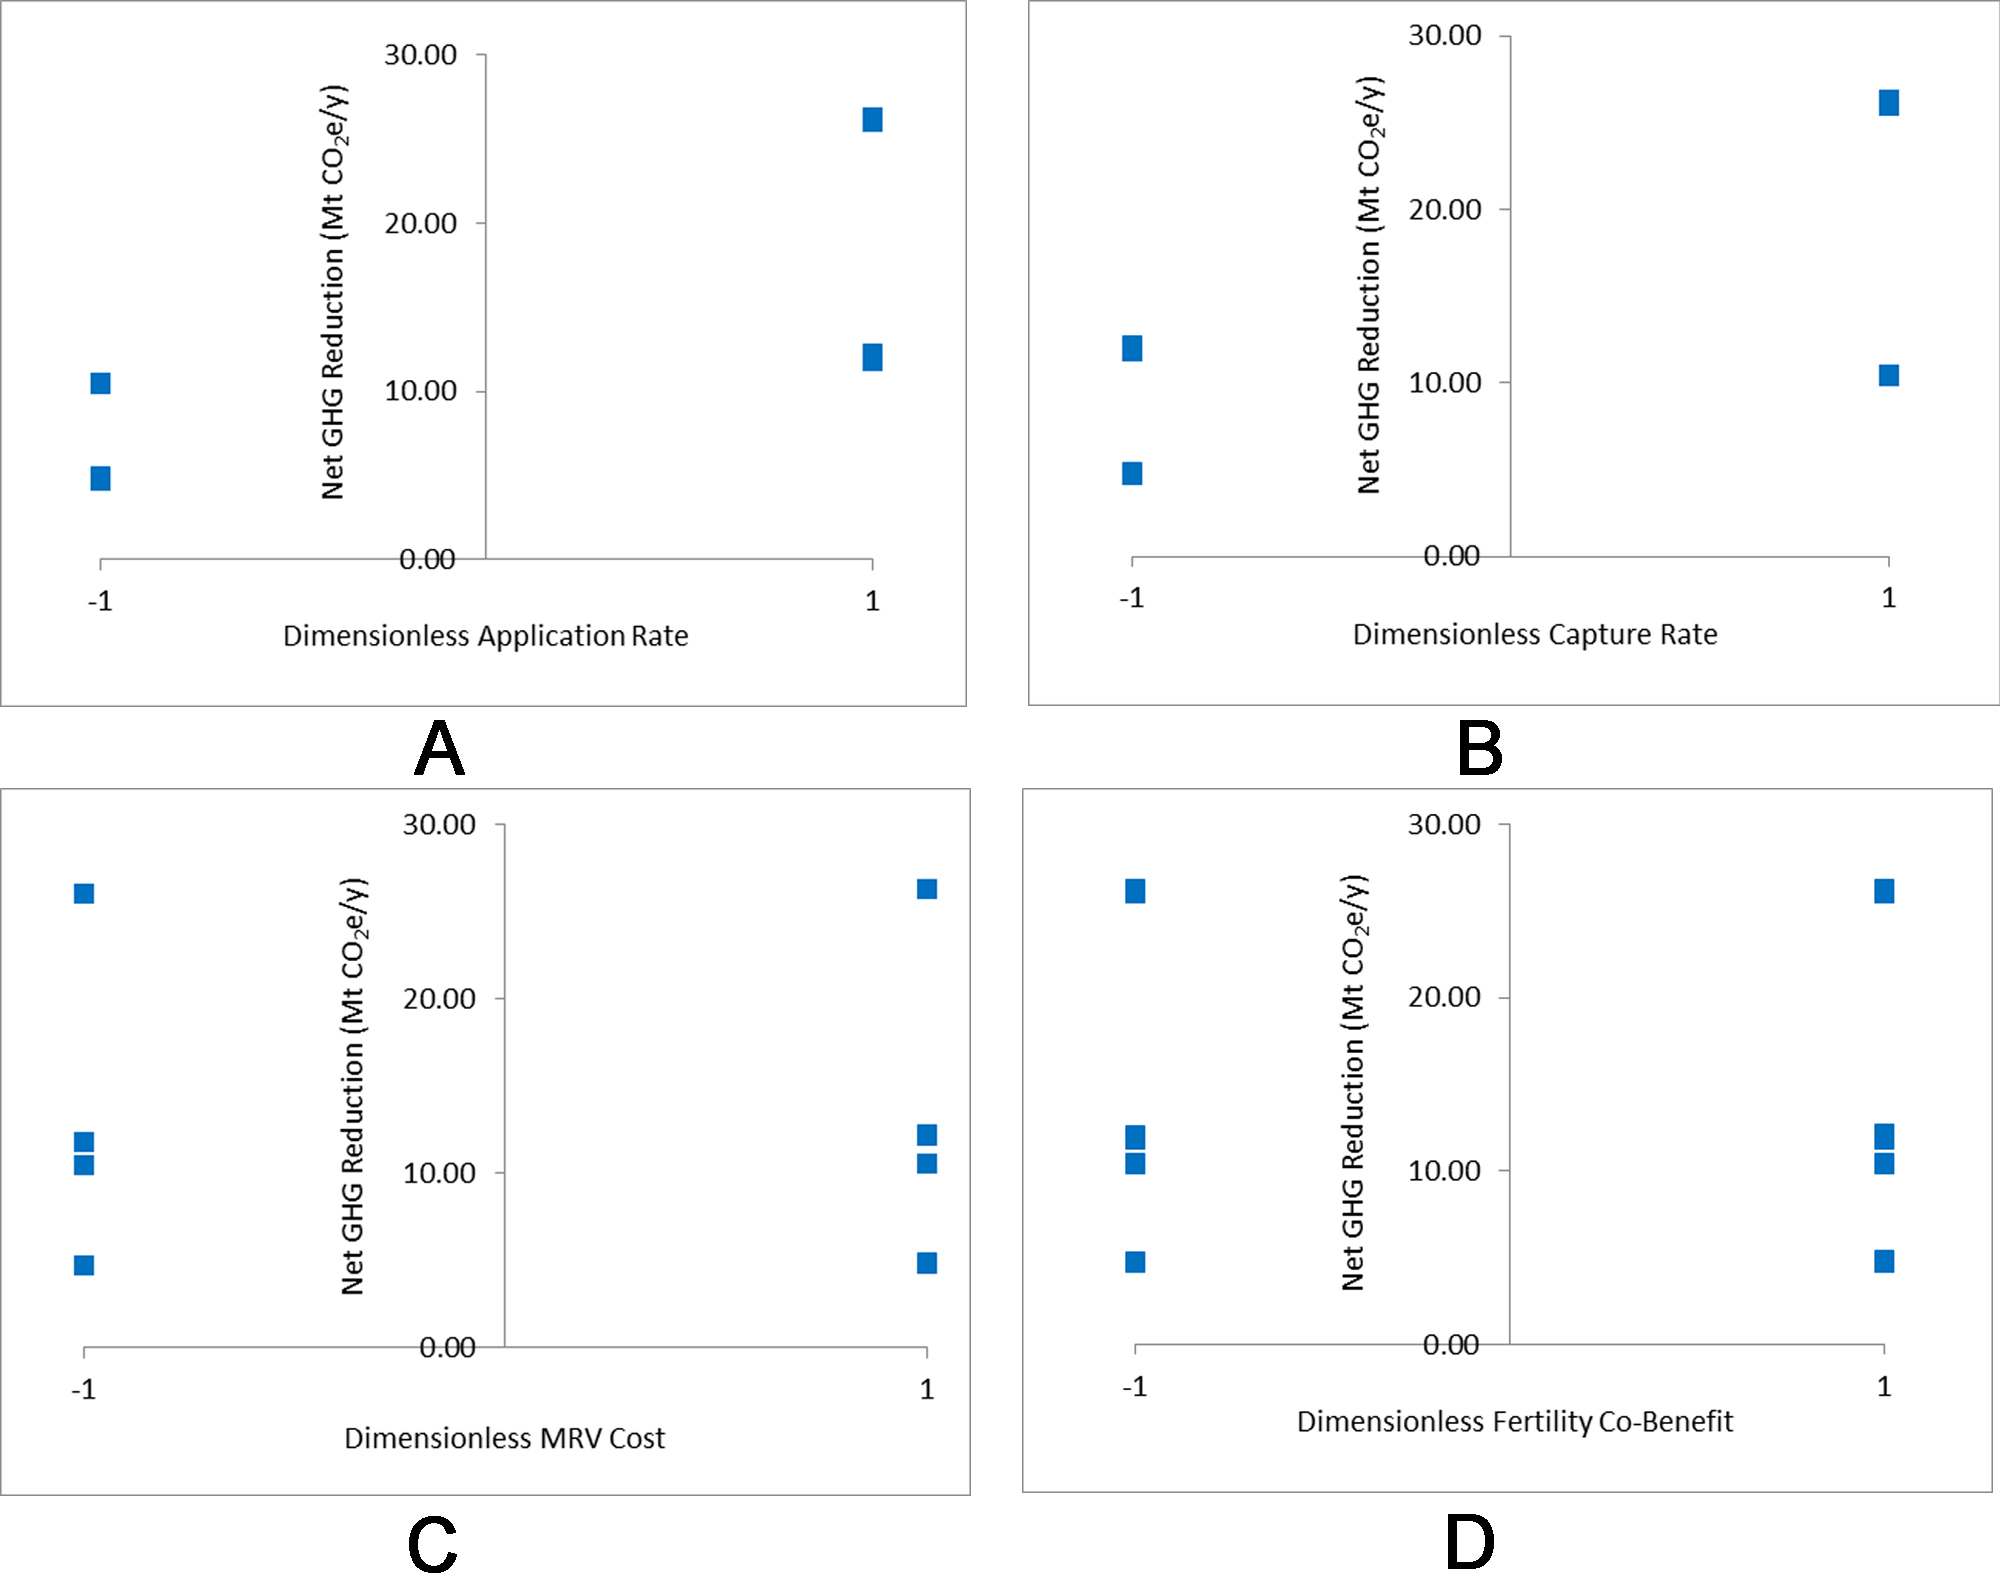
Figure 2. Results of global sensitivity analysis of net GHG emissions reduction with respect to (A) basalt application rate, (B) CO2 capture rate per unit of basalt, (C) MRV cost, and (D) fertiliser demand reduction for Scenario 1 (authors’ original work, generated using Microsoft Excel). GHG: Greenhouse gas; MRV: monitoring, reporting, and verification.
Scenario 2: decarbonised electricity grid carbon intensity
This scenario assumes that all electricity generation has a carbon intensity of 0.3 kg CO2e/kWh, a figure consistent with recently published projections[43]. This reduced carbon intensity is assumed to apply to electricity supplied to both the background economy and to incremental demand supporting large-scale EW and its ripple effects. As a result, baseline emissions are much lower than those of Scenario 1, at 165.3 Mt CO2e/y. In Scenario 2, the best-case result reduces total GHG emissions by 23.2% to 126.9 Mt CO2e/y. The amount of CDR generated is still 56.7 Mt CO2e/y, but this time only 32% of it is offset by GHG emissions penalties, giving a net GHG emissions reduction of 38.4 Mt CO2e/y. This improvement highlights the critical synergy between grid decarbonisation and CDR based on EW. Economic ripple effects are summarised in Figure 3, which again shows pronounced changes in total sector output of the Mining (S2), Electricity (S4), and Land transport (S6) to support EW supply chain operations, with negligible incremental outputs in the other sectors. The effects on GHG emissions are similar to those in Scenario 1, except that the penalties for electricity generation are 50% lower.
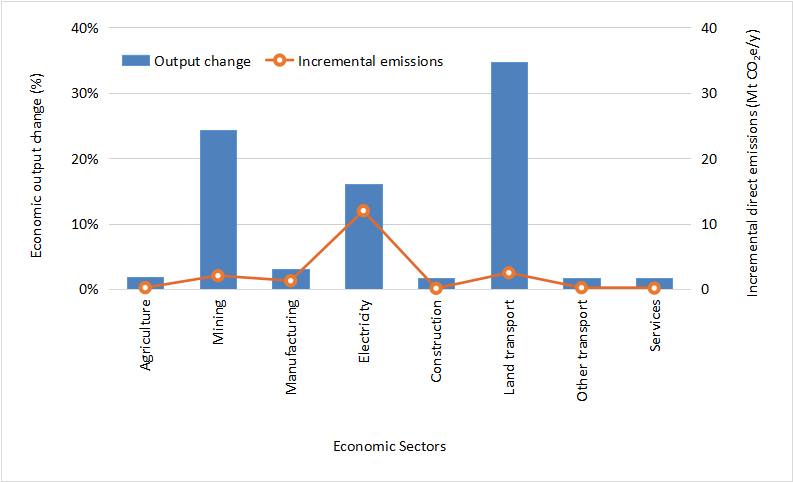
Figure 3. Results of percentage increase in sector total outputs and incremental direct sectoral emissions for Scenario 2 (authors’ original work, generated using Microsoft Excel).
The results of the global sensitivity analysis for Scenario 2 are summarised in Figure 4, which shows the effects of basalt application rate, CO2 capture rate per unit of basalt, MRV cost, and fertiliser demand reduction on net GHG emissions reduction. The results follow the same trends as in Scenario 1: basalt application rate [Figure 4A] and CO2 capture rate [Figure 4B] both have significant effects, while MRV cost [Figure 4C] and fertiliser demand reduction [Figure 4D] have negligible effects.
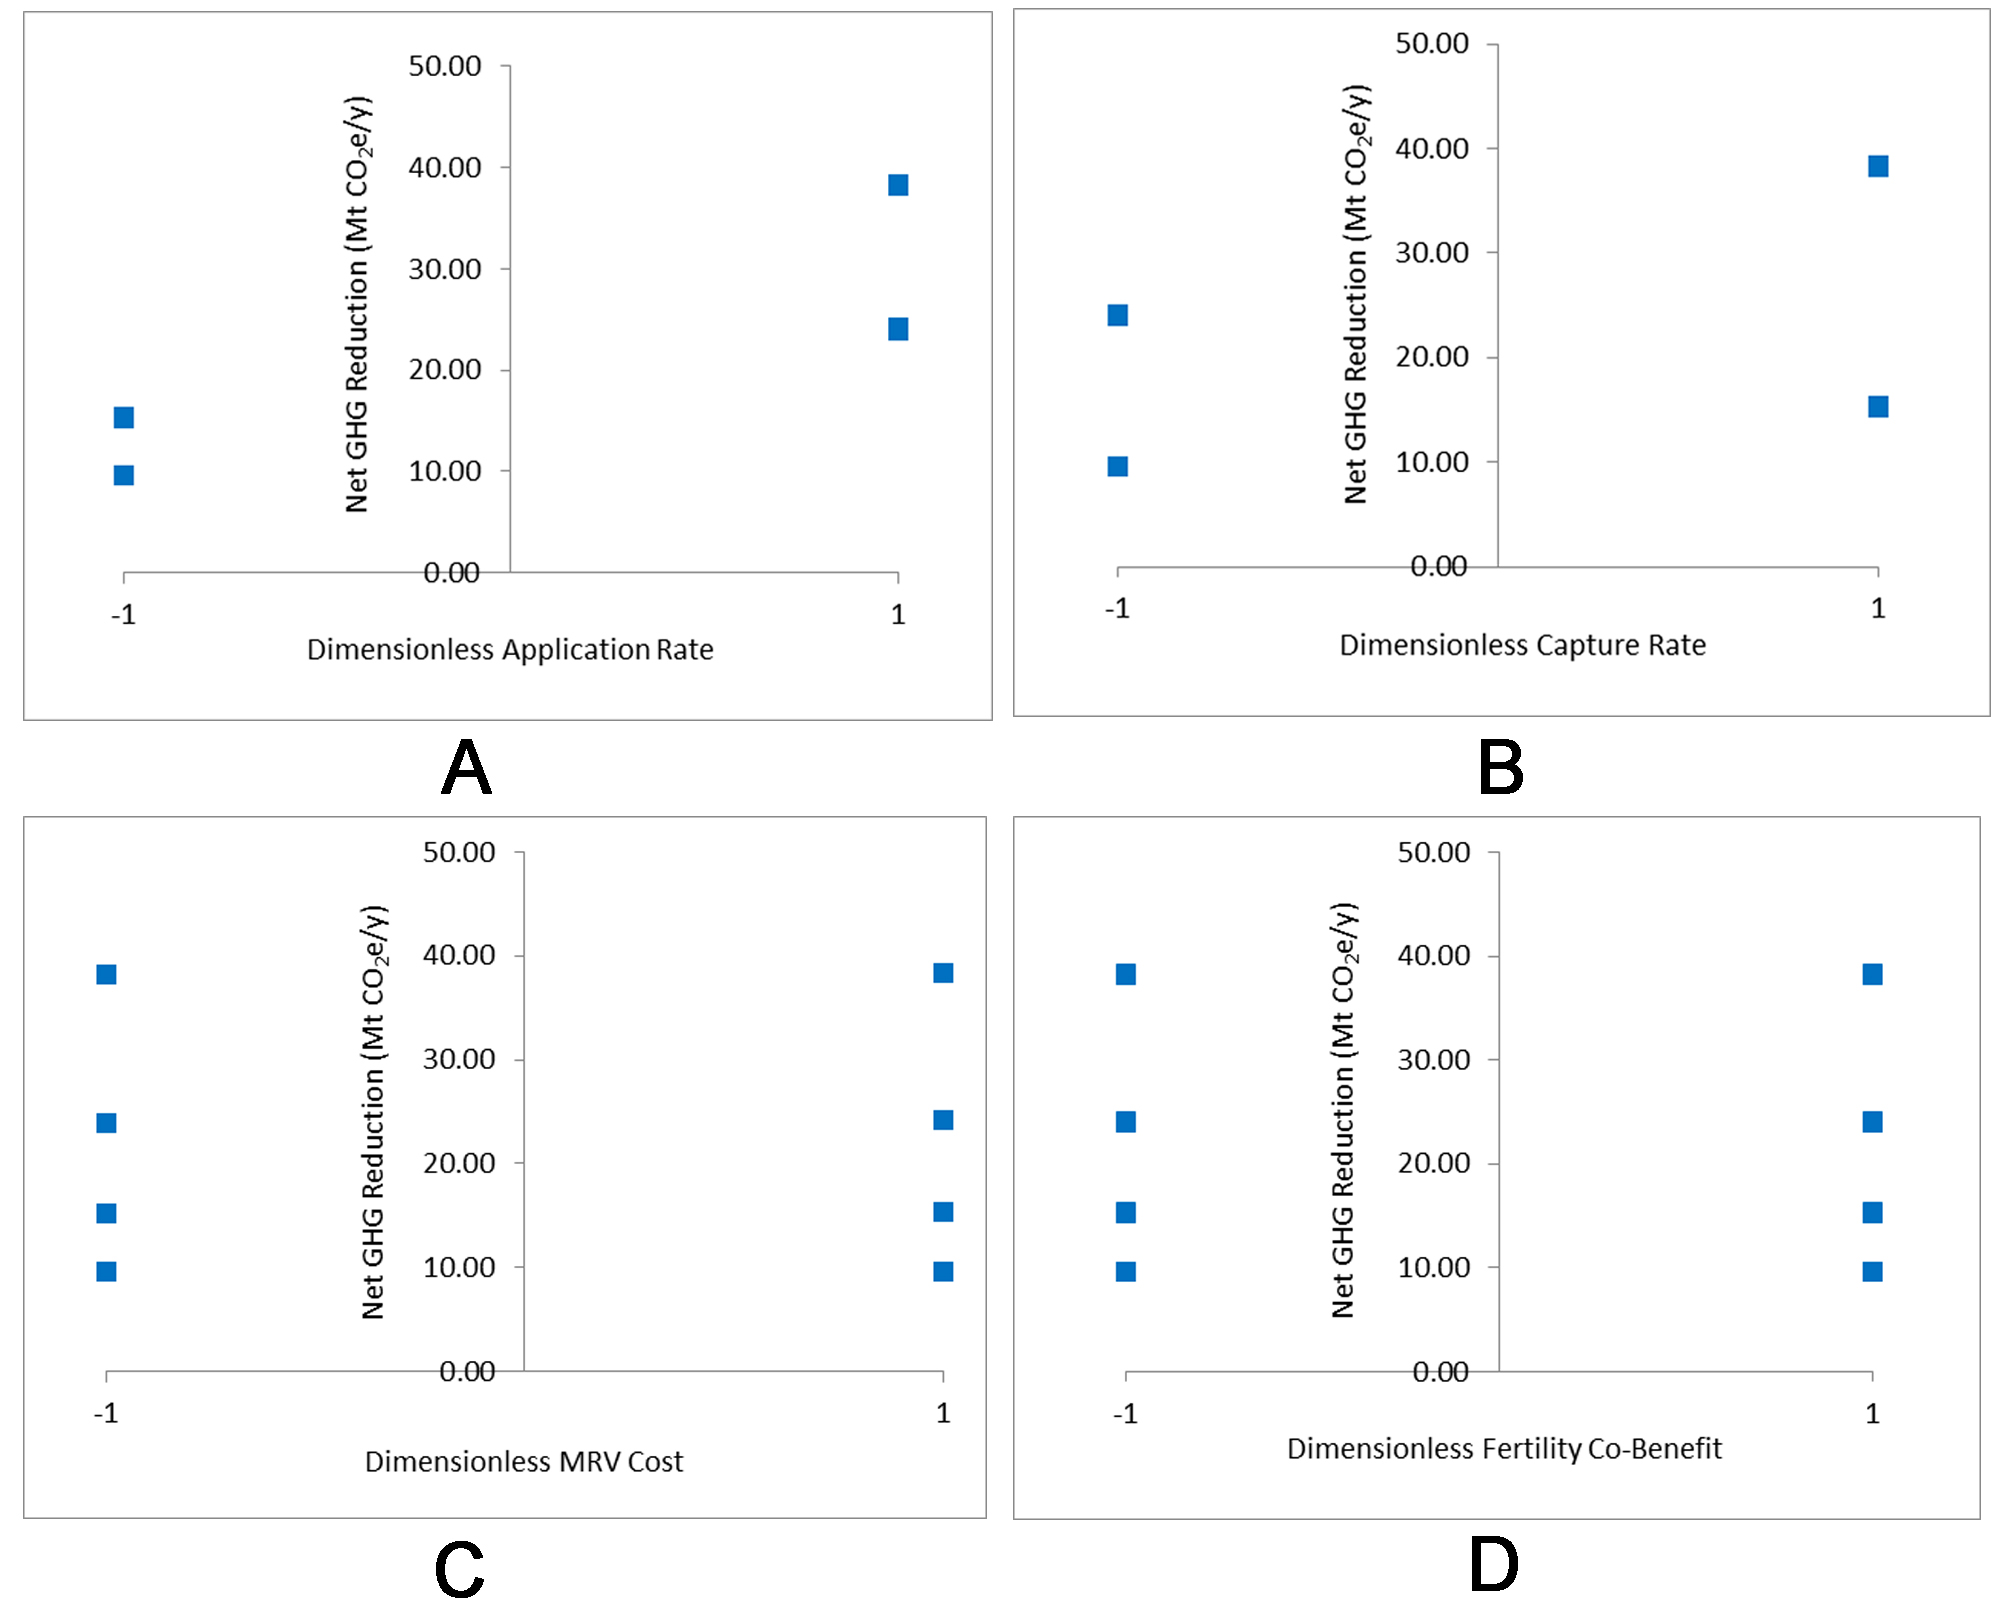
Figure 4. Results of global sensitivity analysis of net GHG emissions reduction with respect to (A) basalt application rate, (B) CO2 capture rate per unit of basalt, (C) MRV cost, and (D) fertiliser demand reduction for Scenario 2 (authors’ original work, generated using Microsoft Excel). GHG: Greenhouse gas; MRV: monitoring, reporting, and verification.
The scenario analysis suggests policy implications. There is a strong synergy between electric grid decarbonisation and EW implementation. Scenario 2, which reduces carbon intensity by 50%, results in a greater environmental benefit. The results support the implementation of the Carbon Capture, Utilisation, and Storage Act 2025 in Malaysia alongside renewable energy deployment policies. Other carbon management policies also have the potential to enhance the effects of EW implementation in the country. Process improvements such as optimization of rock grinding to reduce energy use[44] can also be investigated in subsequent modelling studies.
CONCLUSION
In order to gauge the net climate change mitigation benefits of CDR in Malaysia, a static EEIO model was developed to estimate the potential GHG emissions reduction from basalt-based EW applied to the country’s oil palm plantations. The model considers the economic ripple effects caused by the backward linkages of the CDR sector to the rest of the economy, while global sensitivity analysis is used to gauge the impact of techno-economic uncertainties. The results of the study suggest that EW should be implemented in conjunction with other carbon footprint reduction measures, such as improving the energy efficiency within the supply chain and replacing fossil fuels with renewables in the energy mix. These findings address some of the key concerns about the impacts of large-scale EW supply chains in Malaysia and can be generalized to other countries with similar grid conditions.
Future work can apply this modelling approach to other countries or regions. Multi-period EEIO models should be developed next to simulate the dynamic ramp-up of CDR while considering investments in capital stock. These models can also consider alternatives to freshly mined basalt, including various alkaline industrial wastes. CDR credits can be modelled as a new economic commodity to allow polluters to directly bear the cost of carbon footprint reduction. Other environmental (e.g., land or water) footprints can also be incorporated in future analyses. This method can also be used to gauge the ripple effects of the scale-up of other CDR techniques, deployed individually or as integrated carbon footprint reduction plans. Finally, mathematical programming models based on this EEIO formulation can be developed for cases where there are discrete technology choices.
DECLARATIONS
Authors’ contributions
Conceptualisation, Writing - original draft: Tan, R. R.
Methodology: Aviso, K.
Data curation: Aviso, K.; Gue, I. H.
Formal analysis: Foo, D. C. Y.; Migo-Sumagang, M. V.; Tan, R. R; Tan, Y. L.
Writing - review and editing: Aviso, K.; Foo, D. C. Y.; Gue, I. H.; Migo-Sumagang, M. V.; Tan, Y. L.
Availability of data and materials
The model and data are provided in the Supplementary Materials.
Financial support and sponsorship
Not applicable.
Conflicts of interest
Aviso, K. is the Editorial Board Member of the Carbon Footprints journal. She had no involvement in the review or editorial process of this manuscript, including but not limited to reviewer selection, evaluation, or the final decision. The other authors declare that there are no conflicts of interest.
Ethical approval and consent to participate
Not applicable.
Consent for publication
Not applicable.
Copyright
© The Author(s) 2026.
Supplementary Materials
REFERENCES
1. Intergovernmental Panel on Climate Change. Summary for Policymakers. In Climate Change 2022: Mitigation of Climate Change: Contribution of Working Group III to the Sixth Assessment Report of the Intergovernmental Panel on Climate Change. Cambridge University Press, 2023; pp 3-48.
2. Mannion, P.; Parry, E.; Scott, J.; Patel, M.; Ringvold, E. Carbon removals: How to scale a new gigaton industry. McKinsey & Company, New York, NY, 2023. https://www.mckinsey.com/capabilities/sustainability/our-insights/carbon-removals-how-to-scale-a-new-gigaton-industry (accessed 2025-08-06).
3. Dowell, N.; Reiner, D. M.; Haszeldine, R. S. Comparing approaches for carbon dioxide removal. Joule 2022, 6, 2233-9.
5. Deprez, A.; Leadley, P.; Dooley, K.; et al. Sustainability limits needed for CO2 removal. Science 2024, 383, 484-6.
6. Mühlbauer, A.; Keiner, D.; Gerhards, C.; Caldera, U.; Sterner, M.; Breyer, C. Assessment of technologies and economics for carbon dioxide removal from a portfolio perspective. Int. J. Greenh. Gas. Control. 2025, 141, 104297.
8. Kojima, T.; Nagamine, A.; Ueno, N.; Uemiya, S. Absorption and fixation of carbon dioxide by rock weathering. Energy. Convers. Manag. 1997, 38, S461-6.
9. Strefler, J.; Amann, T.; Bauer, N.; Kriegler, E.; Hartmann, J. Potential and costs of carbon dioxide removal by enhanced weathering of rocks. Environ. Res. Lett. 2018, 13, 034010.
10. Beerling, D. J.; Epihov, D. Z.; Kantola, I. B.; et al. Enhanced weathering in the US Corn Belt delivers carbon removal with agronomic benefits. Proc. Natl. Acad. Sci. U. S. A. 2024, 121, e2319436121.
11. Haque, F.; Santos, R. M.; Chiang, Y. W. Urban Farming with enhanced rock weathering as a prospective climate stabilization wedge. Environ. Sci. Technol. 2021, 55, 13575-8.
12. Meysman, F. J.; Montserrat, F. Negative CO2 emissions via enhanced silicate weathering in coastal environments. Biol. Lett. 2017, 13, 20160905.
13. Foteinis, S.; Campbell, J. S.; Renforth, P. Life cycle assessment of coastal enhanced weathering for carbon dioxide removal from air. Environ. Sci. Technol. 2023, 57, 6169-78.
14. Goll, D. S.; Ciais, P.; Amann, T.; et al. Potential CO2 removal from enhanced weathering by ecosystem responses to powdered rock. Nat. Geosci. 2021, 14, 545-9.
15. Renforth, P. The negative emission potential of alkaline materials. Nat. Commun. 2019, 10, 1401.
16. Campbell, J. S.; Foteinis, S.; Furey, V.; et al. Geochemical negative emissions technologies: part I. review. Front. Clim. 2022, 4, 879133.
17. Maesano, C. N.; Campbell, J. S.; Foteinis, S.; et al. Geochemical negative emissions technologies: part II. roadmap. Front. Clim. 2022, 4, 945332.
18. Larkin, C. S.; Andrews, M. G.; Pearce, C. R.; et al. Quantification of CO2 removal in a large-scale enhanced weathering field trial on an oil palm plantation in Sabah, Malaysia. Front. Clim. 2022, 4, 959229.
19. Linke, T.; Oelkers, E.; Möckel, S.; Gislason, S. Direct evidence of CO2 drawdown through enhanced weathering in soils. Geochem. Persp. Let. 2024, 30, 7-12.
20. Calabrese, S.; Wild, B.; Bertagni, M. B.; et al. Nano- to global-scale uncertainties in terrestrial enhanced weathering. Environ. Sci. Technol. 2022, 56, 15261-72.
21. Abdalqadir, M.; Hughes, D.; Rezaei Gomari, S.; Rafiq, U. A state of the art of review on factors affecting the enhanced weathering in agricultural soil: strategies for carbon sequestration and climate mitigation. Environ. Sci. Pollut. Res. Int. 2024, 31, 19047-70.
22. Clarkson, M. O.; Larkin, C. S.; Swoboda, P.; et al. A review of measurement for quantification of carbon dioxide removal by enhanced weathering in soil. Front. Clim. 2024, 6, 1345224.
23. Spence, E.; Cox, E.; Pidgeon, N. Exploring cross-national public support for the use of enhanced weathering as a land-based carbon dioxide removal strategy. Clim. Change. 2021, 165, 23.
24. Eufrasio, R. M.; Kantzas, E. P.; Edwards, N. R.; et al. Environmental and health impacts of atmospheric CO2 removal by enhanced rock weathering depend on nations’ energy mix. Commun. Earth. Environ. 2022, 3, 436.
25. Lefebvre, D.; Goglio, P.; Williams, A.; et al. Assessing the potential of soil carbonation and enhanced weathering through life cycle assessment: a case study for Sao Paulo State, Brazil. J. Clean. Prod. 2019, 233, 468-81.
26. Jerden, J.; Mejbel, M.; Filho, A. N. Z.; Carroll, M.; Campe, J. The impact of geochemical and life-cycle variables on carbon dioxide removal by enhanced rock weathering: development and application of the Stella ERW model. Appl. Geochem. 2024, 167, 106.
27. Oppon, E.; Richter, J. S.; Koh, S. L.; Nabayiga, H. Macro-level economic and environmental sustainability of negative emission technologies; case study of crushed silicate production for enhanced weathering. Ecol. Econ. 2023, 204, 107636.
28. Oppon, E.; Koh, S. L.; Eufrasio, R. Sustainability performance of enhanced weathering across countries: a triple bottom line approach. Energy. Econ. 2024, 136, 107722.
29. Aviso, K. B.; Migo-Sumagang, M. V.; Ramos, C. A.; Tan, R. R. Economic ripple effects of large-scale basalt enhanced weathering in the Philippines. Chem. Eng. Trans. 2024, 114, 547-52.
30. Leontief, W. Environmental repercussions and the economic structure: an input-output approach. Rev. Econ. Stat. 1970, 52, 262-71.
31. Hashim, Z.; Subramaniam, V.; Harun, M. H.; Kamarudin, N. Carbon footprint of oil palm planted on peat in Malaysia. Int. J. Life. Cycle. Assess. 2018, 23, 1201-17.
32. Hosseini, S. E.; Abdul Wahid, M. Pollutant in palm oil production process. J. Air. Waste. Manag. Assoc. 2015, 65, 773-81.
33. Rajakal, J. P.; Ng, F. Y.; Zulkifli, A.; et al. Analysis of current state, gaps, and opportunities for technologies in the Malaysian oil palm estates and palm oil mills towards net-zero emissions. Heliyon 2024, 10, e30768.
34. Cox, E.; Lim, R.; Spence, E.; Payne, M.; Beerling, D.; Pidgeon, N. Question-Led Innovation: public priorities for enhanced weathering research in Malaysia. Environ. Sci. Policy. 2025, 163, 103977.
35. Leontief, W. W. Quantitative input and output relations in the economic systems of the United States. Rev. Econ. Stat. 1936, 18, 105-25.
36. Miller, R. E.; Blair, P. D. Input-output analysis: foundations and extensions, 4th ed.; Cambridge University Press, 2019.
37. Dong, Q.; Zhong, C.; Geng, Y.; Dong, F.; Chen, W.; Zhang, Y. A bibliometric review of carbon footprint research. Carbon. Footprints. 2024, 3, 24.
38. Malaysia: Input-Output Economic Indicators. Asian Development Bank. https://data.adb.org/dataset/malaysia-input-output-economic-indicators (accessed 2026-01-5).
39. SCP Hotspot Analysis. https://scp-hat.org/ (accessed 2026-01-5).
40. Malaysia Page. fertiMetrics. https://fertimetrics.com/markets/malaysia/ (accessed 2026-01-5).
41. Ye, K. Q. Orthogonal column latin hypercubes and their application in computer experiments. J. Am. Stat. Assoc. 1998, 93, 1430-9.
42. Carbon intensity of electricity generation, 2024. Our World in Data. https://ourworldindata.org/grapher/carbon-intensity-electricity (accessed 2026-01-5).
43. Fernandez, M. I.; Go, Y. I.; Früh, W.; Wong, D. M. Projection of electricity generation profiles and carbon emissions towards 2050: a Malaysia Context. Energy. Sustain. Dev. 2025, 85, 101681.
Cite This Article
How to Cite
Download Citation
Export Citation File:
Type of Import
Tips on Downloading Citation
Citation Manager File Format
Type of Import
Direct Import: When the Direct Import option is selected (the default state), a dialogue box will give you the option to Save or Open the downloaded citation data. Choosing Open will either launch your citation manager or give you a choice of applications with which to use the metadata. The Save option saves the file locally for later use.
Indirect Import: When the Indirect Import option is selected, the metadata is displayed and may be copied and pasted as needed.
About This Article
Copyright

Data & Comments
Data
0


Comments
Comments must be written in English. Spam, offensive content, impersonation, and private information will not be permitted. If any comment is reported and identified as inappropriate content by OAE staff, the comment will be removed without notice. If you have any queries or need any help, please contact us at [email protected].