

Regional prioritization in vehicle electrification and renewable electricity expansion facilitates decarbonization of China’s road transport
 0
0 
Abstract
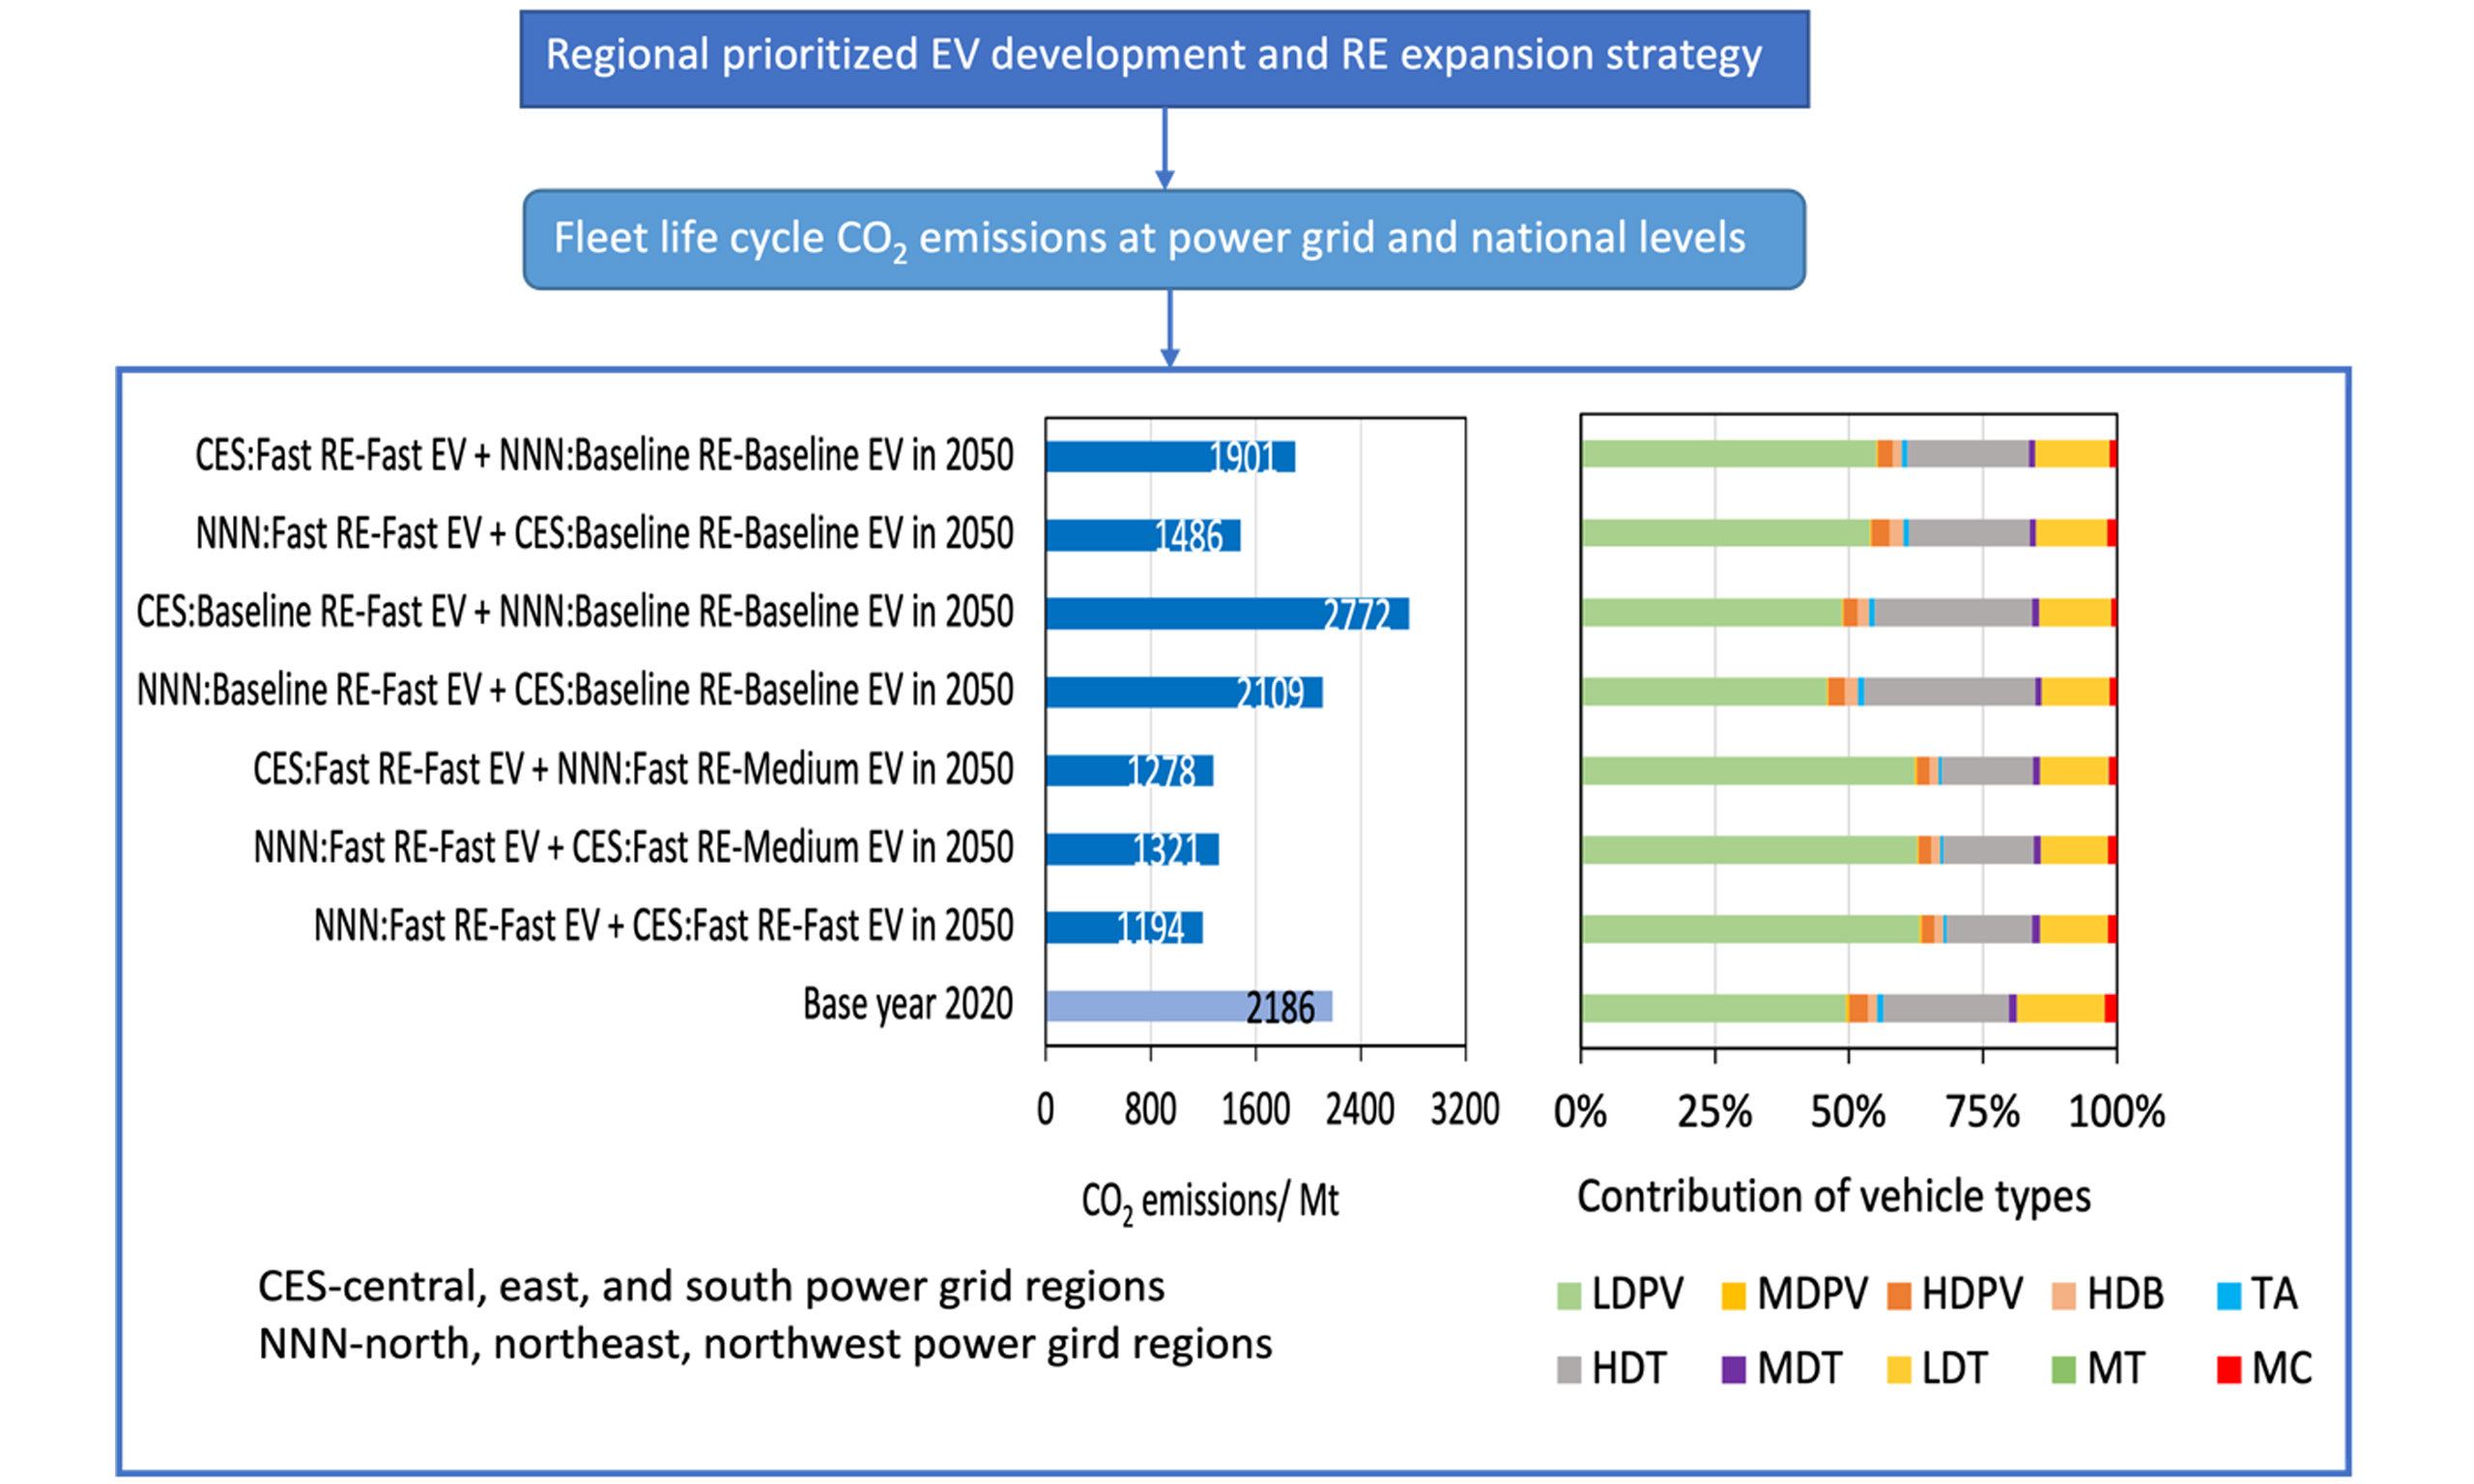
Previous studies indicate that rapid electric vehicle (EV) adoption, together with synchronized expansion of renewable electricity (RE) in all power grid regions, could significantly reduce life cycle carbon emissions from China’s road transport sector. However, the varying pace of EV and RE development in different regions complicates this goal. There is a lack of research analyzing the impact of prioritizing vehicle electrification and RE expansion within specific power grid regions on national life cycle carbon emission reductions. This study employed a highly disaggregated engineering-based model to estimate the life cycle carbon emissions from China’s road transport from the base year 2020 up to 2050 under various EV and RE development scenarios with different regional priorities. The underlying reasons and key processes driving variations in carbon emission reductions at the power grid region level were also analyzed. Our results indicate that the Central and Northwest power grid regions contributed the most and least to life cycle carbon emissions in 2020, respectively. Implementing fast RE and EV development pathways in the North, Northeast, and Northwest power grid regions (where emissions are mainly from vehicle use and the energy supply chains) while maintaining baseline pathways in Central, East, and South could reduce national life cycle carbon dioxide (CO2) emissions from 2,186 Mt in 2020 to 1,486 Mt in 2050. Conversely, focusing on fast RE and EV development in the Central, East, and South regions, where vehicle and battery production is mainly located, would only reduce emissions to 1,901 Mt by 2050. Our findings suggest that prioritizing synchronized fast RE and EV development at a power grid region level would be more effective than doing so at a national level in reducing the overall life cycle CO2 emissions from China’s road transport by 2050. Light-duty passenger vehicles, heavy-duty trucks, and light-duty trucks are the main vehicle types contributing to CO2 emissions in various regional prioritization in vehicle electrification and RE expansion.
Keywords
INTRODUCTION
China, as one of the largest energy consumers and carbon emitters globally[1], accounted for 33.9% of global carbon emissions in 2024[2]. The road transport sector is a significant contributor to this issue, making its deep decarbonization an urgent priority[3] to achieve China’s carbon neutrality target by 2060[4]. Electric vehicle (EV) adoption and renewable electricity (RE) expansion have been identified as key pathways to decarbonize China’s road transport during the vehicle use stage and promote sustainable road transport[5-7]. However, when extended to the full life cycle, rapid EV development pathways may increase life cycle carbon emissions[8-10], indicating that realizing the full potential of these pathways requires a comprehensive life cycle perspective. Decarbonization strategies should include different RE expansion and EV development pathways and ensure that emission reductions during the vehicle use stage are not offset by increased emissions from other life cycle stages, such as electricity generation, vehicle production, and battery production. For example, rapid EV development combined with slow RE expansion can significantly increase life cycle carbon emissions from the vehicle energy supply chain, vehicle production, and battery production, although emissions from the vehicle use stage can be mitigated[11]. This occurs because EVs generate higher production-related emissions than internal combustion engine vehicles (ICEVs), particularly from battery production[12-15]. Recent studies, such as that conducted by Duan et al.[16], have considered the impacts of vehicle electrification and RE expansion pathways on carbon dioxide (CO2) emissions but have not adopted a life cycle perspective, limiting their ability to provide comprehensive decarbonization strategies for China’s road transport. Therefore, analyzing the combined impacts of EV adoption and RE expansion on life cycle carbon emissions from China’s road transport is critical. Moreover, a previous study emphasized that synchronized RE expansion with rapid EV development is essential to achieving China’s 2030 carbon peak and 2060 carbon neutrality goals for the road transport sector from a life cycle perspective[11]. However, achieving synchronization across China’s six power grid regions remains challenging due to their diverse electricity generation mixes, regional disparities in climatic conditions, local policies, and varying implementation capacities[17-21]. These factors lead to significant regional variations in EV-related emissions in China[22,23]. This highlights the urgent need to examine how regional prioritization in vehicle electrification and RE expansion could more effectively reduce national life cycle carbon emissions.
Studies focusing on overseas countries reinforce this need. In the United States, county-level studies show that the carbon benefits of EV development vary significantly with local power grid carbon intensity, suggesting greater near-term carbon reductions where electricity is already decarbonized[24]. A national-scale analysis demonstrates that the decarbonization benefits of electrification are maximized when synchronized with rapid RE expansion in the United States, underscoring the need for integrated energy-transport planning[25]. In Europe, comparative life cycle assessments (LCAs) demonstrate large differences across member states, with clean-power countries achieving far greater life cycle benefits than coal-dependent ones[26], and dynamic analyses confirm that upstream battery emissions are offset as grids decarbonize[27]. Beyond advanced economies, the risks of unsynchronized transitions are evident. In India, large-scale EV deployment without parallel RE expansion yields limited CO2 reductions and can increase local air pollutants[28]. Recent cross-country LCA studies further highlight that the decarbonization potential of EVs varies widely across developing economies depending on their electricity generation mix. For example, Brazil achieves some of the lowest life cycle emissions owing to its hydropower-rich grid, while
Despite growing interest in this field, existing LCA studies have notable limitations. Many focus narrowly on comparing life cycle carbon[3,4,6,30,31] or greenhouse gas[32-34] emissions between EVs and ICEVs, primarily for light-duty passenger vehicles (LDPVs)[30,32,33,35] and within specific regions[13,36], rather than estimating national carbon emissions for the entire vehicle fleet. Additionally, most studies are limited to the vehicle cycle or specific components, providing a limited understanding of how RE expansion and EV development affect life cycle carbon emissions for the entire vehicle fleet. For example, Yang et al.[37] conducted an LCA of light-duty battery electric and internal combustion engine passenger vehicles, but only considered the vehicle cycle. Chen et al.[38] focused solely on the life cycle carbon emissions of lithium-ion batteries. Qiao et al.[34] analyzed the cradle-to-gate greenhouse gas emissions of battery EVs (BEVs) and ICEVs in China, yet similarly restricted their analysis to the vehicle cycle.
Many studies estimated life cycle carbon emissions based on different EV penetrations and electricity generation mixes, but they still mainly focus on BEVs and ignore regional differences in vehicle production, battery production, and electricity generation mix. For example, Qiao et al.[39] included both vehicle and fuel cycles but did not account for regional differences in vehicle and battery production and future changes in the electricity mix. Shafique et al.[10] evaluated carbon emissions for BEVs in China over their full life cycle under national rather than power grid-level electricity mix scenarios for 2019, 2025, and 2030. Liu et al.[40] examined the regional CO2 emission reduction effects of BEVs based on provincial vehicle electrification rates and electricity generation mixes but excluded emissions from vehicle and battery production, limiting the practical applicability of their findings. Hu et al.[23] evaluated provincial inequalities in life cycle CO2 emissions for ICEVs, plug-in hybrid vehicles (PHEVs), and BEVs in China in 2020 and 2030, considering different EV and RE development scenarios. However, they only considered standard medium-sized vehicles with different powertrain technologies rather than the entire vehicle fleet, which failed to analyze the main vehicle types contributing to reductions in CO2 emissions. Moreover, although they analyzed the impacts of different EV and RE development scenarios on provincial life cycle CO2 emissions for ICEVs, PHEVs, and BEVs, the regional prioritization in vehicle electrification and RE expansion was not considered.
More importantly, a crucial gap in existing studies is the lack of analysis on how prioritizing EV development and RE expansion in different power grid regions affects national life cycle carbon emissions from China’s road transport. Given that regional variations in electricity mix and EV adoption can lead to significant inequalities in life cycle CO2 emissions from EVs in China[23], it is essential to integrate EV and RE development with different priorities for power grid regions into the decarbonization strategies for China’s road transport sector to optimize national carbon reduction efforts. To address this gap, this study employs a highly disaggregated engineering-based model to estimate life cycle carbon emissions from China’s road transport sector from the base year 2020 to 2050, under various scenarios of EV and RE development with different regional priorities. The novelty of this study lies in examining the regional priorities and their influence on national fleet carbon emission reductions, as well as analyzing the underlying reasons and key processes that drive variations in carbon emission reductions at the power grid region level, providing region-specific insights and more targeted policy guidance to reduce national life cycle CO2 emissions from China’s road transport sector.
METHODS
Methodological framework
This study employed a highly disaggregated engineering-based model to estimate the life cycle carbon emissions from China’s road transport sector between 2020 and 2050 under various EV and RE development scenarios with different regional priorities. The model calculated provincial- and power
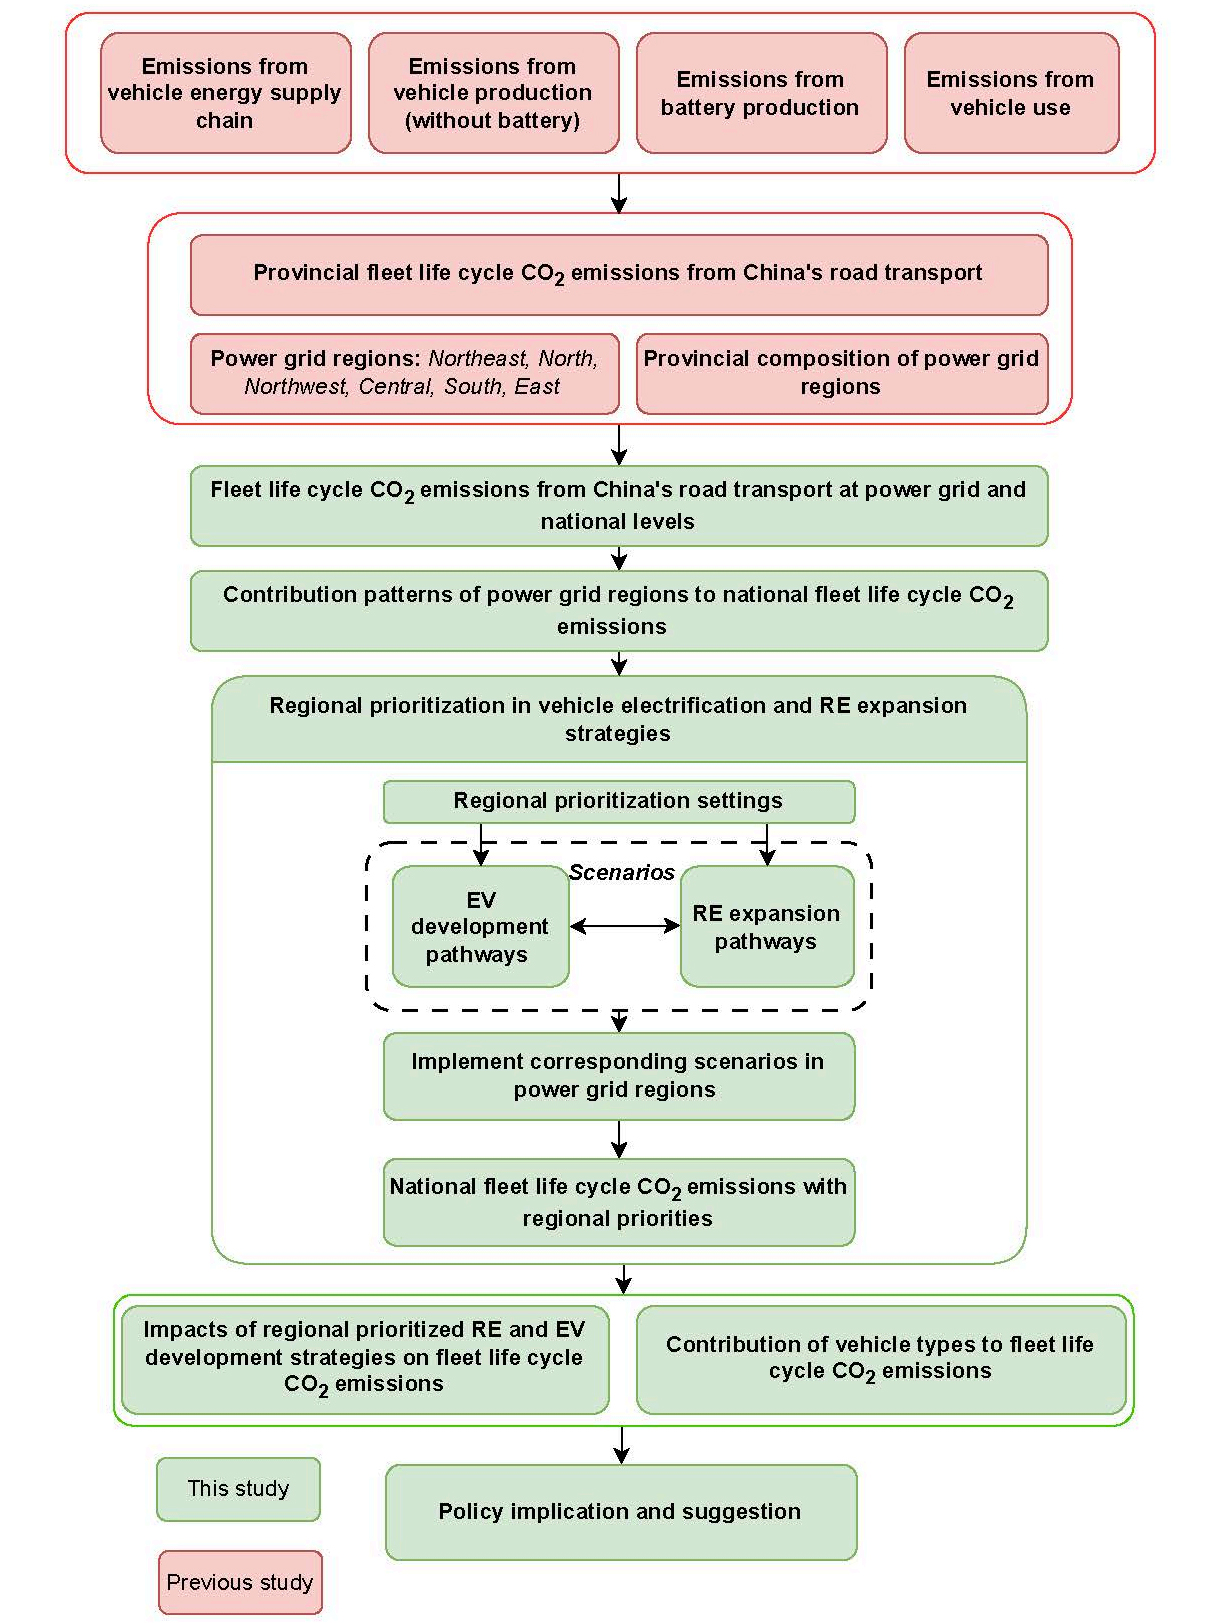
Figure 1. Overall methodological framework of this study. RE: Renewable electricity; EV: electric vehicle.
System boundary and research scope
This study covered 10 vehicle types: LDPV, medium-duty passenger vehicle (MDPV), heavy-duty passenger vehicle (HDPV), heavy-duty bus (HDB), light-duty truck (LDT), medium-duty truck (MDT), heavy-duty truck (HDT), mini-truck (MT), taxi (TA), and motorcycle (MC). Fuel types and powertrain technologies included gasoline, diesel, natural gas, BEV, PHEV, and hybrid electric vehicle (HEV). Lithium-ion
The life cycle stages considered were: (i) vehicle energy supply chain, (ii) vehicle production (without battery), (iii) battery production, and (iv) vehicle use. The end-of-life (EOL) stage was excluded because of limited data availability in Ecoinvent v3.8 on EOL treatment of vehicles and batteries[11]. Spatially, the model covered 31 provinces in mainland China (excluding Hong Kong, Macau, and Taiwan), grouped into six power grid regions: North, Northeast, Northwest, Central, East, and South power grid regions, as detailed in Table 1.
Provinces in China’s power grids
| Power grid | Provinces |
| North | West Inner Mongolia*, Hebei, Beijing, Tianjin, Shanxi, and Shandong |
| Northeast | Heilongjiang, Jilin, Liaoning, and East Inner Mongolia* |
| Northwest | Shaanxi, Gansu, Qinghai, Ningxia, Xinjiang, and Tibet |
| Central | Henan, Sichuan, Chongqing, Hubei, Jiangxi, and Hunan |
| East | Shanghai, Jiangsu, Zhejiang, Anhui, and Fujian |
| South | Guangdong, Guangxi, Yunnan, Guizhou, and Hainan |
Scenario design
Three EV development pathways and three RE expansion pathways were defined.
EV pathways: The Baseline pathway fixed EV market share at its 2020 levels (5.4%[41]) through 2050 as a counterfactual without additional policy intervention. The Medium pathway followed a logistic diffusion curve, reaching 17% in 2025 and 100% in 2050, representing typical technological diffusion. The Fast pathway represented a disruptive transition, reaching 70% by 2025 and 100% by 2030, reflecting aggressive policy support.
RE pathways: The Baseline RE pathway held the RE share in 2020 (32.1%[42]) constant, while the Medium RE pathway assumed 2% annual growth, reaching 58% by 2050, and the Fast RE pathway assumed 5% annual growth, achieving 100% RE by 2045 [Table 2].
The EV market share and RE share under EV development and RE expansion pathways in 2020-2050 (%)
| Year | Baseline | Medium | Fast | |||
| RE | EV | RE | EV | RE | EV | |
| 2020 | 32.1 | 5.4 | 32.1 | 5.4 | 32.1 | 5.4 |
| 2025 | 32.1 | 5.4 | 35.4 | 17.0 | 41.0 | 70.0 |
| 2030 | 32.1 | 5.4 | 39.1 | 34.0 | 52.3 | 100.0 |
| 2035 | 32.1 | 5.4 | 43.2 | 51.0 | 66.7 | 100.0 |
| 2040 | 32.1 | 5.4 | 47.4 | 68.0 | 85.2 | 100.0 |
| 2045 | 32.1 | 5.4 | 52.7 | 85.0 | 100.0 | 100.0 |
| 2050 | 32.1 | 5.4 | 58.1 | 100.0 | 100.0 | 100.0 |
These EV and RE pathways were combined into nine scenarios [Table 3]. For the analysis of regional prioritization in vehicle electrification and RE expansion facilitates decarbonization of China’s road transport, this paper focuses on four representative scenarios: the two extreme scenarios (Fast RE-Fast EV and Baseline RE-Fast EV), China’s RE and EV development target scenario (Fast RE-Medium EV)[5], and the baseline scenario (Baseline RE-Baseline EV).
Scenario design
| Baseline RE-Baseline EV | Medium RE-Baseline EV | Fast RE-Baseline EV |
| Baseline RE-Medium EV | Medium RE-Medium EV | Fast RE-Medium EV |
| Baseline RE-Fast EV | Medium RE-Fast EV | Fast RE-Fast EV |
Calculation of life cycle carbon emissions from China’s road transport
provincial-level calculation
Provincial fleet life cycle CO2 emissions in 2020 and under selected scenarios (Baseline RE-Fast EV, Fast
• Vehicle energy supply chain: Based on emission factors for gasoline, diesel, natural gas, and electricity supply chains and corresponding vehicle energy consumption. Indirect emissions from power plants due to EV charging were included in the electricity supply chain.
• Vehicle production (without battery): Based on the number of newly produced vehicles, EV market shares, provincial contributions to total vehicle production, vehicle weight without battery by type and technology, and the corresponding emission factors.
• Battery production: Based on the number of newly produced vehicles, EV market shares, provincial contributions to total battery production, battery weight of BEVs by vehicle type, and the corresponding emission factors.
• Vehicle use: Based on ICEV stock, CO2 emission factors of fossil fuels, vehicle fuel consumption rates, and vehicle miles traveled.
EV market shares in 2020-2050 followed different EV development pathways [Table 2]. Vehicle energy consumption was calculated based on vehicle energy consumption rate [Supplementary Table 1], vehicle stock, mileage of new vehicles [Supplementary Table 2], and relative changes in mileage by vehicle age
Provincial CO2 emission factors under different RE expansion pathways in 2020-2050 for the vehicle energy supply chain (see Supplementary Table 8 for gasoline, diesel, and natural gas supply chains and Supplementary Table 9 for electricity supply chain), vehicle production (without battery) [Supplementary Tables 9-16], and battery production [Supplementary Table 17] were estimated by modeling the corresponding processes based on existing life cycle inventory (LCI) datasets from Ecoinvent v3.8[47] in the LCA software OpenLCA 1.11[48]. The modeling procedures are described in detail in[11]. CO2 emission factors for ICEVs during vehicle use in 2020-2050 [Supplementary Table 18] were estimated based on the National Emission Inventory Guidebook for On-Road Vehicles (see Supplementary Section 6.2). Following this method, provincial life cycle CO2 emissions in 2020 [Supplementary Table 19] and under different scenarios in 2050 were calculated [Supplementary Tables 20-24].
Power grid-level and national calculation
Provincial results were aggregated to six power grid regions, and then to the national fleet level, providing life cycle emissions by stage and scenario. In 2020, power grid-level and national fleet life cycle CO2 emissions were calculated by aggregating provincial emissions within each power grid region
Calculation of national fleet life cycle carbon emissions with regional prioritization in 2050
Once the life cycle CO2 emissions at both the power grid and national levels in 2020 were calculated, the contributions of each power grid region to national CO2 emissions for each life cycle stage in 2020 could be assessed [Supplementary Table 19]. Regions with similar contribution patterns to national CO2 for each life cycle stage in 2020 were grouped into the same priority level for vehicle electrification and RE expansion.
Three regional prioritization strategies for vehicle electrification were designed:
1. Synchronized vehicle electrification: Uniform EV development pathways are implemented across all regions.
2. North, Northeast, and Northwest (NNN) priority: Accelerated EV development pathways are implemented in the NNN regions.
3. Central, East, and South (CES) priority: Accelerated EV development pathways are implemented in the CES regions.
Each vehicle electrification strategy is combined with different RE expansion pathways, reflecting various regional prioritization strategies for vehicle electrification and RE expansion [Table 4].
Regional prioritization strategies for vehicle electrification and RE expansion
| Synchronizing vehicle electrification in all regions in 2050 with different RE expansion pathways | Prioritizing vehicle electrification in CES regions in 2050 with different RE expansion pathways | Prioritizing vehicle electrification in NNN regions in 2050 with different RE expansion pathways | |||
| NNN regions | CES regions | CES regions | NNN regions | NNN regions | CES regions |
| Fast RE-Fast EV | Baseline RE-Fast EV | Fast RE-Fast EV | Fast RE-Medium EV | Fast RE-Fast EV | Fast RE-Medium EV |
| Baseline RE-Fast EV | Fast RE-Fast EV | Baseline RE-Fast EV | Fast RE-Medium EV | Baseline RE-Fast EV | Fast RE-Medium EV |
| Fast RE-Fast EV | Fast RE-Fast EV | Fast RE-Fast EV | Baseline RE-Baseline EV | Fast RE-Fast EV | Baseline RE-Baseline EV |
| Fast RE-Medium EV | Fast RE-Medium EV | Fast RE-Medium EV | Baseline RE-Baseline EV | Fast RE-Medium EV | Baseline RE-Baseline EV |
| Baseline RE-Fast EV | Baseline RE-Fast EV | Baseline RE-Fast EV | Baseline RE-Baseline EV | Baseline RE-Fast EV | Baseline RE-Baseline EV |
In 2050, power grid-level and national fleet life cycle CO2 emissions were calculated by aggregating provincial emissions within each power grid region under different scenarios [Supplementary Tables 20-23]. Under the assumption of constant vehicle and battery production industries between 2020 and 2050, contributions of each power grid region to national CO2 emissions for each life cycle stage in 2050 under different scenarios were then assessed [Supplementary Tables 24-27]. This analysis aimed to examine whether it is reasonable to apply the designed regional prioritization strategies for EV development and RE expansion derived from 2020 to different scenarios in 2050 by comparing with the contribution pattern in 2020.
National fleet life cycle CO2 emissions in 2050 with regional prioritization in vehicle electrification and RE expansion were calculated by combining grid-level CO2 emissions under the corresponding scenarios
RESULTS AND DISCUSSION
Fleet life cycle carbon emissions at the power grid level
Fleet life cycle carbon emissions from China’s power grid regions exhibit significant variability based on different EV and RE development pathways. In the base year 2020, the Central region contributed the most to total CO2 emissions, followed by the East, Northeast, South, and North regions, with the Northwest region contributing the least [Figure 2].
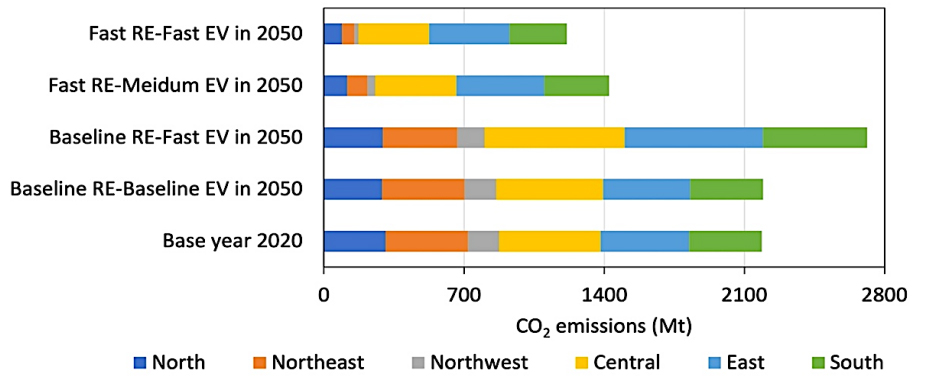
Figure 2. Fleet life cycle CO2 emissions at the power grid level for the base year 2020 and various scenarios in 2050. RE: Renewable electricity; EV: electric vehicle.
Under the Baseline RE-Baseline EV scenario, total CO2 emissions are projected to slightly increase by 7 Mt by 2050 compared to 2020, primarily driven by emission increases in the Central region [Figure 2, Supplementary Table 19 and 20]. Under the Baseline RE-Fast EV scenario, total CO2 emissions are expected to increase by 526 Mt by 2050 compared to 2020. This is primarily attributed to 599 Mt of CO2 emissions increased in the East (250 Mt, 42%), Central (192 Mt, 32%), and South (157 Mt, 26%) regions, offsetting
In contrast, significant CO2 emission reductions are observed under the Fast RE-Medium EV and Fast
Contributions of different life cycle stages to carbon emissions within power grid regions
The primary life cycle stages contributing to CO2 emissions in the NNN regions remain largely similar in the base year 2020 and most scenarios in 2050 [Figure 3A-C], with some notable exceptions under the Fast RE-Medium and Fast RE-Fast EV scenarios in 2050 in the North region [Figure 3A]. In 2020 and the Baseline RE-Baseline EV scenario in 2050 [Supplementary Tables 24 and 25], vehicle use is the dominant contributor to life cycle CO2 emissions in the NNN regions, followed by vehicle production and the vehicle energy supply chain. However, under the Baseline RE-Fast EV scenario in 2050 [Supplementary Table 26], the vehicle energy supply chain becomes the largest contributor in the NNN and Central regions and approaches a level comparable to that of battery production in the East and South regions. This shift occurs because CO2 emissions from vehicle use are entirely mitigated and transferred to the electricity supply chain due to the adoption of a 100% EV stock share[5]. In comparison to the Northeast and Northwest regions
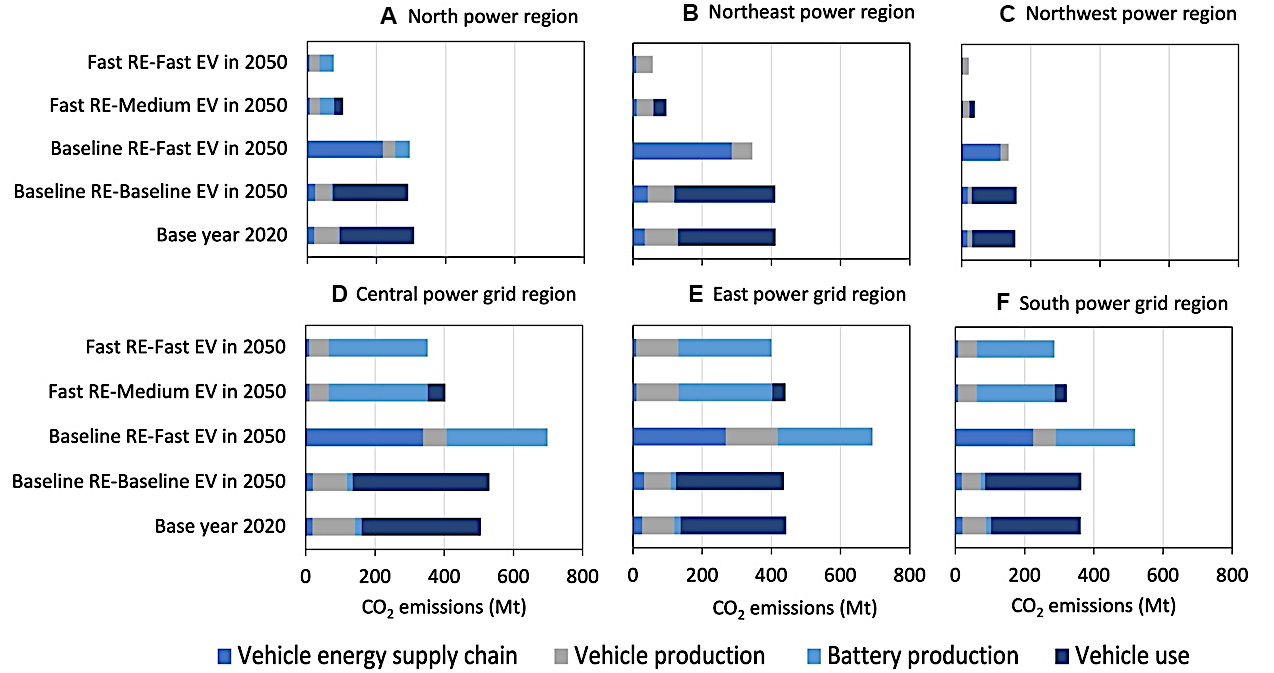
Figure 3. Contributions of different life cycle stages to CO2 emissions in different power grid regions [(A) North power region; (B) Northeast power region; (C) Northwest power region; (D) Central power grid region; (E) East power grid region; and (F) South power grid region)] in the base year 2020 and various scenarios in 2050. RE: Renewable electricity; EV: electric vehicle.
Under the Fast RE-Medium EV scenario in 2050 [Supplementary Table 27], vehicle production and vehicle use dominate life cycle CO2 emissions in the Northeast and Northwest power regions [Figure 3B and C], while battery production emerges as the largest contributor in the North power region [Figure 3A]. This is because CO2 emissions from vehicle use are significantly reduced due to a high EV stock share (88.7%) under the Fast RE-Medium EV scenario by 2050 compared to 2020[5]. Additionally, the large-scale production of EVs in these regions and the relatively intensive battery production in the North region further contribute to CO2 emissions. In contrast, under the Fast RE-Fast EV scenario in 2050
In the CES regions, the primary life cycle stages contributing to CO2 emissions in the base year 2020 and various scenarios in 2050 are consistent [Figure 3D-F]. In both 2020 and the Baseline RE-Baseline EV scenario in 2050 [Supplementary Tables 24 and 25], vehicle use remains the largest contributor in these regions, followed by vehicle production. Unlike the NNN regions, where the vehicle energy supply chain dominates life cycle CO2 emissions under the Baseline RE-Fast EV scenario in 2050, the CES regions show significant contributions from both the vehicle energy supply chain and battery production [Supplementary Table 26], as 95% of total EV batteries are produced in these regions [Supplementary Table 6]. Under the Fast RE-Medium EV and Fast RE-Fast EV scenarios in 2050 [Supplementary Tables 27 and 28], the combination of high RE penetrations, extensive EV adoption, and concentrated battery production results in battery production becoming the largest contributor to life cycle CO2 emissions in these regions.
Compared to the base year 2020 [Supplementary Table 19], under the Fast RE-Medium EV and Fast
National fleet life cycle carbon emissions under different regional prioritization strategies for RE and EV development
The primary power grid regions contributing to national CO2 emissions for each life cycle stage in 2050 under different scenarios were assessed and found to be consistent with those in 2020 [Supplementary Tables 29-33], given that vehicle and battery production industries are assumed to remain unchanged between 2020 and 2050. Accordingly, regional prioritization strategies for EV development and RE expansion derived from the 2020 configuration were applied to estimate national fleet life cycle CO2 emissions in 2050.
As shown in Figure 4, Supplementary Tables 34 and 35, prioritizing EV deployment in the NNN regions reduces national fleet CO2 emissions from 2,186 Mt in 2020 to 1,321-2,109 Mt in 2050, depending on the level of RE expansion. Under scenarios where NNN regions adopt fast RE expansion combined with either medium or fast EV development (Fast RE-Medium EV and Fast RE-Fast EV scenarios), while the CES regions remain at baseline levels (Baseline RE-Baseline EV scenario), national emissions decline by 597-681 Mt by 2050. In contrast, prioritizing the same efforts in the CES regions, while the NNN regions remain at baseline levels, results in only a 158-285 Mt reduction.
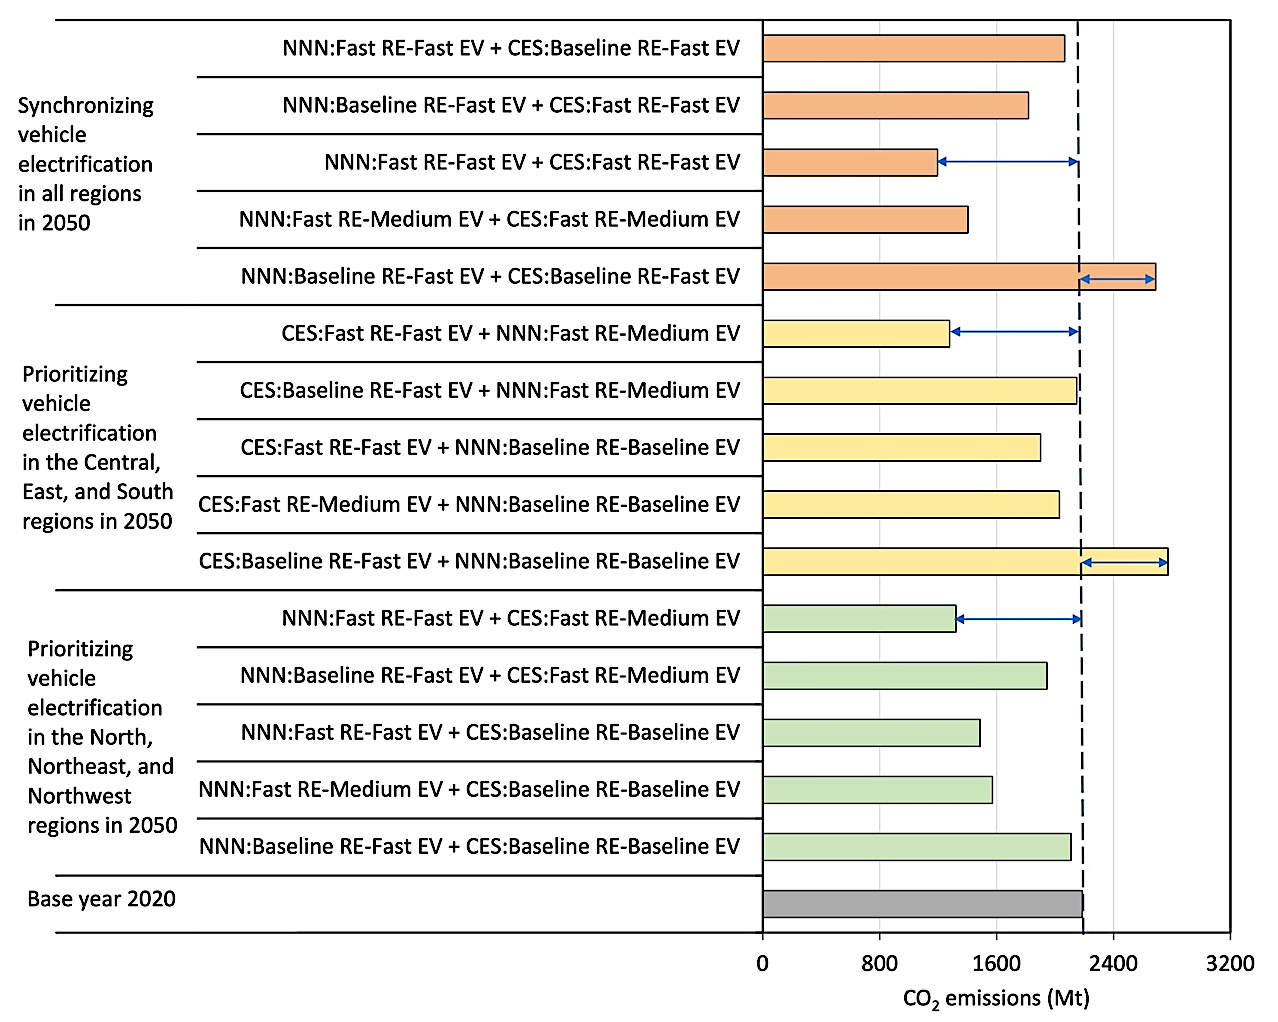
Figure 4. Fleet life cycle CO2 emissions with different vehicle electrification and RE development priorities in different power grid regions in the base year 2020 and 2050. RE: Renewable electricity; EV: electric vehicle; NNN: north, northeast, and northwest; CES: central, east, and south.
When both the NNN and CES regions implement fast RE expansion, adopting a fast EV development pathway in the CES regions and a medium EV development pathway in NNN regions results in lower national fleet life cycle CO2 emission in 2050 (1,278 Mt) than the alternative strategy of fast EV development in the NNN regions and medium EV development in the CES region (1,321 Mt). This difference can be explained by differences across life cycle stages. Emissions from the vehicle energy supply chains are similar (47.8 Mt vs. 50 Mt), and emissions from vehicle production (345.1 Mt) and battery production (822.3 Mt) are identical because newly produced EVs are the same under medium and fast EV development pathways and are assumed equal to newly produced EVs each year. However, use-phase emissions are considerably lower when CES regions follow the fast EV development pathway (79.4 Mt) than under the reverse strategy (124.3 Mt). Thus, with synchronized fast RE expansion, prioritizing fast EV development in the CES regions achieves greater CO2 reductions, primarily by lowering use-phase emissions. These reductions could be further enhanced if upstream processes of vehicle and battery production in the CES regions were decarbonized in parallel with electricity generation. By contrast, if only the CES regions adopt baseline RE and fast EV development while the NNN regions remain at baseline levels, national fleet life cycle CO2 emissions in 2050 increase by 585 Mt relative to 2020, driven by intensive vehicle and battery production coupled with limited RE penetration in the CES regions.
When vehicle electrification is synchronized across all regions, but RE expansion levels vary, CO2 emissions in 2050 range from 1,194 to 2,687 Mt. Nationwide fast EV development combined with baseline RE expansion increases emissions by 501 Mt relative to 2020, while the most substantial emission reduction-to 1,194 Mt-is achieved when both fast RE expansion and EV development are synchronized nationwide by 2050. Detailed results of national fleet life cycle CO2 emissions under different regional prioritization strategies for RE and EV development in 2050 are summarized in Supplementary Table 34.
Contributions of life cycle stages to national fleet CO2 emissions under different regional prioritization strategies for RE and EV development
Compared to the base year 2020, significant reductions in national fleet CO2 emissions can be achieved by 2050 when fast RE expansion is combined with medium or fast EV development in the NNN regions, while the CES regions maintain baseline development levels. In this strategy, vehicle use remains the dominant source of CO2 emissions, followed by vehicle production [Figure 5]. Under the Fast RE-Fast EV or Fast
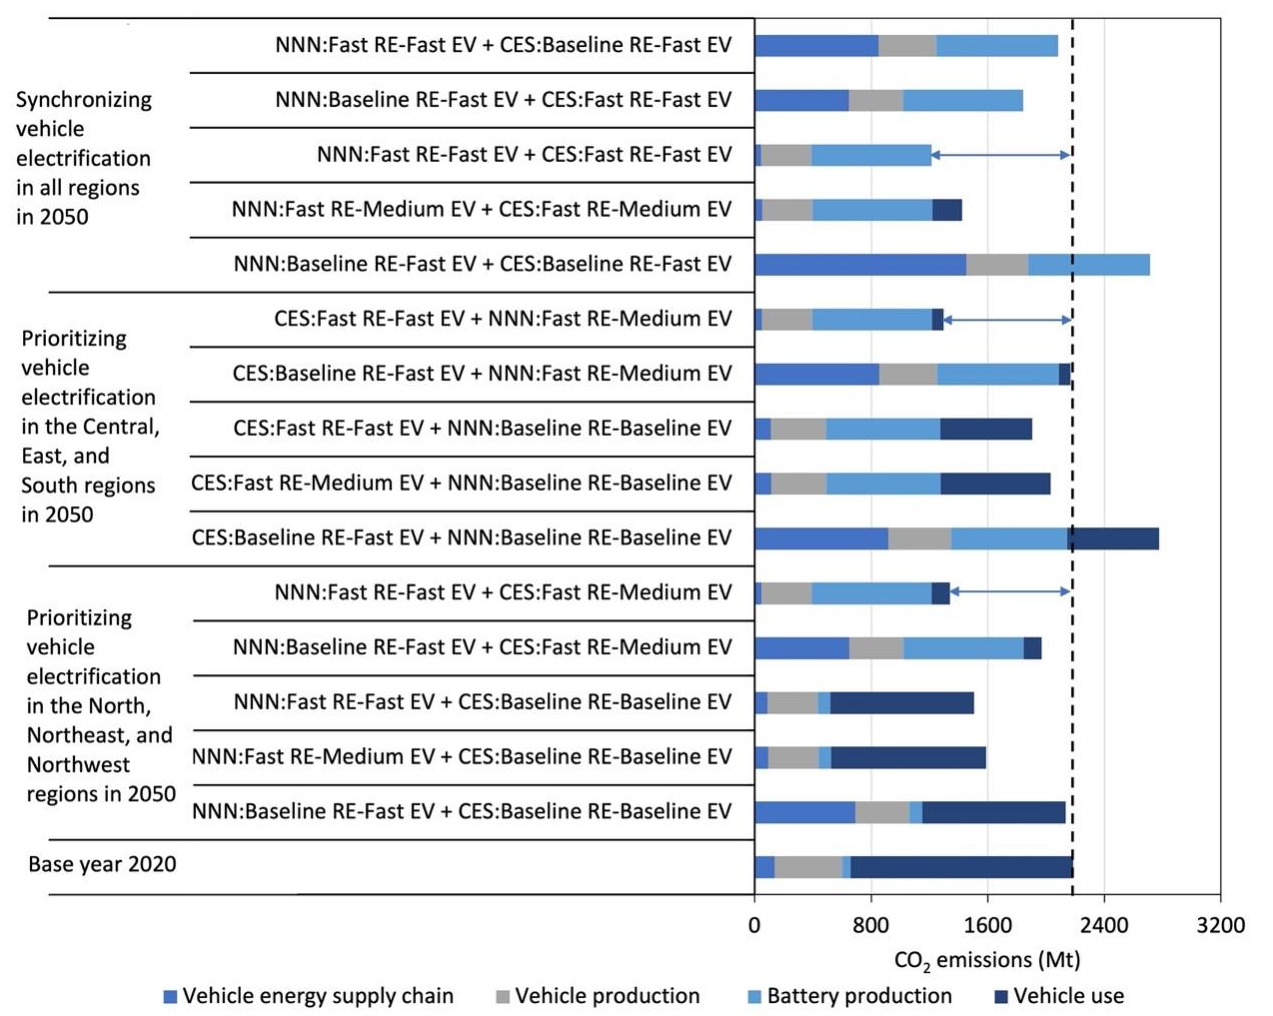
Figure 5. Contributions of different life cycle stages to fleet CO2 emissions with regional vehicle electrification and RE development priorities in the base years 2020 and 2050. RE: Renewable electricity; EV: electric vehicle; NNN: north, northeast, and northwest; CES: central, east, and south.
Conversely, prioritizing fast RE expansion along with medium or fast EV development in the CES regions (where vehicle and battery production are mainly concentrated) while maintaining baseline development in the NNN regions, shifts the main CO2 emission sources from vehicle use to battery production, which becomes one of the largest contributors by 2050 [Figure 5]. In this strategy, reductions in emissions from vehicle use in the CES regions are insufficient to offset increased emissions from battery production under the Fast RE-Fast EV or Fast
Comparing these regional strategies, implementing fast RE expansion with medium or fast EV development in the NNN regions, while keeping in the CES regions at baseline levels, results in greater national fleet CO2 reductions by 2050 than the reverse strategy. In the latter case (prioritizing RE expansion and EV development in the CES regions while the NNN regions remain at baseline levels), emissions from vehicle and battery production are higher, while emissions from vehicle use and vehicle production are lower compared to the former strategy. This result reflects the limited carbonization achievable when RE expansion and EV development stagnate in the NNN regions, despite emission reductions in the CES regions. The least effective strategy is to combine baseline RE expansion with fast EV development in the CES regions, while maintaining baseline levels in the NNN regions. In this case, vehicle use remains the dominant emission source in the NNN regions, and although emissions from vehicle use in the CES regions are nearly eliminated, low RE penetration and increased demand for vehicle and battery production lead to higher emissions from both battery production and the vehicle energy supply chain, outweighing the benefits of electrification.
When fast EV development is synchronized in all regions without parallel RE expansion, emissions are effectively shifted from the vehicle use stage in 2020 to the vehicle energy supply chain and battery production in 2050. If Baseline RE expansion and fast EV development are synchronized in all regions, emissions from vehicle use can be completely mitigated; however, increased emissions from the vehicle energy supply chain and battery production result in national fleet CO2 emissions in 2050 even exceeding 2020 levels. Similarly, implementing baseline RE and fast EV development pathways in the CES regions, while maintaining baseline levels in the NNN regions, also leads to fleet CO2 emissions surpassing 2020 levels. Moreover, even when fast RE expansion and EV development are implemented in the NNN regions, while the CES regions remain at baseline RE and fast EV development, only slight national emission reductions are achieved by 2050. These findings highlight that synchronized vehicle electrification alone is insufficient without parallel, region-wide RE expansion, particularly in the CES regions [Figure 5].
In contrast, when fast RE expansion is synchronized in all regions, substantial reductions in fleet CO2 emissions can be achieved by 2050 under both medium and fast EV development pathways. In this strategy, battery production and vehicle production become the main contributors to fleet life cycle CO2 emissions, as emissions from vehicle use are significantly reduced. Therefore, synchronized fast vehicle electrification combined with fast RE expansion in all regions represents the most effective strategy for decarbonizing China’s road transport. If synchronized EV development is not feasible, then under the condition of synchronized fast RE expansion, prioritizing EV development in the CES regions leads to higher CO2 emission reductions than focusing on the NNN regions [Figure 5]. Emissions from each life cycle stage in 2020 and different regionally prioritized vehicle electrification and RE expansion strategies in 2050 are summarized in Supplementary Table 35.
Contributions of vehicle types to fleet life cycle carbon emissions with different regionally prioritized RE and EV development strategies
The main vehicle types contributing to fleet life cycle CO2 emissions under different regional prioritization strategies for vehicle electrification and RE expansion, both in the base year 2020 and 2050, are LDPVs, HDTs, and LDTs. However, the largest contributors to the changes in CO2 emissions are varied with different regionally prioritized RE and EV development strategies [Figure 6].
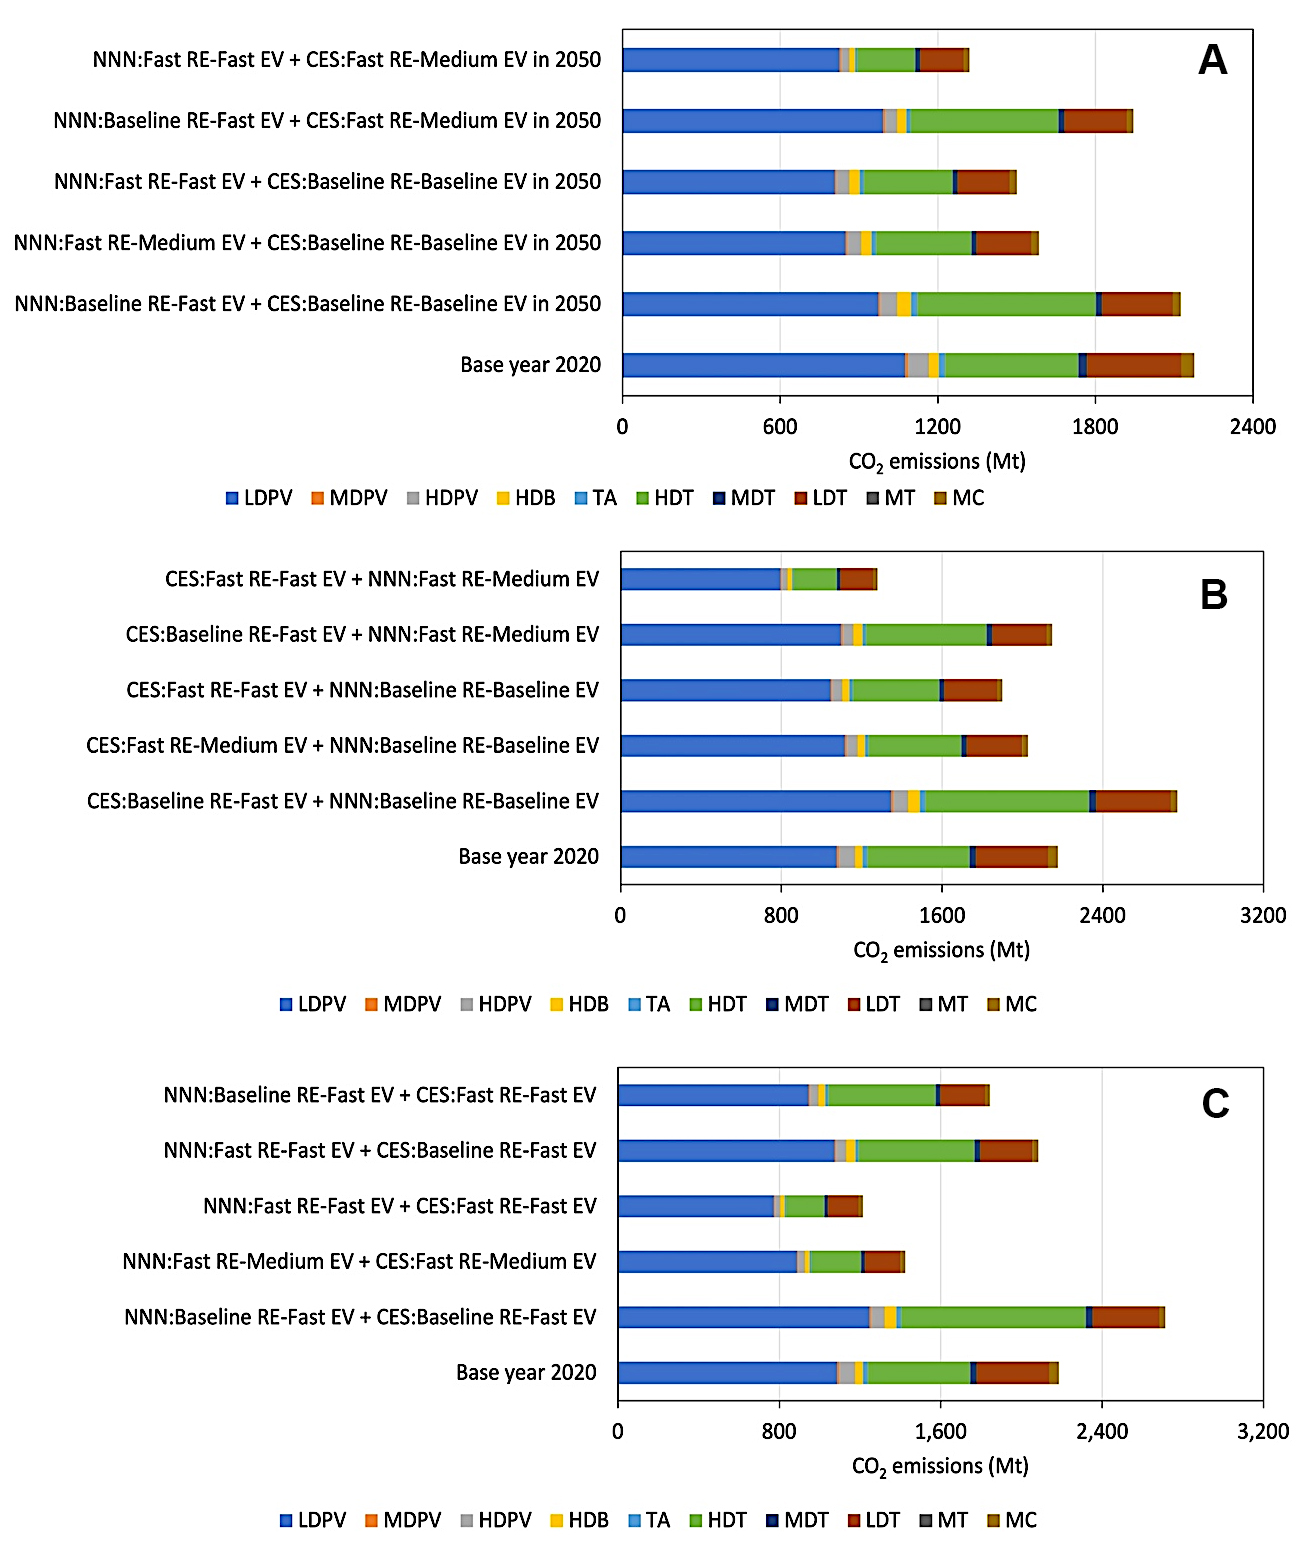
Figure 6. Contribution of vehicle types to fleet life cycle CO2 emissions in the base year 2020 and 2050 with different regional vehicle electrification and RE development priorities: (A) Prioritization of Vehicle Electrification in the North, Northeast, and Northwest Regions; (B) Prioritization of Vehicle Electrification in the Central, East, and South Regions; (C) Synchronization of Vehicle Electrification Across All Regions. RE: Renewable electricity; EV: electric vehicle; NNN: north, northeast, and northwest; CES: central, east, and south; LDPV: light-duty passenger vehicle; MDPV: medium-duty passenger vehicle; HDPV: heavy-duty passenger vehicle; HDB: heavy-duty bus; TA: taxi; HDT: heavy-duty truck; MDT: medium-duty truck; LDT: light-duty truck; MC: motorcycle; MT:
When implementing fast RE and EV development pathways in the NNN regions, while maintaining baseline pathways in the CES regions, electrified LDPVs contribute the most to CO2 emission reductions (274 Mt, 40%), followed by HDTs (170 Mt, 25%) and LDTs (161 Mt, 24%). However, electrified HDTs replace LDPVs contributing the largest emission reductions (286 Mt, 34%), followed by LDPVs (241 Mt, 28%), and LDTs (193 Mt, 23%), when fast RE expansion and EV development pathways are implemented in the NNN regions, combined with fast RE expansion and medium EV development pathways in the CES regions [Figure 6A, Supplementary Tables 36 and 37].
The significant increases in CO2 emissions are mainly attributed to electrified HDTs (306 Mt, 52%) and LDPVs (261 Mt, 45%) when implementing baseline RE expansion and fast EV development pathways in the CES regions, while maintaining baseline RE expansion and EV development pathways in the NNN regions by 2050. However, electrified LDTs (96 Mt, 34%) will be the largest contributors to CO2 emission reductions when implementing fast RE and EV development in the CES regions, while maintaining baseline pathways in the NNN regions, followed by HDTs (77 Mt, 27%), LDPVs (40 Mt, 14%), and HDPVs (28 Mt, 10%). When fast RE expansion and EV development pathways are implemented in the CES regions, combined with fast RE expansion and medium EV development pathways in the NNN regions by 2050, electrified HDTs (291 Mt, 33%) will be the largest contributors to CO2 emission reductions, followed by LDPVs
A notable increase in CO2 emissions is observed when baseline RE expansion and fast EV development pathways are implemented in all regions by 2050. This increase is primarily driven by electrified HDTs
Limitations and future work
This study evaluated the impacts of regional prioritization in vehicle electrification and RE expansion on life cycle CO2 emissions of China’s road transport fleet from 2020 to 2050, covering the vehicle energy supply chain, vehicle production (excluding batteries), battery production, and vehicle use. Some limitations should be acknowledged. First, the EOL stage of vehicles and batteries was not considered due to the lack of consistent data on retirement patterns, recycling rates, and treatment technologies at the provincial and grid levels. Although EOL processes are expected to contribute less than the production and use stage, their omission may underestimate the potential benefits of large-scale recycling and material recovery. Second, vehicle and battery production were modeled using component-based processes rather than material-level inventories, and their spatial distribution was assumed constant over time, even though relocation of manufacturing hubs could substantially change regional emission patterns. Third, the composition of regional power grids was assumed to follow scenario-based trajectories without capturing dynamic changes such as interregional transmission, temporal variability of renewable output, or improvements in grid flexibility. Finally, potential technological advances (e.g., lightweighting, use of recycled or alternative materials, low-carbon industrial processes) and future policy shifts (e.g., carbon pricing, stricter recycling regulations) were not explicitly incorporated, which may lead to an underestimation of future mitigation potential.
Future work should therefore extend system boundaries to include EOL and recycling pathways, particularly for batteries, to capture circular economy benefits. Incorporating shifts in the geographic distribution of the vehicle and battery industries would improve understanding of regional emission transfers. Integrating technological learning curves, innovation trajectories, and policy uncertainties into scenario analysis would further improve the robustness of long-term decarbonization pathways for China’s transport sector.
Policy implications and suggestions
To accelerate the decarbonization of China’s road transport, our findings highlight the need for regionally differentiated strategies that complement existing literature while introducing additional region- and pathway-specific insights.
(1) Regionally differentiated pathways: The effectiveness of vehicle electrification depends strongly on upstream industrial decarbonization. If upstream industries remain carbon-intensive, prioritizing electrification in the NNN regions delivers greater life cycle CO2 reductions than focusing on CES regions by 2050. If upstream decarbonization proceeds in parallel with power sector transformation, prioritizing vehicle electrification in the CES regions has more potential to reduce national life cycle CO2 emissions.
(2) Electrification prioritization by vehicle type: Electrification efforts should focus on LDPVs, HDTs, and LDTs, with a particular emphasis on HDTs, regardless of whether the policy emphasis is on the NNN or CES regions.
(3) Regional prioritization for establishing recycled material system: Establishing a comprehensive circular system for vehicles, batteries, and RE infrastructure is essential[49-52]. In regions with slow speed to decarbonize upstream industries (mining, metallurgy, and chemical), the development of trackable recycled material system should be prioritized to integrate recycled materials (e.g., metals, plastics, and glass) into the manufacturing of batteries[53-57], EVs[58], wind turbines[59,60], and photovoltaic module[50,61]. Although carbon reduction cannot be achieved through decarbonization of upstream industries in these regions, the usage of recycled materials can reduce dependence on critical raw materials and avoid emissions from material extraction and processing.
(4) Material substitution and industrial relocation: Policymakers should encourage manufacturers to adopt low-carbon, high-quality, and lightweight materials[62,63], and remanufactured vehicle and battery components to reduce associated emissions from key materials extraction[55,57]. Vehicle and battery production hubs should shift to regions with highly decarbonized upstream industries and efficient material recycling systems, thereby lowering life cycle carbon emissions throughout the entire industry supply chain.
(5) Strengthening regional collaboration in vehicle and battery recycling: In line with the Industry Standard Specifications for the Comprehensive Utilization of Waste Power Batteries from New Energy Vehicles (2024 Edition) and the Guidelines for Expediting the Development of a Circular Waste Management System[49,64], a two-tiered recycling system should be established as a part of circular system for vehicles and batteries:
• CES regions (as manufacturing hubs) should establish large-scale recycling centers.
• NNN regions should develop decentralized recycling networks for efficient collection and processing of EOL vehicles and batteries.
CONCLUSION
The results indicate that prioritizing vehicle electrification in the NNN regions leads to a reduction in national life cycle CO2 emissions from 2,186 Mt in 2020 to 1,340-2,136 Mt by 2050. In contrast, prioritizing vehicle electrification in the CES regions results in emissions ranging from 1,297 to 2,771 Mt by 2050. Implementing fast RE expansion and EV development pathways in the NNN regions, while maintaining baseline pathways in the CES regions, achieves a CO2 emission reduction of 681 Mt by 2050. Conversely, only 285 Mt of CO2 emission reductions can be achieved when fast RE expansion and EV development pathways are implemented in the CES regions. When combining fast RE expansion and EV development pathways in the NNN regions with fast RE expansion and medium EV development pathways in the CES regions, CO2 emissions are reduced by 846 Mt by 2050. Alternatively, when fast RE expansion and EV development pathways are applied in the CES regions and fast RE expansion combined with medium EV development is adopted in the NNN regions, CO2 emissions are reduced by 889 Mt by 2050. Moreover, implementing baseline RE and fast EV development pathways in the CES regions, while maintaining baseline RE and EV development pathways in the NNN regions, results in a 585 Mt increase in CO2 emissions by 2050. CO2 emission reductions are generally greater when prioritizing vehicle electrification in the NNN regions compared to the CES regions. However, vehicle electrification in the CES regions contributes to higher long-term CO2 emission reductions due to the greater decarbonization potential in these regions. When synchronizing vehicle electrification across all regions, combined with varying RE expansion pathways, CO2 emissions range from 1,213 to 2,713 Mt by 2050.
When prioritizing vehicle electrification in the NNN regions, the largest CO2 emission reductions by 2050 occur when fast RE expansion and EV development pathways in the NNN regions are combined with fast RE expansion and medium EV development pathways in the CES regions. This is driven by the electrification of HDTs (286 Mt, 34%), LDPVs (241 Mt, 28%), and LDTs (193 Mt, 23%). When prioritizing vehicle electrification in the CES regions, the most significant CO2 emission reductions are achieved when fast RE expansion and EV development pathways are implemented in the CES regions, alongside fast RE expansion and medium EV development pathways in the NNN regions. The primary contributors to this reduction are electrified HDTs (291 Mt, 33%), LDPVs (272 Mt, 31%), and LDTs (197 Mt, 22%) by 2050. Implementing synchronized fast RE expansion and EV development pathways in all regions leads to substantial reductions in CO2 emissions by 2050, primarily driven by electrified LDPVs (322 Mt, 33%), HDTs (317 Mt, 32%), and LDTs (208 Mt, 21%).
These results suggest that prioritizing vehicle electrification and RE expansion in the NNN regions is more effective for reducing national life cycle CO2 emissions, especially if the current distribution of vehicle and battery manufacturing industries remains unchanged and China’s RE and EV development plans cannot be uniformly implemented. If full implementation of these plans in all regions is feasible, accelerating vehicle electrification in the CES regions would maximize long-term decarbonization of China’s road transport.
DECLARATIONS
Acknowledgments
Li, X. wishes to thank the China Scholarship Council and the University of Exeter for the financial support of his PhD.
Authors’ contributions
Writing - review and editing, writing - original draft, visualization, investigation, funding acquisition, data curation: Li, X.
Writing - review and editing, supervision, project administration, methodology, conceptualization: Yan, X.
Availability of data and materials
The data that support the findings of this study are available from the corresponding author upon reasonable request.
Financial support and sponsorship
Financial support for Li, X.’s PhD was provided by the China Scholarship Council and the University of Exeter.
Conflicts of interest
Yan, X. is an Editorial Board member of the journal Carbon Footprints. Yan, X. was not involved in any steps of the editorial process, notably including reviewer selection, manuscript handling, or decision making. Li, X. declared that there are no conflicts of interest.
Ethical approval and consent to participate
Not applicable.
Consent for publication
Not applicable.
Copyright
© The Author(s) 2025.
Supplementary Materials
REFERENCES
1. Executive summary. An energy sector roadmap to carbon neutrality in China. IEA (2021) Paris. https://www.iea.org/reports/an-energy-sector-roadmap-to-carbon-neutrality-in-china/executive-summary (accessed 2025-10-28).
2. CO2 Emissions by country. Worldometer. https://www.worldometers.info/co2-emissions/co2-emissions-by-country/ (accessed 2025-10-28).
3. Lu, Q.; Duan, H.; Shi, H.; et al. Decarbonization scenarios and carbon reduction potential for China’s road transportation by 2060. npj. Urban. Sustain. 2022, 2, 34.
4. Zhang, R.; Hanaoka, T. Deployment of electric vehicles in China to meet the carbon neutral target by 2060: Provincial disparities in energy systems, CO2 emissions, and cost effectiveness. Resour. Conserv. Recycl. 2021, 170, 105622.
5. Li, X.; Yan, X. Fast penetration of electric vehicles in China cannot achieve steep cuts in air emissions from road transport without synchronized renewable electricity expansion. Energy 2024, 301, 131737.
6. Yao, X.; Fan, Y.; Zhao, F.; Ma, S. Economic and climate benefits of vehicle-to-grid for low-carbon transitions of power systems: a case study of China’s 2030 renewable energy target. J. Clean. Prod. 2022, 330, 129833.
7. New energy vehicle industry development plan (2021-2035). https://www.gov.cn/zhengce/zhengceku/2020-11/02/content_5556716.htm (accessed 2025-10-28).
8. Xia, X.; Li, P.; Xia, Z.; Wu, R.; Cheng, Y. Life cycle carbon footprint of electric vehicles in different countries: a review. Sep. Purif. Technol. 2022, 301, 122063.
9. Li, F.; Ou, R.; Xiao, X.; et al. Regional comparison of electric vehicle adoption and emission reduction effects in China. Resour. Conserv. Recycl. 2019, 149, 714-26.
10. Shafique, M.; Luo, X. Environmental life cycle assessment of battery electric vehicles from the current and future energy mix perspective. J. Environ. Manage. 2022, 303, 114050.
11. Li, X.; Liu, Y.; Qu, Y.; Ding, L.; Yan, X. Effect of electric vehicles and renewable electricity on future life cycle air emissions from China’s road transport fleet. Energy 2025, 318, 134969.
12. Xia, X.; Li, P. A review of the life cycle assessment of electric vehicles: considering the influence of batteries. Sci. Total. Environ. 2022, 814, 152870.
13. Shafique, M.; Azam, A.; Rafiq, M.; Luo, X. Life cycle assessment of electric vehicles and internal combustion engine vehicles: a case study of Hong Kong. Res. Transp. Econ. 2022, 91, 101112.
14. Safarian, S. Environmental and energy impacts of battery electric and conventional vehicles: a study in Sweden under recycling scenarios. Fuel. Commun. 2023, 14, 100083.
15. Franzò, S.; Nasca, A. The environmental impact of electric vehicles: a novel life cycle-based evaluation framework and its applications to multi-country scenarios. J. Clean. Prod. 2021, 315, 128005.
16. Duan, S.; Qiu, Z.; Liu, Z.; Liu, L. Impact assessment of vehicle electrification pathways on emissions of CO2 and air pollution in Xi’an, China. Sci. Total. Environ. 2023, 893, 164856.
17. Wang, L.; Yu, Y.; Huang, K.; Zhang, Z.; Li, X. The inharmonious mechanism of CO2, NOx, SO2, and PM2.5 electric vehicle emission reductions in Northern China. J. Environ. Manage. 2020, 274, 111236.
18. Yuksel, T.; Michalek, J. J. Effects of regional temperature on electric vehicle efficiency, range, and emissions in the United States. Environ. Sci. Technol. 2015, 49, 3974-80.
19. Wu, D.; Guo, F.; Field, F. R. I. I. I.; et al. Regional heterogeneity in the emissions benefits of electrified and lightweighted light-duty vehicles. Environ. Sci. Technol. 2019, 53, 10560-70.
20. Gan, Y.; Lu, Z.; He, X.; et al. Provincial greenhouse gas emissions of gasoline and plug-in electric vehicles in China: comparison from the consumption-based electricity perspective. Environ. Sci. Technol. 2021, 55, 6944-56.
21. Choi, H.; Shin, J.; Woo, J. Effect of electricity generation mix on battery electric vehicle adoption and its environmental impact. Energy. Policy. 2018, 121, 13-24.
22. Shen, W.; Han, W.; Wallington, T. J. Current and future greenhouse gas emissions associated with electricity generation in China: implications for electric vehicles. Environ. Sci. Technol. 2014, 48, 7069-75.
23. Hu, D.; Zhou, K.; Hu, R.; Yang, J. Provincial inequalities in life cycle carbon dioxide emissions and air pollutants from electric vehicles in China. Commun. Earth. Environ. 2024, 5, 726.
24. Tamayao, M. A. M.; Michalek, J. J.; Hendrickson, C.; et al. Regional variability and uncertainty of electric vehicle life cycle CO2 emissions across the United States. Environ. Sci. Technol. 2015, 49, 8844-55.
25. Duan, C.; Motter, A. E. Grid congestion stymies climate benefit from U.S. vehicle electrification. Nat. Commun. 2025, 16, 7242.
26. Moro, A.; Lonza, L. Electricity carbon intensity in European Member States: Impacts on GHG emissions of electric vehicles. Transp. Res. D. Transp. Environ. 2018, 64, 5-14.
27. Ellingsen L, Jayne Thorne R, Wind J, Figenbaum E, Romare M, Nordelöf A. Life cycle assessment of battery electric buses. Transp. Res. Part. D. Transp. Environ. 2022, 112, 103498.
28. Abdul-Manan, A. F. N.; Gordillo Zavaleta, V.; Agarwal, A. K.; et al. Electrifying passenger road transport in India requires near-term electricity grid decarbonisation. Nat. Commun. 2022, 13, 2095.
29. Aryan, Y.; CK, A.; Dikshit, A. K.; Shinde, A. M. Comparative life cycle assessment of battery electric vehicles in developing countries under current and future electricity mix scenarios. Discov. Sustain. 2025, 6, 675.
30. Peng, T.; Ren, L.; Ou, X. Development and application of life-cycle energy consumption and carbon footprint analysis model for passenger vehicles in China. Energy 2023, 282, 128412.
31. Guo, X.; Sun, Y.; Ren, D. Life cycle carbon emission and cost-effectiveness analysis of electric vehicles in China. Energy. Sustain. Dev. 2023, 72, 1-10.
32. Zhang, H.; Zhao, F.; Hao, H.; Liu, Z. Comparative analysis of life cycle greenhouse gas emission of passenger cars: a case study in China. Energy 2023, 265, 126282.
33. Gan, Y.; Lu, Z.; He, X.; Wang, M.; Amer, A. A. Cradle-to-grave lifecycle analysis of greenhouse gas emissions of light-duty passenger vehicles in China: towards a carbon-neutral future. Sustainability 2023, 15, 2627.
34. Qiao, Q.; Zhao, F.; Liu, Z.; Jiang, S.; Hao, H. Cradle-to-gate greenhouse gas emissions of battery electric and internal combustion engine vehicles in China. Applied. Energy. 2017, 204, 1399-411.
35. Tang, B.; Xu, Y.; Wang, M. Life cycle assessment of battery electric and internal combustion engine vehicles considering the impact of electricity generation mix: a case study in China. Atmosphere 2022, 13, 252.
36. Yu, Y.; Xu, H.; Cheng, J.; et al. Which type of electric vehicle is worth promoting mostly in the context of carbon peaking and carbon neutrality? A case study for a metropolis in China. Sci. Total. Environ. 2022, 837, 155626.
37. Yang, L.; Yu, B.; Yang, B.; Chen, H.; Malima, G.; Wei, Y. Life cycle environmental assessment of electric and internal combustion engine vehicles in China. J. Clean. Prod. 2021, 285, 124899.
38. Chen, Q.; Lai, X.; Gu, H.; et al. Investigating carbon footprint and carbon reduction potential using a cradle-to-cradle LCA approach on lithium-ion batteries for electric vehicles in China. J. Clean. Prod. 2022, 369, 133342.
39. Qiao, Q.; Zhao, F.; Liu, Z.; He, X.; Hao, H. Life cycle greenhouse gas emissions of electric vehicles in China: combining the vehicle cycle and fuel cycle. Energy 2019, 177, 222-33.
40. Liu, D.; Xu, L.; Sadia, U. H.; Wang, H. Evaluating the CO2 emission reduction effect of China’s battery electric vehicle promotion efforts. Atmos. Pollut. Res. 2021, 12, 101115.
41. China’s NEV market penetration rate at 5.4% in 2020: industry report. https://www.chinadaily.com.cn/a/202108/27/WS61284d64a310efa1bd66b8ed.html (accessed 2025-10-28).
42. China Electricity Council. China electric power statistical yearbook 2021, China Statistics Press. https://www.stats.gov.cn/zs/tjwh/tjkw/tjzl/202302/t20230215_1907998.html (accessed 2025-10-28).
43. National Bureau of Statistics. China statistical yearbook 2021. https://www.stats.gov.cn/sj/ndsj/2021/indexeh.htm (accessed 2025-10-28).
44. Peng, T.; Ou, X.; Yuan, Z.; Yan, X.; Zhang, X. Development and application of China provincial road transport energy demand and GHG emissions analysis model. Appl. Energy. 2018, 222, 313-28.
45. China automotive industry yearbook 2021, China Association of Automobile Manufacturers. https://www.shujuku.org/china-automobile-industry-yearbook.html (accessed 2025-10-31).
46. China Electronics and Information Industry Development Research Institute. White paper on the development of lithium-ion battery industry. 2021 Edition. https://baijiahao.baidu.com/s?id=1715028998120746039&wfr=spider&for=pc (accessed 2025-10-31).
47. ecoinvent. Data with purpose: ecoinvent is a trusted global resource for environmental data. https://ecoinvent.org/ (accessed 2025-10-28).
48. OpenLca.org. openLCA is a free, professional Life Cycle Assessment (LCA) and footprint software with a broad range of features and many available databases, developed by GreenDelta since 2006. https://www.openlca.org/ (accessed 2025-10-28).
49. China State Council. Guidelines for expediting the development of a circular waste management system. https://www.gov.cn/zhengce/zhengceku/202402/content_6931080.htm (accessed 2025-10-28).
50. Wang, X.; Xue, J.; Hou, X. Barriers analysis to Chinese waste photovoltaic module recycling under the background of “double carbon”. Renew. Energy. 2023, 214, 39-54.
51. Baldassarre, B.; Carrara, S. Critical raw materials, circular economy, sustainable development: EU policy reflections for future research and innovation. Resour. Conserv. Recycl. 2025, 215, 108060.
52. Bleischwitz, R.; Yang, M.; Huang, B.; et al. The circular economy in China: Achievements, challenges and potential implications for decarbonisation. Resour. Conserv. Recycl. 2022, 183, 106350.
53. Xu, C.; Dai, Q.; Gaines, L.; Hu, M.; Tukker, A.; Steubing, B. Future material demand for automotive lithium-based batteries. Commun. Mater. 2020, 1, 99.
54. Maisel, F.; Neef, C.; Marscheider-weidemann, F.; Nissen, N. F. A forecast on future raw material demand and recycling potential of lithium-ion batteries in electric vehicles. Resour. Conserv. Recycl. 2023, 192, 106920.
55. Jiang, R.; Wu, C.; Feng, W.; et al. Impact of electric vehicle battery recycling on reducing raw material demand and battery life-cycle carbon emissions in China. Sci. Rep. 2025, 15, 2267.
56. Yu, M.; Bai, B.; Xiong, S.; Liao, X. Evaluating environmental impacts and economic performance of remanufacturing electric vehicle lithium-ion batteries. J. Clean. Prod. 2021, 321, 128935.
57. Chen, Q.; Lai, X.; Hou, Y.; et al. Investigating the environmental impacts of different direct material recycling and battery remanufacturing technologies on two types of retired lithium-ion batteries from electric vehicles in China. Sep. Purif. Technol. 2023, 308, 122966.
58. Qiao, Q.; Zhao, F.; Liu, Z.; Hao, H. Electric vehicle recycling in China: economic and environmental benefits. Resour. Conserv. Recycl. 2019, 140, 45-53.
59. Majewski, P.; Florin, N.; Jit, J.; Stewart, R. A. End-of-life policy considerations for wind turbine blades. Renew. Sustain. Energy. Rev. 2022, 164, 112538.
60. Alavi, Z.; Khalilpour, K.; Florin, N.; Hadigheh, A.; Hoadley, A. End-of-life wind turbine blade management across energy transition: a life cycle analysis. Resour. Conserv. Recycl. 2025, 213, 108008.
61. Yuan, X.; Xu, Z. Life cycle assessment of decommissioned silicon photovoltaic module recycling using different technological configurations in China. J. Environ. Manage. 2024, 370, 122476.
62. Luk, J. M.; Kim, H. C.; De Kleine, R.; Wallington, T. J.; MacLean, H. L. Review of the fuel saving, life cycle GHG emission, and ownership cost impacts of lightweighting vehicles with different powertrains. Environ. Sci. Technol. 2017, 51, 8215-28.
63. Raugei, M.; Morrey, D.; Hutchinson, A.; Winfield, P. A coherent life cycle assessment of a range of lightweighting strategies for compact vehicles. J. Clean. Prod. 2015, 108, 1168-76.
64. Ministry of Industry and Information Technology of the People’s Republic of China. Industry standard specifications for the comprehensive utilization of waste power batteries from new energy vehicles (2024 Edition). https://www.miit.gov.cn/jgsj/jns/wjfb/art/2024/art_a05ad4164f20482088a97fcbff80b987.html (accessed 2025-10-31).
Cite This Article
How to Cite
Download Citation
Export Citation File:
Type of Import
Tips on Downloading Citation
Citation Manager File Format
Type of Import
Direct Import: When the Direct Import option is selected (the default state), a dialogue box will give you the option to Save or Open the downloaded citation data. Choosing Open will either launch your citation manager or give you a choice of applications with which to use the metadata. The Save option saves the file locally for later use.
Indirect Import: When the Indirect Import option is selected, the metadata is displayed and may be copied and pasted as needed.
About This Article
Copyright

Data & Comments
Data
0


Comments
Comments must be written in English. Spam, offensive content, impersonation, and private information will not be permitted. If any comment is reported and identified as inappropriate content by OAE staff, the comment will be removed without notice. If you have any queries or need any help, please contact us at [email protected].