

Decoupling material consumption from economic development? Evidence of dematerialization from a multi-decade analysis of 176 countries
 0
0  , ,
, , Abstract
Dematerialization of the economy is crucial for reducing the global carbon footprint. However, empirical evidence on how different paths of dematerialization can be achieved remains limited. This paper examines historical trends (1970-2015) in material consumption, accounting for a broad range of materials, including biomass, metal ores, non-metallic minerals, and fossil fuels, across 176 countries grouped by income level. Using regression and statistical analyses, we find that material consumption generally increases with economic growth across all income groups in linear models, reflecting a strong coupling between material use and earlier stages of development. In contrast, second- and third-order polynomial analyses provide robust evidence of an inverted U-shaped relationship between income and material use, especially in upper-middle- and high-income countries. This pattern suggests a turning point in material consumption as economies mature. A disaggregated analysis further shows that forms of dematerialization vary across income groups and material types. Based on the data, we identify four main theoretical mechanisms that help explain the inverted U-shaped relationship between economic growth and material use: the scale effect, the composition effect, the technique effect, and the policy effect. These differences highlight distinct pathways of material consumption as countries advance economically, indicating that more sustainable trajectories are achievable.
Keywords
INTRODUCTION
The consumption of raw materials underpins modern economies, livelihoods, and social well-being - whether metals, non-metallic minerals, fossil fuels, water, or biomass. At the same time, dematerialization of the economy is essential for reducing carbon footprints. However, the extent to which different dematerialization pathways are feasible, and how these vary by material type, remains underexplored. Achieving a viable low-carbon society will therefore depend on reconciling economic dematerialization with the societal demand for growth, particularly in developing countries.
Global raw material consumption increased fourfold between 1970 and 2020[1]. Between 2018 and 2020 alone, it rose by over 8%, while the share of recycled materials fell from 9.1% to 8.6%. This means a growing proportion of extracted materials is returning to the environment as waste and emissions. This large-scale mobilization of resources is driven both by accelerating industrialization in emerging economies and by persistently high levels of material use in advanced economies[2]. New categories of materials, such as technology metals, have also seen rapidly rising demand in recent decades[3]. Although essential for a
Confronting these challenges requires an urgent effort to decouple material use from economic development in order to achieve sustainable production and consumption pathways, a central element of Sustainable Development Goal 12[13]. Despite progress in relative decoupling - where material and energy intensity has declined while gross domestic product (GDP) has continued to grow - the absolute global consumption of raw material and energy continues to rise[2,14]. The long-term prospects for sustainable consumption and production, therefore, depend on advancing the economy-environment debate by focusing particular attention on the dynamics of Material Consumption (MC) across countries.
In the field of environmental and resource economics, the Environmental Kuznets Curve (EKC) hypothesis has been one of the central frameworks for addressing the long-standing debates on the relationship between economic growth and environmental quality. Since the seminal work of Kuznets[15] and subsequent developments in the environmental area[16], a major focus of the literature has been to test the EKC hypothesis, which posits an inverted U-shaped relationship between economic activity - typically measured by GDP per capita - and per capita emissions of various pollutants. According to the EKC hypothesis, in the early stages of development, economies are dominated by resource-intensive industrial production, and income growth takes precedence over environmental protection. However, once a certain income threshold is reached, further economic growth is associated with environmental improvements[17].
A similar reasoning has been applied to the relationship between economic development and material use, referred to by some scholars[18] as the Material Kuznets Curve (MKC), or the “intensity of use hypothesis”. The MKC suggests that there is an inverted U-shaped relationship between material use (or its intensity of use) and economic growth. This framework explains how per capita GDP affects material consumption across different stages of development. At low income levels, material demand is modest, reflecting the dominance of unmechanized agriculture. With industrialization, material-intensive sectors expand, and demand for raw materials rises. In later stages, however, economies shift from material-intensive industrialization toward services, which are less dependent on raw materials, leading to a decline in material intensity. As a result, a negative correlation between material use and per capita income emerges. According to Zhang et al.[12], examining the link between material use and economic growth provides a valuable explanation of long-term trends in material consumption and serves as an important tool for promoting dematerialization and managing societal material metabolism. Following Malenbaum's influential work[19] on the dynamics of metal consumption, extensive studies have investigated the MKC hypothesis[18,20-23], focusing mainly on the relationship between economic growth and the use of metals (aluminum, zinc, tin, lead, and copper). These studies, however, have produced mixed results without a clear consensus. Given the wide range of raw materials involved, many scholars argue that comprehensive analyses should rely on broad measures of material consumption rather than focusing on specific metals.
Building on this perspective, the present study aims to provide a comprehensive picture of national resource use by constructing a public database of material consumption based on secondary data from dozens of countries, and by analyzing the links between resource use and economic development. Resource use is defined here as the sum of raw materials extracted domestically and primary material imports, minus exports. This approach captures not only the total availability of raw materials in an economy but also differentiates between export-driven consumption and consumption driven by domestic demand. As noted in[8], resource use can be classified into three major categories: minerals (metal ores, industrial minerals, and construction materials), biomass (from grazing, fishing, food, wood, and related activities), and fossil fuels (coal, crude oil, natural gas, and others). Because material consumption is directly linked to Greenhouse Gas (GHG) emissions, it has an immediate impact on environmental degradation. Moreover, as highlighted in[11], economic recessions can temporarily reduce raw material extraction and consumption, leading to short-term dematerialization. However, while natural resource endowments shape the material intensity of economies (e.g., countries rich in hydropower may rely less on coal for electricity generation), long-term sustainable dematerialization requires structural transformation from resource-intensive to less
Theoretically, the relationship between material consumption and economic growth depends on the properties of preferences and technology as income increases[30]. Under homothetic preferences, per capita income growth leads to higher demand for raw materials. By contrast, under non-homothetic preferences, the response of raw material consumption to growth depends on the degree of relative risk aversion and the elasticity of substitution in production between raw materials and environmentally friendly inputs. Moreover, delays in the diffusion of technological change partly explain cross-country differences in achieving sustainable material consumption[31,32].
Our study contributes to the emerging literature on the relationship between material consumption and stages of economic development in several ways. First, despite the growing body of work on carbon footprints[33], little research has examined the role of economic dematerialization in reducing carbon footprints. Our research addresses this gap by analyzing potential pathways through empirical evidence. Second, while previous studies have largely focused on the link between metal intensity and economic growth[18,20,23], we extend the scope to a broad measure of material consumption. For example, Pothen and Welsch[34] examined the relationship between domestic material consumption and economic growth using standard fixed-effects panel models. A major limitation of such parametric models is that they require specifying the statistical structure of the relationship in advance, which constrains the analysis by imposing a predefined link among variables. Furthermore, the Kuznets curve is not deterministic; identifying trends requires flexible approaches based on regression and statistical exploration[35]. Third, to account for heterogeneity across countries, our analysis divides panel members according to income level. Unlike previous studies, we assume that the MKC hypothesis is not universal but may vary by stage of economic development. Fourth, this research presents its findings using straightforward descriptive statistics, which provide clearer and more intuitive visual evidence compared with multiple regression analyses that may obscure relationships and produce conflicting results. Finally, we compiled a comprehensive database covering material consumption in 176 countries from 1970 to 2015. This database, developed by the authors, is available for future research (https://disaggregated-raw-materials.herokuapp.com/).
METHODOLOGY AND DATA DESCRIPTION
Our data on raw material consumption were drawn from the Global Material Flows Database, compiled by the International Resource Panel (IRP)[36] under the United Nations Environment Programme (UNEP). This database is among the most comprehensive sources available for information on the consumption of different types of materials. In the IRP database, raw material consumption is categorized into four main groups: metal ores, non-metallic minerals, fossil fuels, and biomass. The dependent variable is measured as material consumption per capita. To examine the link between raw material consumption and income (the independent variable), we employed real Gross Domestic Product Per Capita (GDPPC), expressed in constant 2,000 US dollars, as a proxy for income. GDP data were obtained from the World Bank’s World Development Indicators[37]. We use real GDP rather than Purchasing Power Parity (PPP) because the former provides more consistent estimates over long time periods[38]. Thus, inflation is accounted for, but
To ensure comparability across income levels, countries were classified into four subgroups based on Gross National Income Per Capita (GNIPC), following the World Bank’s 2005 classification[39]. GNIPC is the standard measure used to classify national income levels [Supplementary Table 1]:
• Low-income economies: GNIPC of USD 875 or less (2005).
• Middle-income economies: GNIPC of greater than USD 875 but less than $10,726 (2005).
• Lower middle-income and upper middle-income economies are divided at a GNIPC threshold of USD 3,465 (2005).
• High-income economies: GNIPC of USD 10,726 or more (2005).
Our study compiles data for a panel of 176 countries over the period 1970-2015. We believe this sample provides sufficient breadth and depth to generate reliable results, given the large number of countries and the long time span covered. The four material categories analyzed in this study are further divided into 13 subcategories, as shown in Table 1. Technical details on the dataset are available in the Technical Annex for Global Material Flows Database (International Resource Panel, 2020). For the Fossil Fuels category in particular, we analyzed Coal, Petroleum, and Natural Gas. All units are presented in tons, and the time series provides annual data from 1970 to 2015, covering 46 consecutive years. Domestic Material Consumption (DMC) is also reported. DMC is the total amount of materials directly used within a country’s or region’s economy, excluding hidden flows. Data quality varied across the series. Table 2 shows the percentage of null values for each dataset. Here, “null values” denote missing data points, included to enhance transparency regarding the completeness of the time-series data used in the analysis.
Materials and subcategories
| Materials | Subcategory |
| Biomass | Crops |
| Biomass | Crop residues |
| Biomass | Grazed biomass and fodder crops |
| Biomass | Wood |
| Biomass | Wild catch and harvest |
| Metal ores | Ferrous ores |
| Metal ores | Non-ferrous ores |
| Non-metallic minerals | -Construction-dominant |
| Non-metallic minerals | -Industrial- or agricultural-dominant |
| Fossil fuels | Coal |
| Fossil fuels | Petroleum |
| Fossil fuels | Natural gas |
| Fossil fuels | Oil shale and tar sands |
Data quality expressed as the percentage of null values (missing data points)
| Dataset | Null values (%) |
| Biomass_per_capita | 0.0 |
| Coal_per_capita | 32.63 |
| DMC_per_capita | 0.0 |
| Fossil_fuels_per_capita | 18.01 |
| GDP_USD_2005_per_capita | 0.25 |
| Metal_ores_per_capita | 1.25 |
| Natural_gas_per_capita | 37.15 |
| Non-metallic_minerals_per_capita | 1.07 |
| Petroleum_per_capita | 21.04 |
All statistical analyses and figure plotting were conducted in Python (v3.8). When applicable, z-scores were applied, corresponding to the transformation of the series {xi} into another series {zi}:
Where
To capture potential nonlinear relationships between these variables and GNIPC, we also considered polynomial regression. This involves adding higher order terms as independent variables before performing least-squares regression. For instance, allowing a cubic (k = 3) relationship between any raw material variable {yi} and GNIPC {xi} yields:
where β0, β1, β2, and β3 are model coefficients. The canonical Kuznets curve corresponds to the case of k = 2.
In the results section, time is encoded visually using marker size and transparency: larger, less transparent markers represent later years. Figure 1 illustrates this convention. Fitted polynomial regressions (least squares) are shown in Figures 2-5, highlighting the underlying trends between GDP per capita and material use within each income group.
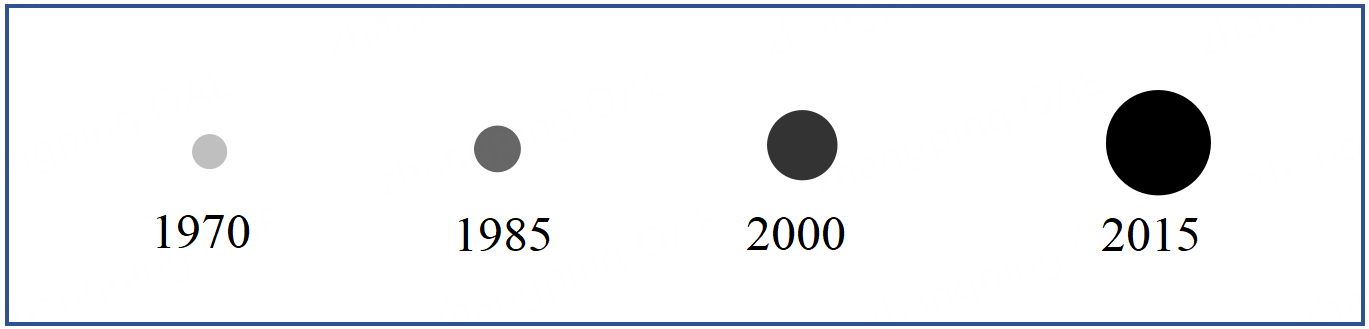
Figure 1. Visual reference for the year, conveyed by marker size and transparency in subsequent figures.
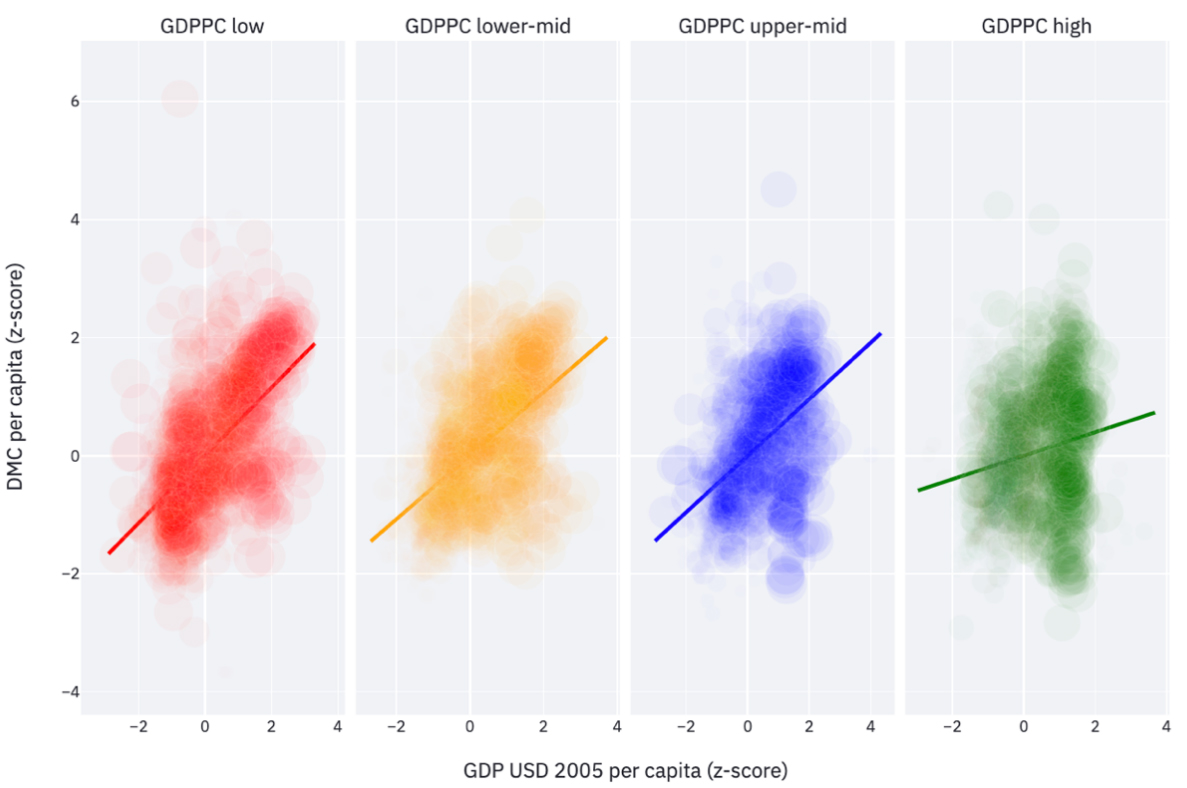
Figure 2. Relationship between material consumption and per capita income across income groups. DMC: Domestic material consumption; GDPPC: gross domestic product per capita.
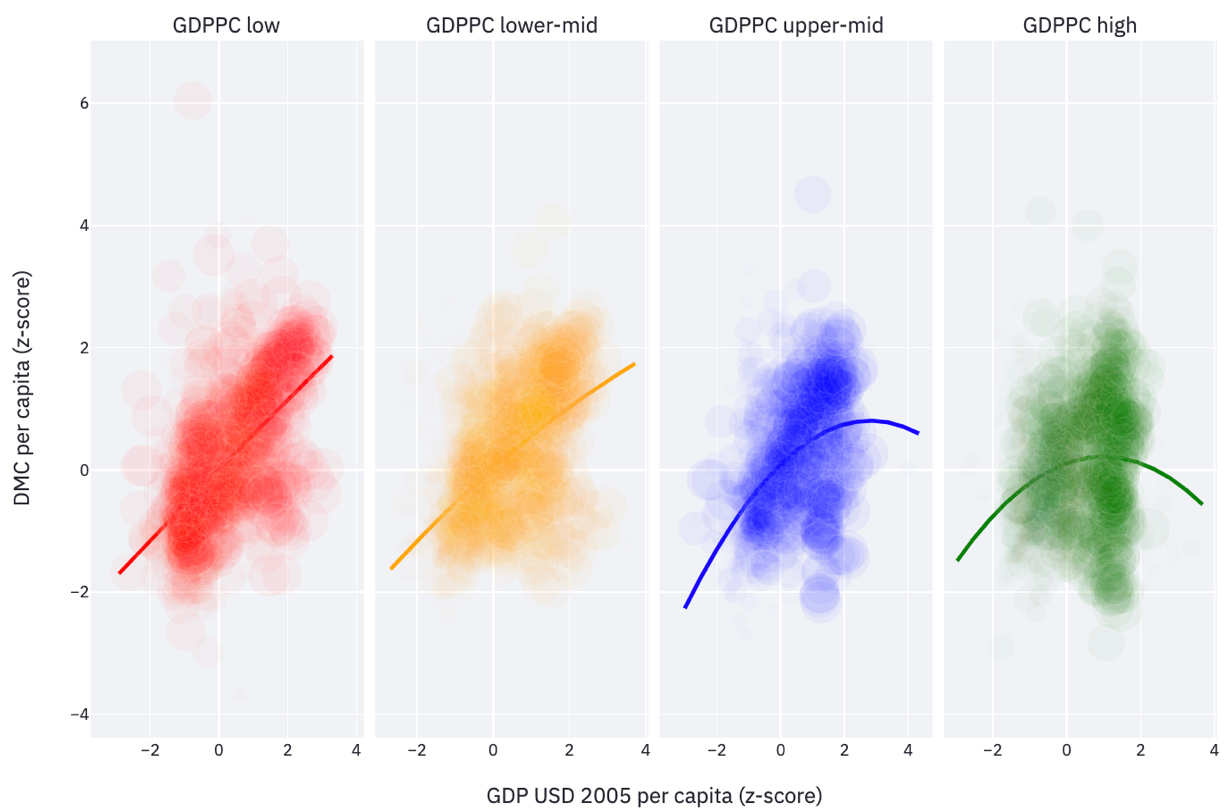
Figure 3. Relationship between material consumption and per capita income based on quadratic approximation. DMC: Domestic material consumption; GDPPC: gross domestic product per capita.
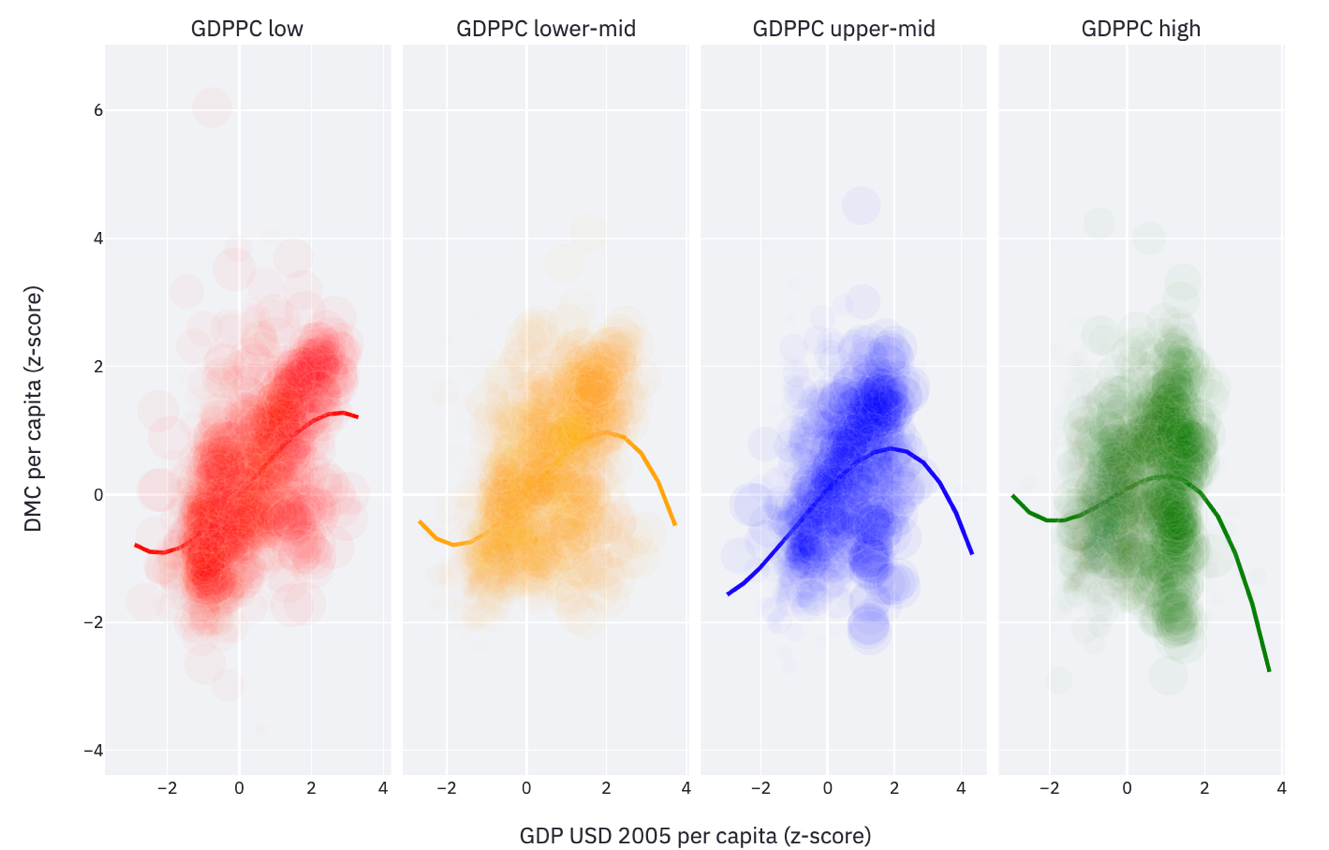
Figure 4. Relationship between material consumption and per capita income based on cubic approximation. DMC: Domestic material consumption; GDPPC: gross domestic product per capita.
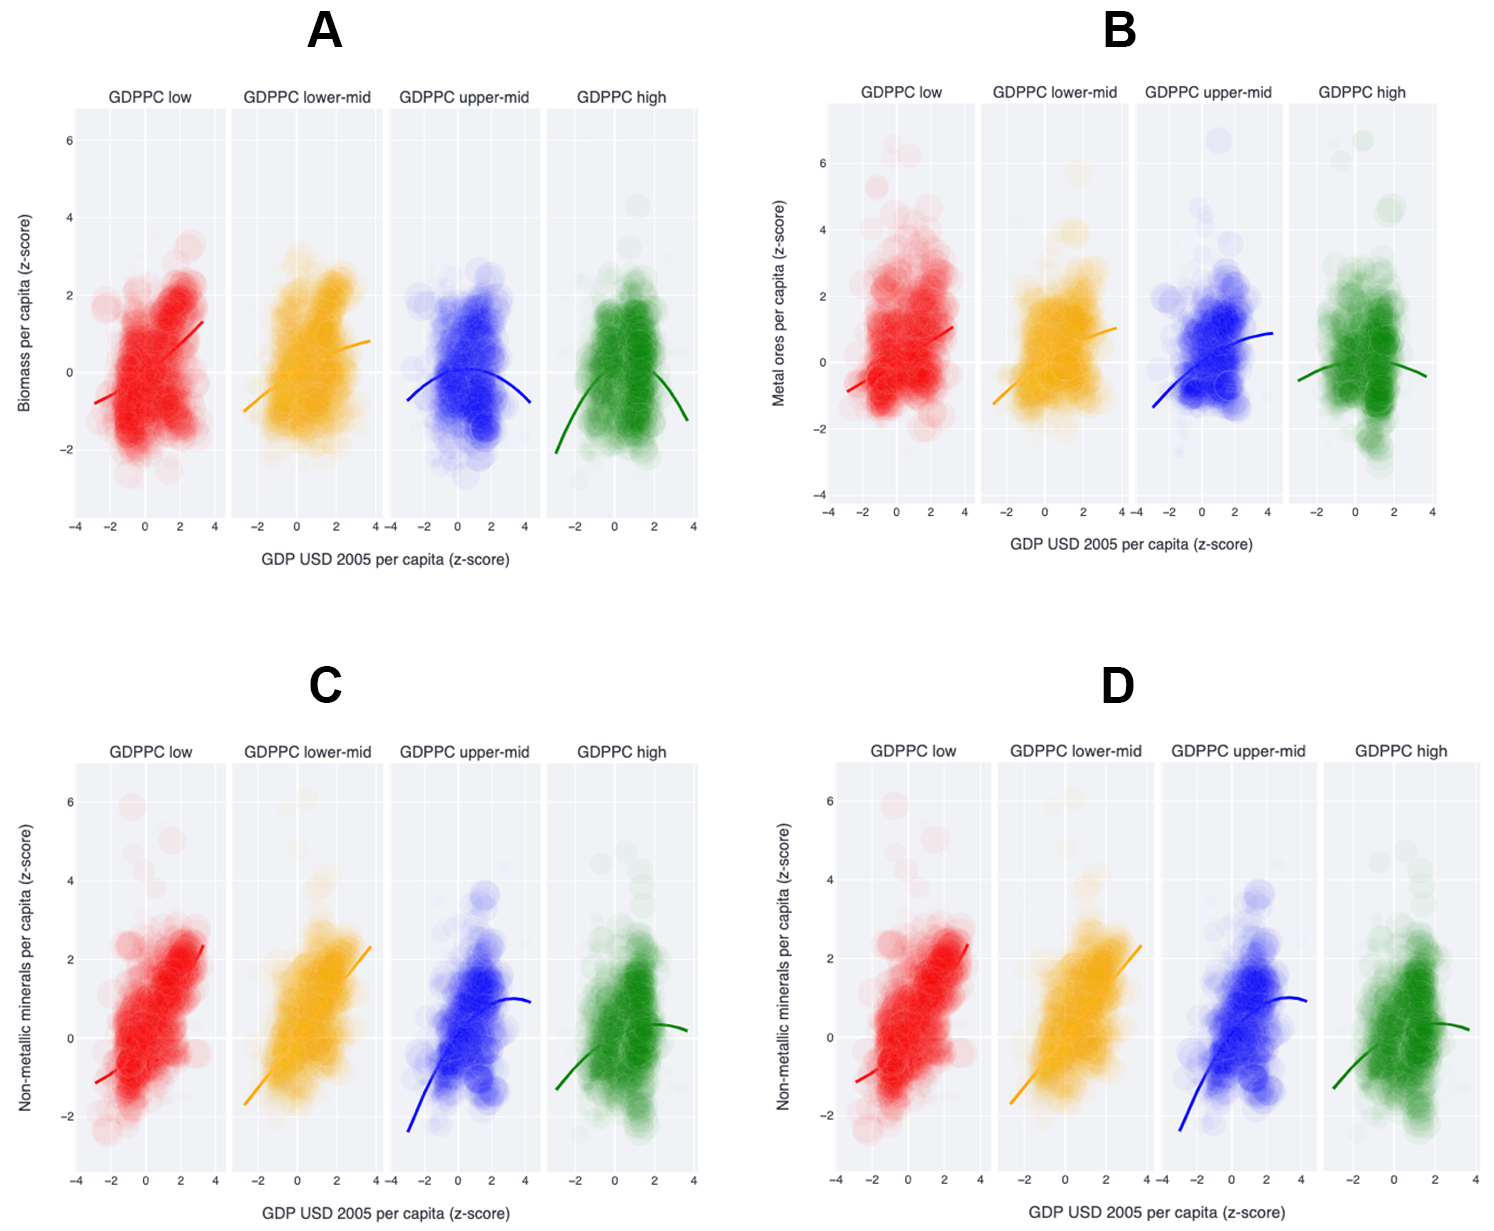
Figure 5. (A) Relationship between biomass and per capita income based on second-degree polynomial analysis; (B) Relationship between metal ores and per capita income based on second-degree polynomial analysis; (C) Relationship between non-metallic minerals and per capita income based on second-degree polynomial analysis; (D) Relationship between fossil fuels and per capita income based on second-degree polynomial analysis. DMC: Domestic material consumption; GDPPC: gross domestic product per capita.
RESULTS
The results are presented in three subsections. First, we examine aggregated material consumption across groups of countries to explore trends and the relationship between GDP and MC across income levels, highlighting key patterns. Second, we present material consumption by type of material and its relationship with GDP. Finally, we provide a more detailed analysis of specific materials and selected countries within different income groups to illustrate distinctive consumption trends.
Global trends and the relationship between GDP and MC across income groups
We analyze results for each income subgroup based on the graphical findings of the Z-scores of the
Figure 2 shows the GDP-MC relationship based on a linear specification. At first glance, the figure reveals a modest positive correlation between the two variables across all income groups. Interestingly, the positive relationship is much stronger in low-income, lower-middle-income, and upper-middle-income groups compared to the high-income group. This implies that as these lower-income and middle-income groups continue to develop economically, decoupling economic growth from material consumption - and reducing material consumption intensity (material used per unit of GDP) - will become increasingly crucial for achieving broader sustainability goals[40,41].
Figure 3 illustrates the GDP-MC relationship using a quadratic specification. For upper-middle- and
Figure 4 shows the GDP-MC relationship using a cubic specification. Here, the relationship more clearly exhibits an inverted U-shape. For high-, lower-middle-, and upper-middle-income groups, the results show a distinct inverted U-shaped pattern, with the declining portion of the curve being more pronounced for high-income countries. In contrast, the curve for low-income countries develops gradually and remains relatively flat, suggesting it is approaching the turning point. As in Figure 3, higher-income groups exhibit a stronger downward curvature. Overall, the findings suggest that once economic development surpasses a certain threshold, material consumption starts to decline. This provides evidence for the income-material EKC hypothesis, which is most clearly observed under the cubic specification.
Global trends and the relationship between GDP and different types of materials
Material consumption trends are analyzed across four categories: biomass, metal ores, non-metallic minerals, and fossil fuels. Figure 5 illustrates these categories. Curve fitting is restricted to a second-order polynomial, which provides an appropriate balance between capturing overall trends and avoiding overfitting. Distinct MKC patterns emerge across income groups for each material category. In low- and lower-middle-income groups, consumption in all four categories rises steadily with GDPPC, showing no signs of an inverted U-shaped MKC. Decoupling between material consumption and GDPPC begins to appear in upper-middle- and high-income groups for all categories. Biomass consumption increases sharply with GDPPC in low-income countries but stabilizes and then declines in
Country-specific analyses of the MC-GDP nexus
To further illustrate the diverse material consumption trends observed at different stages of economic development, we analyzed a selection of countries from each income group. In addition to overall DMC trends, we also highlight specific material categories, e.g., non-metallic minerals and natural gas, to demonstrate particular effects. The countries selected (Nigeria, Bhutan, Argentina, Brazil, Japan, and Australia) were chosen for their distinct patterns that exemplify the aggregate income-group findings, rather than as statistically representative averages of their respective groups.
Figure 6 presents the relationships between GDP per capita and DMC in Nigeria and Bhutan (low-income countries). No clear overall trend is evident; however, polynomial fitting reveals an upward trend in later years, as indicated by the larger markers (see https://disaggregated-raw-materials.herokuapp.com/ with the appropriate settings). In other words, a material Kuznets curve is not clearly observable in these countries, even though upward movements appear with high residual errors.
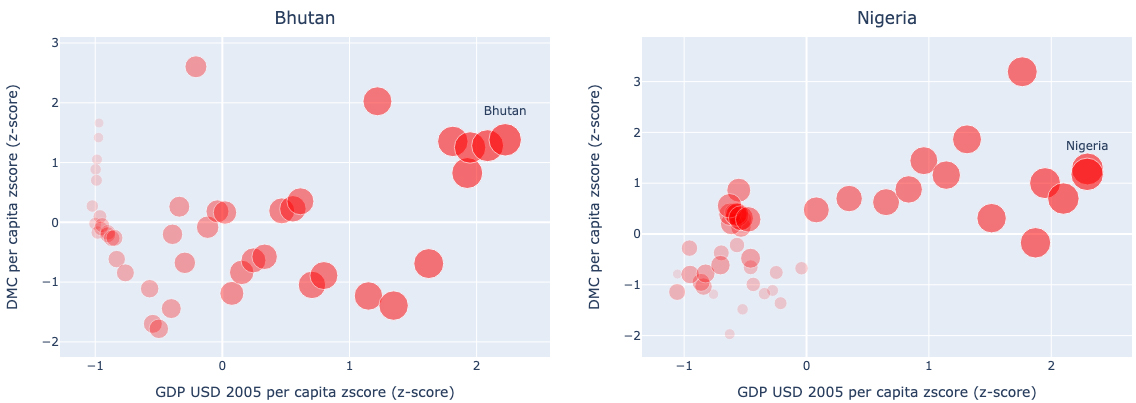
Figure 6. Relationship between GDP and DMC in Nigeria and Bhutan. GDP: Gross domestic product; DMC: domestic material consumption.
For upper-middle-income countries, Figure 7 shows a linear positive relationship between MC and
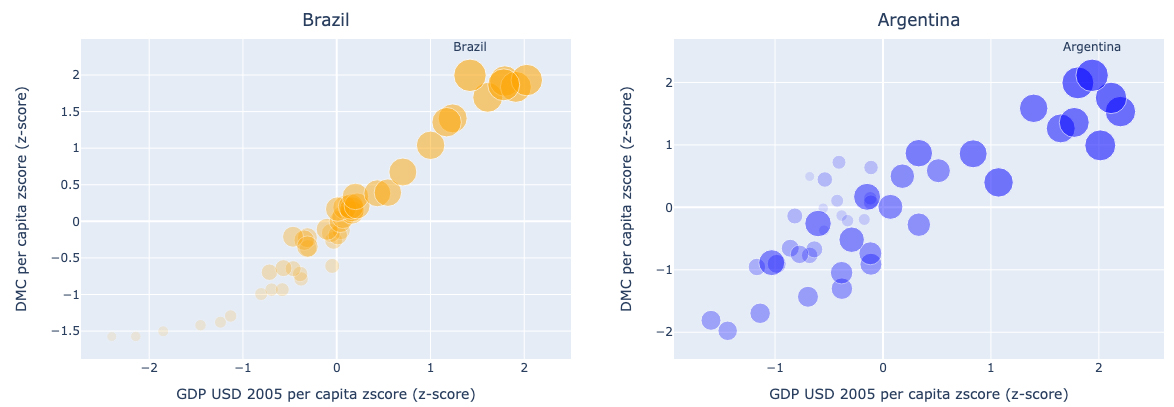
Figure 7. Relationship between GDP and DMC per capita in Brazil and Argentina. GDP: Gross domestic product; DMC: domestic material consumption.
It is therefore critical for these countries to reconsider their development strategies by improving efficiency in material use to reverse the current trend. As indicated in[10,45], enhancing resource efficiency across production systems could help address the problem of resource scarcity.
Figure 8 illustrates the relationship between DMC and GDP in the high-income subgroup. The figure indicates an inverted U-shaped relationship between per capita GDP and material consumption, with material consumption eventually falling despite rising income. This is consistent with relative dematerialization, where economic growth outpaces material consumption growth. Relative decoupling in this sense reflects efficiency gains in material demand.
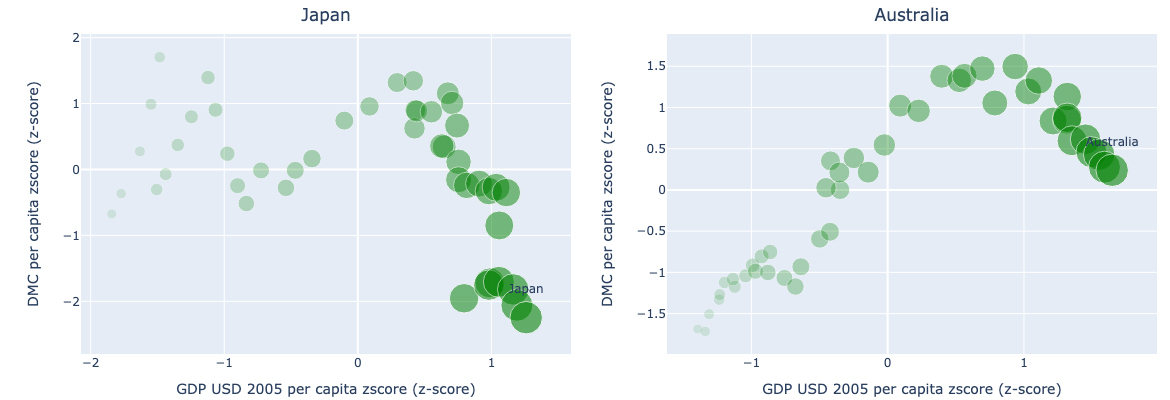
Figure 8. Relationship between GDP and DMC per capita in higher-income countries. GDP: Gross domestic product; DMC: domestic material consumption.
Nevertheless, because one resource can often substitute for another, aggregate material consumption may create the illusion of decoupling. For this reason, disaggregated analyses of specific materials are essential to better understand the mechanisms of dematerialization.
To explore the source of the reverse trend, we examined Japan and Australia [Figure 9], where non-metallic minerals consumption per capita declined significantly with rising income. This pattern aligns with
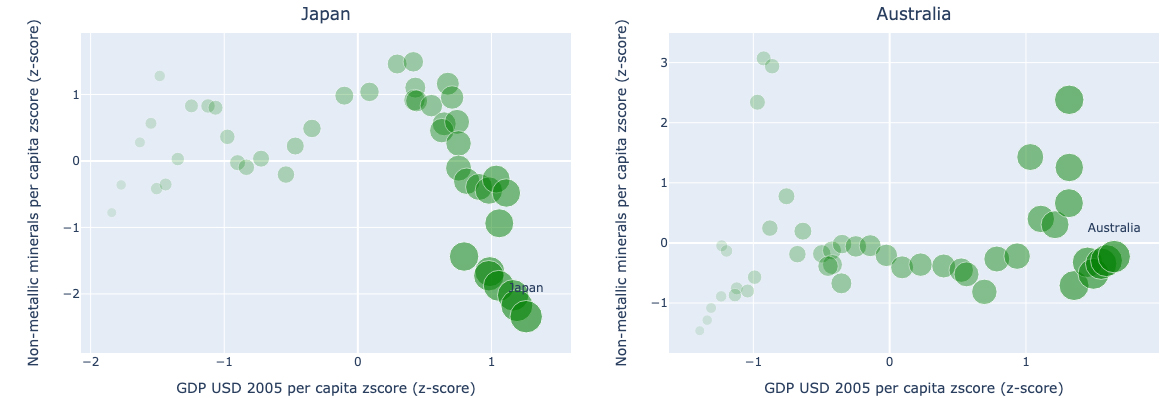
Figure 9. Relationship between GDP and non-metallic minerals per capita in Japan and Australia. GDP: Gross domestic product.
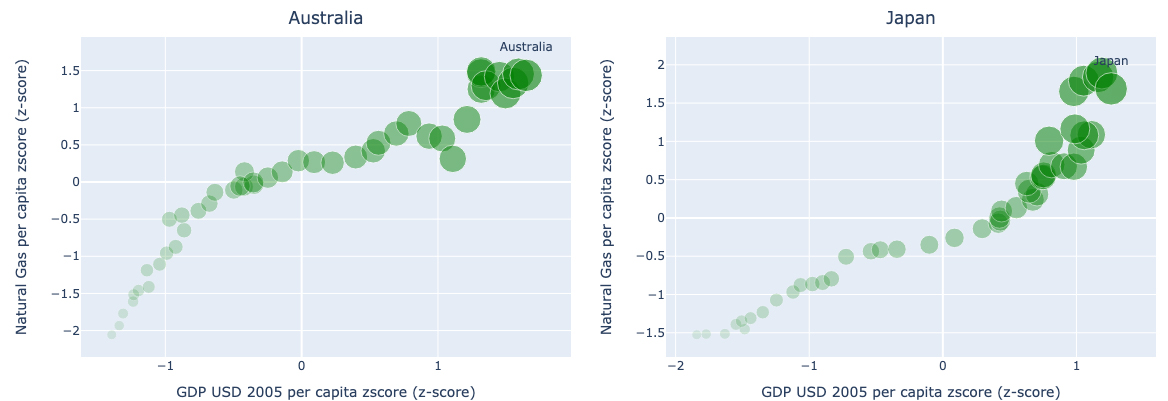
Figure 10. Relationship between GDP and Natural gas per capita in Australia and Japan. GDP: Gross domestic product.
DISCUSSION: EXPLAINING THE MKC
The current study provides empirical evidence to advance the discussion on the MKC. Countries are classified into four groups based on GNIPC: low-income, lower-middle-income, upper-middle-income, and high-income. These groups are assumed to be relatively homogeneous in terms of GDPPC, which reflects the total output of a country divided by its population. Based on our data, we highlight the following key points. First, at the empirical level and following Nagano et al.[35], this study employs a flexible estimation approach that captures different trends across subgroups using variables derived from longer cross-country datasets. We believe that dividing countries into income-based groups produces markedly different results and reveals important insights into the heterogeneity of the shapes and turning points of the MKC across income levels. Second, the identification of different patterns among countries with similar income levels provides strong evidence of the heterogeneity of material consumption within the same subgroup. The inverted U-shaped relationship between material consumption and economic growth is confirmed for upper-middle and high-income countries, consistent with previous findings[20,22,46]. Although countries vary in their resource endowments and policies, our results suggest that there are distinct material consumption trajectories as countries become wealthier. This implies that more sustainable pathways are possible without necessarily shifting the burden of pollution to lower-income countries. Technological improvements and stricter environmental regulations play an important role, as illustrated by the global shift away from fossil fuels in the twenty-first century. Our findings therefore support proposals for dematerialization and decoupling, as advocated by the United Nations International Resource Panel in its reports over the past decade[2,47].
The fields of ecological and resource economics offer several theories to explain the correlation between material consumption and economic growth[19]. Empirical studies have highlighted the influence of environmental regulation and country-specific socio-demographic factors - such as human capital, globalization, and urbanization - on raw material consumption[8,24,48-51]. However, there is still no comprehensive theoretical framework, supported by empirical evidence, that fully explains the link between MC and GDP. To advance theoretization on the different pathways of MC, our study identifies four main channels that can account for the inverted U-shaped relationship between economic growth and material use: the scale effect, the composition effect, the technique effect, and the policy effect. These channels, detailed below, provide a conceptual basis for interpreting the different trends observed in our results.
The scale effect
The scale effect refers to how material use responds to the scale of economic activity. In the early stages of economic development, demand for raw materials is relatively low due to the predominance of unmechanized agriculture (less material-intensive). As industrialization progresses, resource-intensive sectors (manufacturing, construction, and machinery) expand, increasing the global demand for materials[52]. Higher levels of economic activity result in greater production and consumption of goods and services, which, in the context of free trade, further drives material demand[53]. The scale effect suggests that higher per capita income increases the demand for material-intensive goods and services, thereby placing greater pressure on the environment[54]. This is clearly illustrated in the aggregated MC across the four country groups, where the trend curve rises under linear approximation [Figure 2].
The composition effect
The composition effect highlights that rising per capita income can either increase or decrease material requirements, depending on the structure of production (e.g., the capital-labor ratio). Because production structures and factor endowments vary widely across countries, material use patterns also differ, reflecting specialization in different economic sectors.
Countries with production structures that favor material-intensive activities tend to specialize in producing and exporting material-intensive goods[55]. In contrast, if the production structure discourages such activities, the composition effect reduces material use and may offset increases in overall demand. Consequently, the structure of production generates different levels of material requirements across countries, depending on their trade openness, environmental regulations, and restrictions on material use[20,56]. This finding aligns with results from the high-income country sub-sample, as shown in Figure 3 (second-degree polynomial) and Figure 4 (third-degree polynomial). Furthermore, analysis of different material categories [Figure 5] shows that the MKC slope shifts later for fossil fuel consumption than for biomass, suggesting that countries may shift their primary energy demand from biomass to fossil fuels as income rises.
The technique effect
The technique effect occurs when changes in production processes (often due to technological innovation) improve material efficiency, thereby reducing demand for raw materials. According to this effect, material intensity slows down and may eventually decline with the adoption of advanced production technologies[34]. Globalization can accelerate this transition in developing countries by facilitating the transfer of green technologies from developed economies[56,57]. In addition, as per capita income grows, demand for cars, factories, and machines gradually becomes saturated, and the economy shifts from manufacturing toward services. This structural transformation reduces consumer demand for raw materials and eventually reverses the upward trend in material intensity[54]. Figure 3 illustrates this pattern, showing that upper-middle and high-income groups follow a semi-Kuznets curve (rising and then falling, though less sharply than the classic Kuznets curve). Similarly, Figure 5 shows a downward trend in all four material categories at higher income levels.
The policy effect
The trajectory of MC as a country develops is shaped not only by its resource composition and technological shifts but also by policy choices. Countries can influence their MC through policies that promote efficiency and sustainable resource use, either via regulation or economic incentives. Examples include subsidies such as feed-in tariffs for renewable energy, widely adopted in Europe, or market-based mechanisms like carbon trading[58,59]. In our study, policy effects are evident among high-income countries. For instance, Germany has moved away from fossil fuels largely due to policy measures such as the Energiewende, in contrast to Finland [Figure 11]. Despite having similar GDP per capita, these two countries show divergent fossil fuel trajectories shaped by policy.
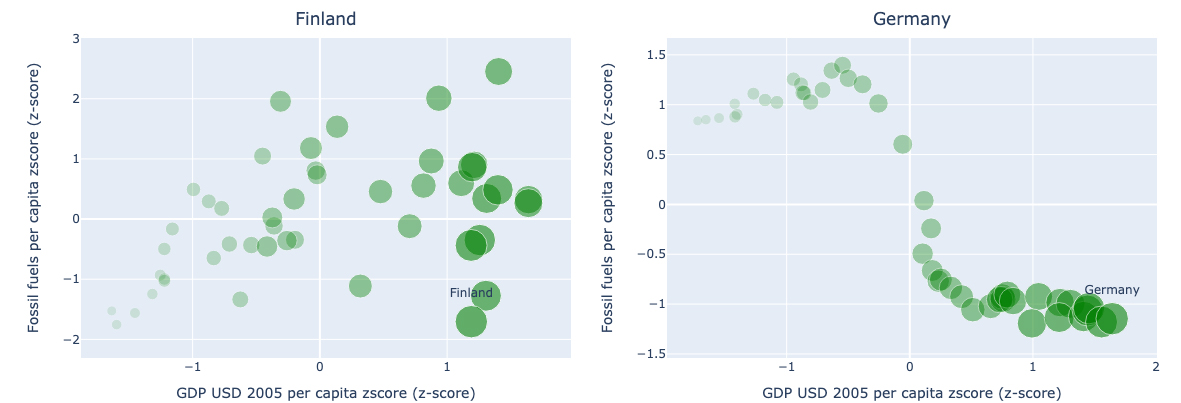
Figure 11. Relationship between Fossil fuels and GDP per capita in Germany and Finland. GDP: Gross domestic product.
The effectiveness of policy interventions, and the stage of development at which they are introduced, depend on a country’s policy environment and natural endowments. For example, Brazil, with its extensive sugarcane plantations, was the first country to implement large-scale biofuel policies in the transportation sector during the oil crises of the 1970s, earlier than most other countries[60]. This boosted biomass use [Figure 12]. More recently, studies have disaggregated policy effects at the subnational level, showing the importance of local investments in improving resource productivity, which could contribute to economic dematerialization[61].
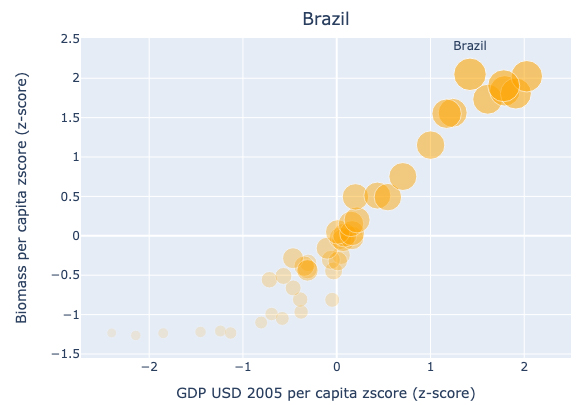
Figure 12. Relationship between biomass and GDP per capita in Brazil. GDP: Gross domestic product.
CONCLUSIONS
This study investigated dematerialization and decoupling in a panel of 176 countries over the period
For upper-middle and high-income groups, our results provide evidence of composition and technique effects, which can counteract the linear positive trend in material consumption as income rises. There is some evidence of decoupling between raw material consumption and economic growth. Notably, at the turning point, the negative correlation between GDP and MC is stronger in high-income countries than in upper-middle-income countries. Another key observation is that achieving sustainable
In conclusion, Pearson’s correlation provides a simple yet valuable tool for studying the long-term relationship between economic growth and material consumption. It enables not only the visual inspection of dematerialization patterns alongside monetary indicators but also the analysis of alternative functional relationships. This is critical for selecting an appropriate functional form to ensure that the data yield reliable insights into dematerialization dynamics.
The United Nations IRP, in its reports over the past two decades, has reached similar conclusions[2,47]. Our analysis further suggests that targeted interventions are needed in upper-middle-income countries to accelerate decoupling. Nonetheless, the study is limited by the availability of historical data. Moreover, emerging technologies - such as bioengineered materials and Artificial Intelligence (AI)-based tools for designing more resource-efficient products - require further assessment[63]. Despite these limitations, our findings offer valuable interpretations of the diverse dematerialization pathways taken by different countries and highlight potential strategies for transitioning toward more sustainable economies.
DECLARATIONS
Acknowledgments
The authors thank the institutional support of São Paulo School of Business Administration, Fundação Getúlio Vargas (EAESP/FGV).
Authors’ contributions
Conceptualization, data collection, analyses and revision: Nagano, H.
Analyses and revision: Ali, S. H.
Conceptualization, data collection, analyses and revision: de Oliveira, J. A. P.
Availability of data and materials
Data are available at https://disaggregated-raw-materials.herokuapp.com/.
Financial support and sponsorship
de Oliveira, J. A. P. acknowledges support from FAPESP (grant no. 2022/14558-2, CEPID) and the National Council for Scientific and Technological Development (CNPq, grant no. 303117/2022-2).
Conflicts of interest
de Oliveira, J. A. P. is an Editorial Board member of the journal Carbon Footprints. He was not involved in any steps of editorial processing, notably including reviewer selection, manuscript handling, or decision making. The other authors declared that there are no conflicts of interest.
Ethical approval and consent to participate
Not applicable.
Consent for publication
Not applicable.
Copyright
© The Author(s) 2025.
Supplementary Materials
REFERENCES
1. World Resources Forum. Making Natural Resource Governance Fit for the 21st Century. 2019. https://www.wrforum.org/resources/making-natural-resource-governance-fit-for-the-21st-century/ (accessed 2025-09-18).
2. UNEP: United Nations Environment Programme, International Resource Panel. Global resources outlook 2024: bend the trend - pathways to a liveable planet as resource use spikes. Nairobi; 2024. https://www.unep.org/resources/Global-Resource-Outlook-2024 (accessed 2025-09-18).
4. Ali, S. H.; Franks, D. M.; de Oliveira, J. A. P.; et al. A global minerals trust could prevent inefficient and inequitable protectionist policies. Science 2025, 388, 1028-30.
5. Erdoğan, S.; Çakar, N. D.; Ulucak, R.; et al. The role of natural resources abundance and dependence in achieving environmental sustainability: evidence from resource-based economies. Sustainable. Development. 2021, 29, 143-54.
6. Kovanda, J. Raw material consumption or total material consumption? Environ. Monit. Assess. 2020, 192, 362.
7. Ulucak, R.; Koçak, E.; Erdoğan, S.; Kassouri, Y. Investigating the non-linear effects of globalization on material consumption in the EU countries: evidence from PSTR estimation. Resources. Policy. 2020, 67, 101667.
8. Weinzettel, J.; Kovanda, J. Structural decomposition analysis of raw material consumption: the case of the Czech Republic. J. Ind. Ecol. 2011, 15, 893-907.
9. Milanez, B.; Ali, S. H.; de Oliveira, J. A. P. Mapping industrial disaster recovery: Lessons from mining dam failures in Brazil. Extr. Ind. Soc. 2021, 8, 100900.
10. Baninla, Y.; Lu, Y.; Zhang, Q.; et al. Material use and resource efficiency of African sub-regions. J. Clean. Prod. 2020, 247, 119092.
11. Steinberger, J. K.; Krausmann, F.; Eisenmenger, N. Global patterns of materials use: a socioeconomic and geophysical analysis. Ecol. Econ. 2010, 69, 1148-58.
12. Zhang, C.; Chen, W.; Liu, G.; Zhu, D. Economic growth and the evolution of material cycles: an analytical framework integrating material flow and stock indicators. Ecol. Econ. 2017, 140, 265-74.
13. United Nations (UN). Transforming our world: the 2030 Agenda for Sustainable Development (A/RES/70/1). 2015. https://sdgs.un.org/2030agenda (accessed 2025-09-18).
14. Kemp-benedict, E. Dematerialization, decoupling, and productivity change. Ecol. Econ. 2018, 150, 204-16.
15. Kuznets, S. Economic growth and income inequality. Am. Econ. Rev. 1955, 45, 1-28. https://assets.aeaweb.org/asset-server/files/9438.pdf (accessed 2025-09-25).
16. Grossman, G. M.; Krueger, A. B. Economic growth and the environment. Q. J. Econ. 1995, 110, 353-77.
17. Stern, D. I. The rise and fall of the environmental Kuznets curve. World. Dev. 2004, 32, 1419-39.
18. Focacci, A. Empirical relationship between total consumption-GDP ratio and per capita income for different metals of a series of industrialised nations. Int. J. Environ. Technol. Manag. 2005, 5, 347.
19. Malenbaum, W. World demand for raw materials in 1985 and 2000. New York: McGraw-Hill; 1978. https://archive.org/details/worlddemandforra0000male (accessed 2025-09-18).
20. Grabarczyk, P.; Wagner, M.; Frondel, M.; Sommer, S. A cointegrating polynomial regression analysis of the material kuznets curve hypothesis. Resources. Policy. 2018, 57, 236-45.
21. Jaunky, V. C. Does a material Kuznets Curve exist for copper? Econ. Papers. A. J. Appl. Econ. Policy. 2014, 33, 374-90.
22. Jaunky, V. C. Is there a material Kuznets curve for aluminium? Resources. Policy. 2012, 37, 296-307.
23. Wårell, L. Trends and developments in long-term steel demand-the intensity-of-use hypothesis revisited. Resour. Policy. 2014, 39, 134-43.
24. Kassouri, Y.; Alola, A. A.; Savaş, S. The dynamics of material consumption in phases of the economic cycle for selected emerging countries. Resources. Policy. 2021, 70, 101918.
25. Shao, Q.; Schaffartzik, A.; Mayer, A.; Krausmann, F. The high ‘price’ of dematerialization: A dynamic panel data analysis of material use and economic recession. J. Clean. Prod. 2017, 167, 120-32.
26. Mukherjee, P. K.; Das, B.; Bhardwaj, P. K.; et al. Socio-economic sustainability with circular economy - an alternative approach. Sci. Total. Environ. 2023, 904, 166630.
27. Abdirahman, A. A.; Asif, M.; Mohsen, O. Circular economy in the renewable energy sector: a review of growth trends, gaps and future directions. Energy. Nexus. 2025, 17, 100395.
28. Xie, H.; Ahmad, T.; Zhang, D.; Goh, H. H.; Wu, T. Community-based virtual power plants’ technology and circular economy models in the energy sector: a techno-economy study. Renew. Sustain. Energy. Rev. 2024, 192, 114189.
29. Tiwari, S.; Si, Mohammed. K. Unraveling the impacts of linear economy, circular economy, green energy and green patents on environmental sustainability: empirical evidence from OECD countries. Gondwana. Res. 2024, 135, 75-88.
30. Hettige, H.; Mani, M.; Wheeler, D. Industrial pollution in economic development: the environmental Kuznets curve revisited. J. Dev. Econ. 2000, 62, 445-76.
31. Bilgili, F.; Nathaniel, S. P.; Kuşkaya, S.; Kassouri, Y. Environmental pollution and energy research and development: an environmental Kuznets Curve model through quantile simulation approach. Environ. Sci. Pollut. Res. Int. 2021, 28, 53712-27.
32. Erdogan, S. Dynamic nexus between technological innovation and building sector carbon emissions in the BRICS countries. J. Environ. Manage. 2021, 293, 112780.
33. Dong, Q.; Zhong, C.; Geng, Y.; Dong, F.; Chen, W.; Zhang, Y. A bibliometric review of carbon footprint research. Carbon. Footprints. 2024, 3, 3.
34. Pothen, F.; Welsch, H. Economic development and material use. Evidence from international panel data. World. Development. 2019, 115, 107-19.
35. Nagano, H.; de Oliveira, J. A. P.; Barros, A. K.; Costa Junior, A. D. S. The 'Heart Kuznets Curve'? World. Dev. 2020, 132, 104953.
36. International Resource Panel (IRP). Global Material Flows Database. https://www.resourcepanel.org/global-material-flows-database (accessed 2025-09-25).
37. World Bank. Africa Development Indicators (GDP, constant 2000 USD).https://databank.worldbank.org/source/africa-development-indicators/Series/NY.GDP.MKTP.KD (accessed 2025-09-29).
38. Taylor, A. M.; Taylor, M. P. The purchasing power parity debate. J. Econ. Perspect. 2004, 18, 135-58.
39. World Bank. https://datahelpdesk.worldbank.org/knowledgebase/articles/906519-world-bank-country-and-lending-groups (accessed 2025-09-25).
40. Bithas, K.; Kalimeris, P. Unmasking decoupling: redefining the resource intensity of the economy. Sci. Total. Environ. 2018, 619-620, 338-51.
41. Shuai, C.; Chen, X.; Wu, Y.; Zhang, Y.; Tan, Y. A three-step strategy for decoupling economic growth from carbon emission: Empirical evidences from 133 countries. Sci. Total. Environ. 2019, 646, 524-43.
42. Altıntaş, H.; Kassouri, Y. Is the environmental Kuznets Curve in Europe related to the per-capita ecological footprint or CO2 emissions? Ecol. Indic. 2020, 113, 106187.
43. Jobert, T.; Karanfil, F.; Tykhonenko, A. Estimating country-specific environmental Kuznets curves from panel data: a Bayesian shrinkage approach. Appl. Econ. 2014, 46, 1449-64.
44. Pata, U. K. Renewable energy consumption, urbanization, financial development, income and CO2 emissions in Turkey: testing EKC hypothesis with structural breaks. J. Clean. Prod. 2018, 187, 770-9.
45. Baninla, Y.; Zhang, M.; Lu, Y.; et al. A transitional perspective of global and regional mineral material flows. Resour. Conserv. Recycl. 2019, 140, 91-101.
46. Ansari M, Haider S, Khan N. Environmental Kuznets curve revisited: an analysis using ecological and material footprint. Ecol. Indic. 2020, 115, 106416.
47. UN environment programme. Decoupling 2: technologies, opportunities and policy options. https://www.unep.org/resources/report/decoupling-2-technologies-opportunities-and-policy-options (accessed 2025-09-25).
48. Alola, A. A.; Akadiri, S. S.; Usman, O. Domestic material consumption and greenhouse gas emissions in the EU -28 countries: Implications for environmental sustainability targets. Sustain. Dev. 2021, 29, 388-97.
49. Razzaq, A.; Ajaz, T.; Li, J. C.; Irfan, M.; Suksatan, W. Investigating the asymmetric linkages between infrastructure development, green innovation, and consumption-based material footprint: Novel empirical estimations from highly resource-consuming economies. Resour. Policy. 2021, 74, 102302.
50. Wang, H.; Hashimoto, S.; Moriguchi, Y.; Yue, Q.; Lu, Z. Resource Use in Growing China: Past Trends, Influence Factors, and Future Demand. J. Ind. Ecol. 2012, 16, 481-92.
51. Wang, H.; Zhao, X.; Zhang, Z.; Li, S.; Yuan, J. Material flows embodied in China-Japan Trade. In Application of Intelligent Systems in Multi-modal Information Analytics, 4th ed.; Advances in Intelligent Systems and Computing, Vol. 929; Cham: Springer International Publishing; 2019. pp. 338-44.
52. Wu, R.; Geng, Y.; Liu, W. Trends of natural resource footprints in the BRIC (Brazil, Russia, India and China) countries. J. Clean. Prod. 2017, 142, 775-82.
53. Antweiler, W.; Copeland, B. R.; Taylor, M. S. Is free trade good for the environment? Am. Econ. Rev. 2001, 91, 877-908.
56. Bruckner, M.; Giljum, S.; Lutz, C.; Wiebe, K. S. Materials embodied in international trade - global material extraction and consumption between 1995 and 2005. Glob. Environ. Change. 2012, 22, 568-76.
57. Jayadevappa, R.; Chhatre, S. International trade and environmental quality: a survey. Ecol. Econ. 2000, 32, 175-94.
58. Johnstone, P.; Rogge, K. S.; Kivimaa, P.; Fratini, C. F.; Primmer, E.; Stirling, A. Waves of disruption in clean energy transitions: Sociotechnical dimensions of system disruption in Germany and the United Kingdom. Energy. Res. Soc. Sci. 2020, 59, 101287.
59. Polzin, F.; Egli, F.; Steffen, B.; Schmidt, T. S. How do policies mobilize private finance for renewable energy? Appl. Energy. 2019, 236, 1249-68.
60. de Oliveira J. The policymaking process for creating competitive assets for the use of biomass energy: the Brazilian alcohol programme. Renew. Sustain. Energy. Rev. 2002, 6, 129-40.
61. Mango, F.; Vincent, R. C. Does polycentric climate governance drive the circular economy? Ecol. Econ. 2025, 231, 108533.
62. Torras, M. Global structural change and its de-materialization implications. Int. J. Soc. Econ. 2003, 30, 700-19.
Cite This Article
How to Cite
Download Citation
Export Citation File:
Type of Import
Tips on Downloading Citation
Citation Manager File Format
Type of Import
Direct Import: When the Direct Import option is selected (the default state), a dialogue box will give you the option to Save or Open the downloaded citation data. Choosing Open will either launch your citation manager or give you a choice of applications with which to use the metadata. The Save option saves the file locally for later use.
Indirect Import: When the Indirect Import option is selected, the metadata is displayed and may be copied and pasted as needed.
About This Article
Copyright

Data & Comments
Data
0


Comments
Comments must be written in English. Spam, offensive content, impersonation, and private information will not be permitted. If any comment is reported and identified as inappropriate content by OAE staff, the comment will be removed without notice. If you have any queries or need any help, please contact us at [email protected].