

Evolution of urban green space carbon sinks and their value in the arid region of Northwest China
 0
0 Abstract
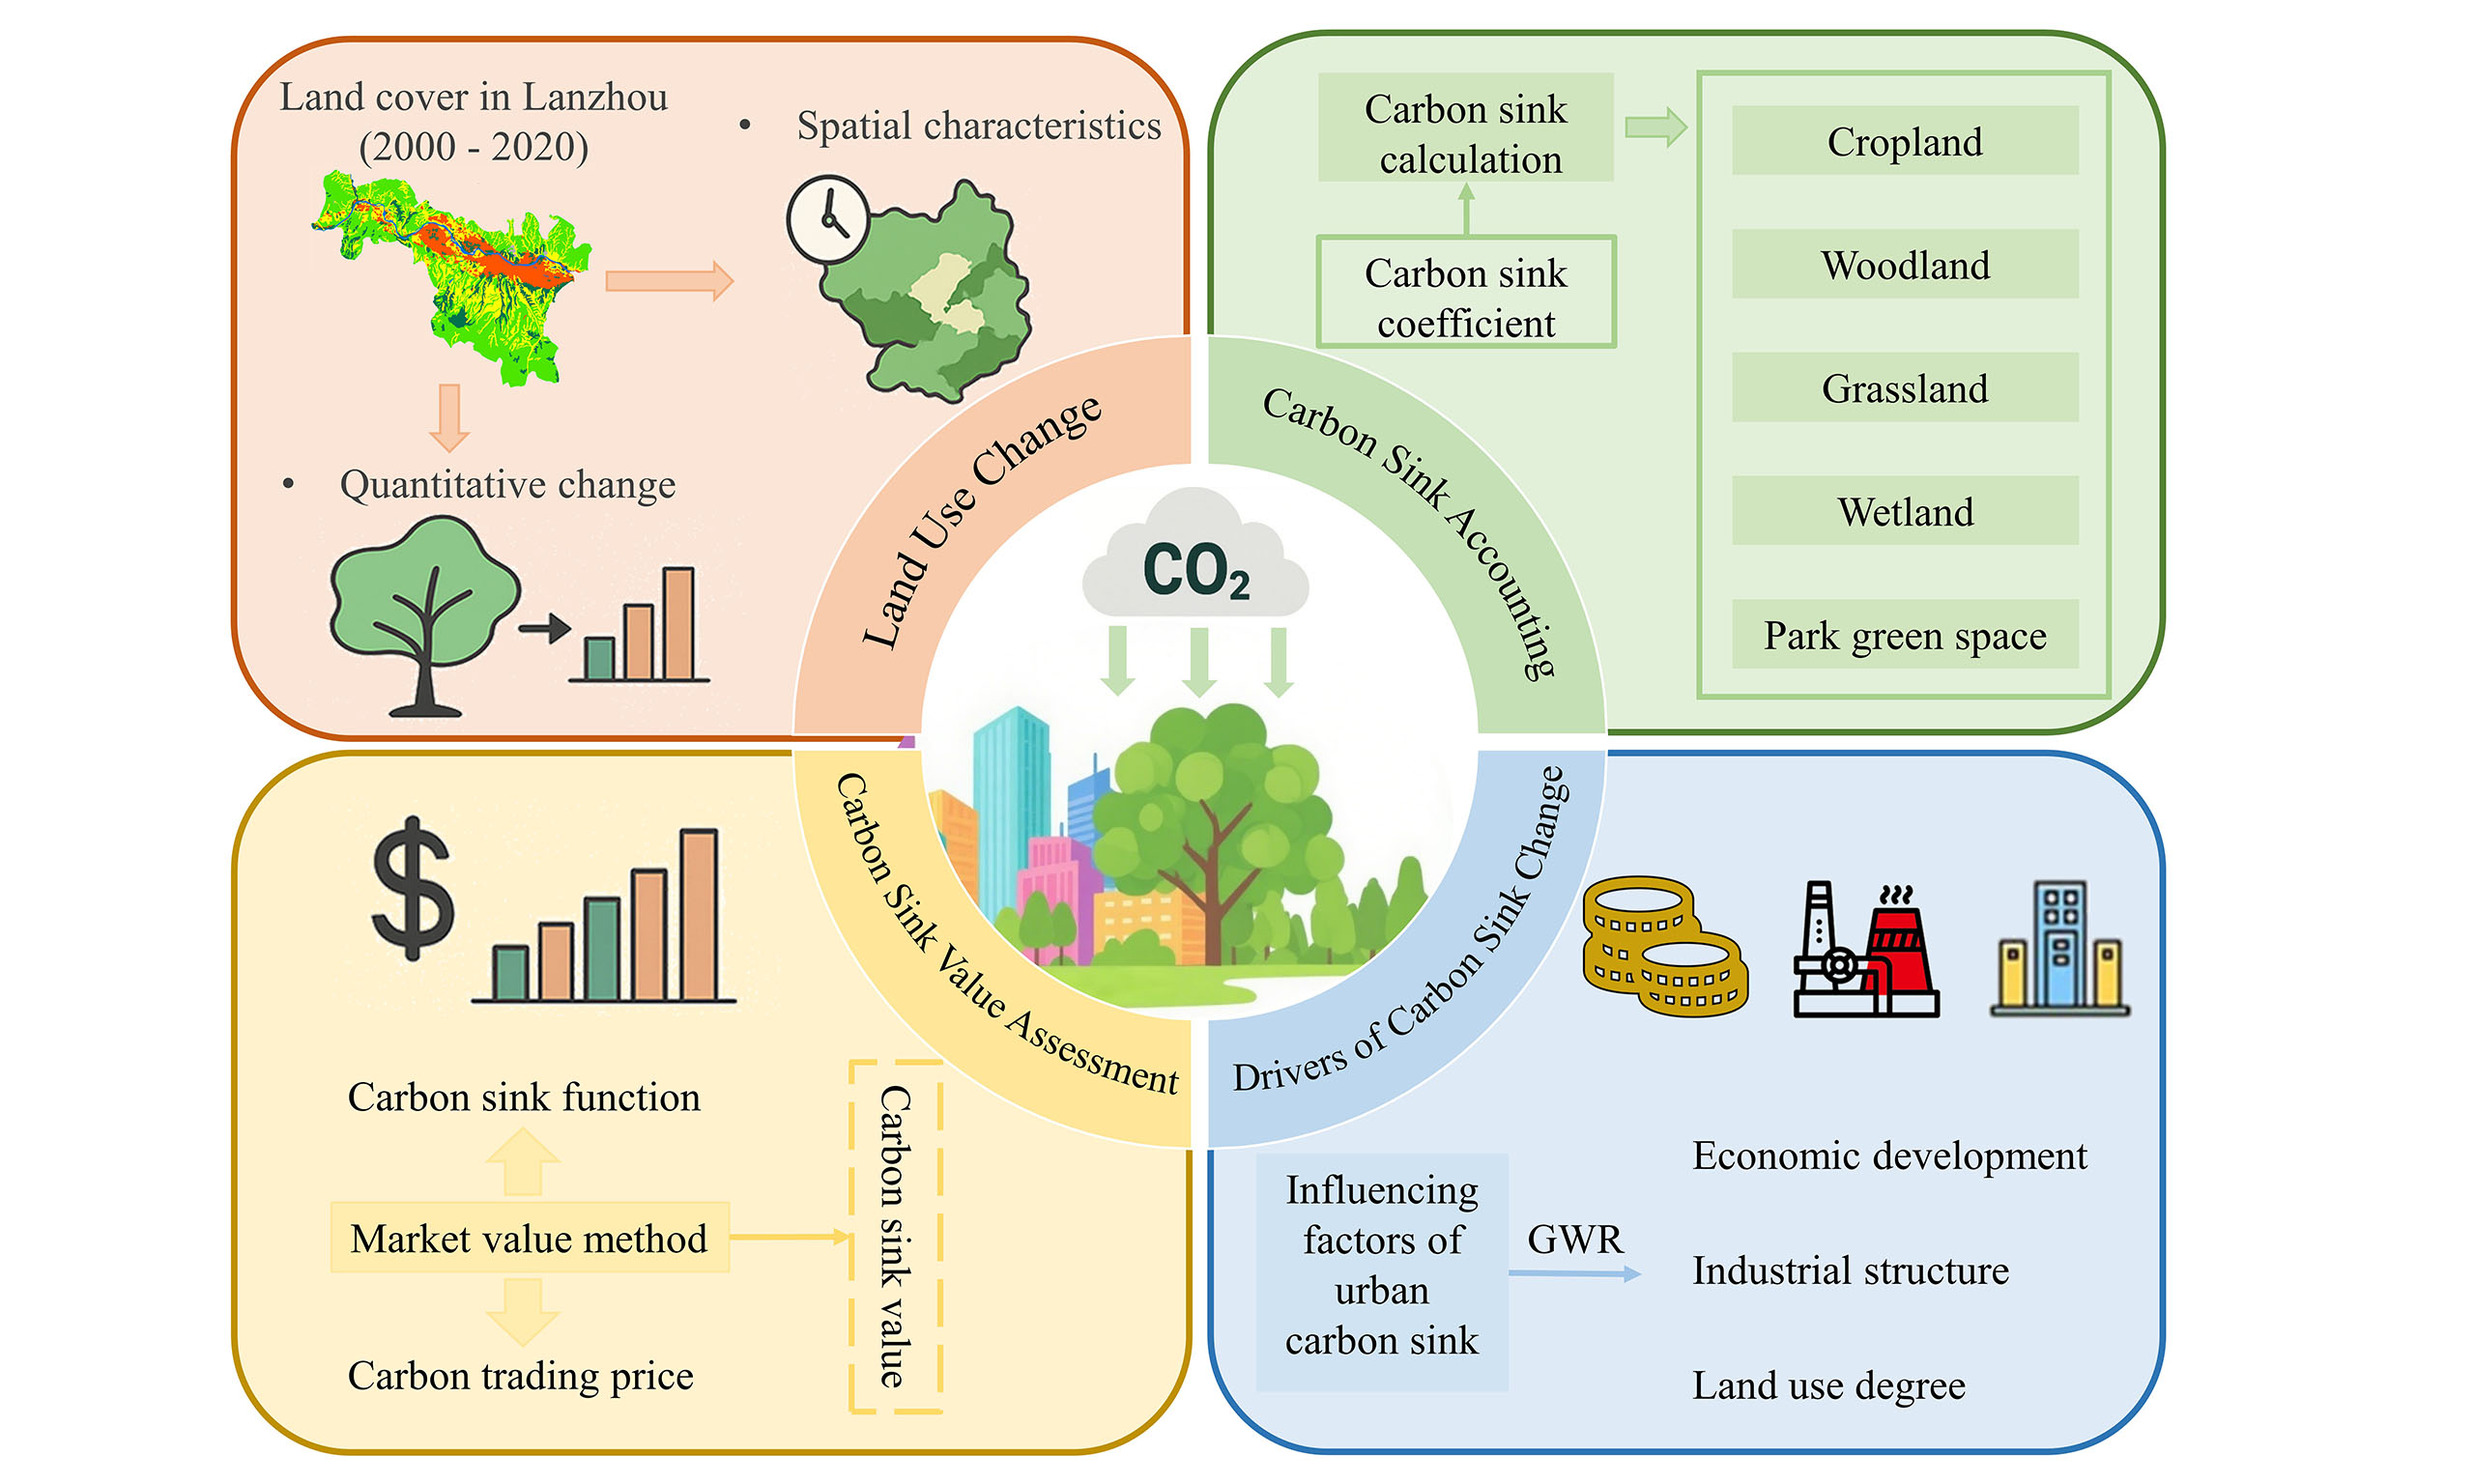
The arid zone of northwestern China is a critical ecological functional area, where terrestrial ecosystems are extremely fragile and difficult to restore once degraded, with significant implications for the regional carbon balance. Urban green spaces play an essential role in carbon sequestration and air purification, making them important carbon sink carriers in arid environments. Taking Lanzhou City as a case study, this research analyzes the carbon sink capacity of cropland, woodland, grassland, wetland, park green space, and other urban green land types from 2000 to 2020, and explores the main factors influencing their evolution. The findings indicate that: (1) Lanzhou's green space was primarily composed of cropland and grassland. However, due to urbanization and the city’s unique valley-type topography, construction land expanded while cropland and grassland areas declined; (2) The total carbon sink decreased from 361,000 tons in 2000 to 354,100 tons in 2020. Nevertheless, the economic value of carbon sinks continued to increase due to the annual rise in carbon prices. Cropland remained the largest contributor to urban green space carbon sinks; and (3) In 2020, land use intensity had a negative effect on carbon sinks, with an impact significantly greater than that of industrial structure or economic development. This study provides a scientific basis for improving urban green space management and enhancing carbon sink capacity in arid urban regions, thereby supporting regional ecological security and sustainable development.
Keywords
INTRODUCTION
Climate change poses significant threats to human survival, health, and well-being. Global greenhouse gas emissions are driving unprecedented climatic shifts worldwide[1,2]. Rapid urban population growth due to urbanization has led to substantial changes in land use and land cover, which in turn affect carbon storage capacity[3]. Meanwhile, energy consumption and carbon emissions continue to rise[4], a problem that may be even more acute in ecologically fragile regions. In response, China has adopted carbon peaking and carbon neutrality as national strategic goals. Enhancing the carbon sink function of cities has emerged as a more practical and cost-effective approach to reducing carbon emissions compared to relying solely on energy-saving technologies[5]. Northwest China, a key region in the Belt and Road Initiative, has experienced a notable increase in atmospheric carbon dioxide concentrations, driven by the expansion of urban construction land and the conversion of grasslands and woodlands into croplands. These land use changes, largely the result of human activity, hinder efforts to mitigate global warming. Urban green spaces offer valuable ecosystem services[6] and are particularly important in arid regions. However, a significant knowledge gap remains regarding how these green spaces contribute to carbon sinks in arid areas such as Northwest China. Given the ecological fragility of these regions and increasing pressure from urbanization, it is essential to investigate the relationship between urban green spaces and their carbon sink functions to support the development of low-carbon, sustainable cities.
Studies on carbon sinks at different geographic scales are urgently needed, as such sinks are essential for balancing emissions and preserving ecological stability across diverse environments. At the global scale, Yang et al. used biomass data to assess global carbon sinks and found that carbon stocks have increased annually, primarily due to contributions from boreal and temperate forests[7]. Chen et al. reported that the rise in the Leaf Area Index (LAI) contributed 12.4% of the terrestrial carbon sink between 1981and 2016, highlighting LAI as a key parameter in global carbon cycle assessments[8]. Hubau et al. found that while African tropical forests maintained stable carbon sink capacity, the Amazon showed a decline, mainly due to increased tree mortality[9]. Gruber et al. used linear regression and found that global oceanic carbon sinks grew by 34 Pg C between 1994 and 2007[10]. At the continental scale, Li et al. used Net Ecosystem Production (NEP) to assess carbon sinks in Central Asia, identifying Northern Kazakhstan, Kyrgyzstan, and Tajikistan as key sink areas[11]. Winkler et al. reported that aboveground biomass carbon sinks in Eastern Europe accounted for 78% of the continent’s total[12]. Raw et al. showed that in South Africa’s blue carbon ecosystems, salt marshes had the largest total carbon stocks due to their area, while mangroves had the highest carbon density per unit area[13]. Duque et al. estimated biomass using anisotropic equations and concluded that Andean forests in South America exhibit strong aboveground carbon sink capacity[14]. They emphasized that reducing deforestation could significantly enhance aboveground carbon stocks. At the national or regional scales, carbon sink characteristics vary due to differences in geographic, economic, and ecological conditions. Chen et al. used gross and net primary production to estimate vegetation carbon sinks in China[15]. Zhang et al. assessed China's carbon storage potential using net ecosystem productivity and a maximum entropy model[16]. Steenberg et al. emphasized that improving urban forest carbon sinks can support Canada's low-carbon development goals[17]. Qin et al. used the FLUS-InVEST model and predicted that under an urbanization-priority scenario, carbon sinks in China's Beibu Gulf Urban Agglomeration would decline[18]. At the city level, Pan et al. estimated the carbon sink of Sanmenxia City using the carbon density method and employed the FLUS model to predict future impacts of land use changes[19]. Gong et al. identified forest shrinkage and construction land expansion as key contributors to carbon stock loss[20]. Wang et al. reported that rapid land transformation is reducing Hefei City's carbon stocks[21]. Luo et al. assessed Wuhan’s carbon sink using the carbon sink coefficient method and analyzed influencing factors via a geographically weighted regression (GWR) model[22]. Xiang et al. studied Chongqing’s main urban area and found that converting agricultural land into construction land has caused a substantial decline in carbon stocks[23].
When discussing carbon neutrality, it is essential to consider not only carbon sink capacity but also the economic value of those sinks. Bherwani et al. used NDVI to assess carbon sequestration in five Indian cities and found that cities with limited urban tree cover tended to have lower sequestration capacity. Among valuation methods, the market price approach yielded the lowest economic value, while the social cost of carbon method produced the highest[24]. Shi et al. used the state, adjoint, and coupling equations of forest carbon sinks and found that the value of China's forest carbon sinks in 2020 was roughly comparable to the global average. While many studies have focused on natural factors influencing carbon sinks, social and economic factors also play crucial roles[25]. Using the pressure-state-response (PSR) model, Wei and Shen found that higher temperatures negatively impact forest carbon sink efficiency[26]. Song et al. used a GWR model and concluded that labor force size and agricultural inputs significantly influence farmland carbon sinks[27]. Using machine learning methods, Li et al. identified vegetation cover as the most critical factor affecting carbon sink efficiency[28]. In Shaanxi Province, Wei et al. used partial correlation analysis and found that precipitation had a strong influence on net primary productivity (NPP)[29].
Urban green spaces - ecosystems dominated by artificial vegetation within built-up urban areas[30] - play a vital role in mitigating the urban heat island effect[31]. These spaces also provide essential ecosystem services such as improving air quality and reducing urban temperatures[32]. The concept of urban green space evolved from the term “urban open space,” proposed by the UK’s National Health Society in 1877[33]. Over time, the definition has broadened to include a wider range of green infrastructure, such as urban forests, vertical greening, urban farmland, and aquatic wetlands[34]. Despite their importance, relatively few studies have focused on the carbon sink functions of urban green spaces. Chen et al. estimated the carbon stock of affiliated green space (AGS) in central Shanghai using remote sensing and field survey data, finding that AGS accounted for more than half of the total urban carbon stock[35]. Wang et al. applied the CASA and InVEST models to analyze carbon stock trends in Shenzhen and observed a notable decline between 2008 and 2022[36]. Zhao et al. examined carbon storage across 25 urban parks in Jinan city using multivariate heterogeneous data and concluded that enclosed broadleaf, multilayered green spaces hold significant carbon sink potential[37].
To summarize, although many studies have explored carbon sinks across different spatial scales and land types, research focused specifically on urban green spaces in arid regions remains limited. Such regions, like Northwest China, are ecologically fragile and subject to intense urbanization, presenting unique challenges for maintaining carbon sink functions. Unlike temperate or humid zones, arid regions face constraints in biomass accumulation, vegetation resilience, and land-use efficiency. In these contexts, urban green spaces serve multifunctional roles beyond aesthetics and recreation - they are critical for microclimate regulation and carbon sequestration. However, existing studies often neglect the localized spatiotemporal heterogeneity and economic valuation of urban carbon sinks in these areas. In this study, we select Lanzhou as the case study area to analyze the evolution of urban carbon sink functions. We apply dynamic analysis and geographically weighted regression models, calculate the economic value of carbon sinks using a compound present value formula, and identify key influencing factors from both natural and socioeconomic dimensions. The goal is to provide targeted recommendations for enhancing carbon sink capacity through improved green space management in arid urban environments, thereby supporting China’s carbon neutrality goals and contributing to global climate governance.
MATERIALS AND METHODS
Study area
Lanzhou, the capital of Gansu Province in northwest China (35°34′-37°00 N, 102°36′-104°35′ E) [Figure 1], covers an area of approximately 13,100 km2. Located deep inland and far from the sea, Lanzhou experiences a temperate semi-arid continental monsoon climate, characterized by four distinct seasons, low and unevenly distributed precipitation, and a pronounced diurnal temperature range. The city's unique topography- with two mountain ranges flanking the Yellow River - frequently results in the formation of a temperature inversion layer, which impedes the dispersion of greenhouse gases and complicates efforts to reduce carbon emissions. This study focuses on Lanzhou's main urban area, which includes four district-level administrative divisions: Chengguan, Xigu, Anning, and Qilihe. By the end of 2020, the region’s GDP had reached approximately CNY 218.55 billion, about 8.7 times higher than in 2000. The industrial structure consisted of 0.46% primary, 28.2% secondary, and 71.34% tertiary industries. The resident population was approximately 3.05 million, with Chengguan District accounting for nearly half of the total.
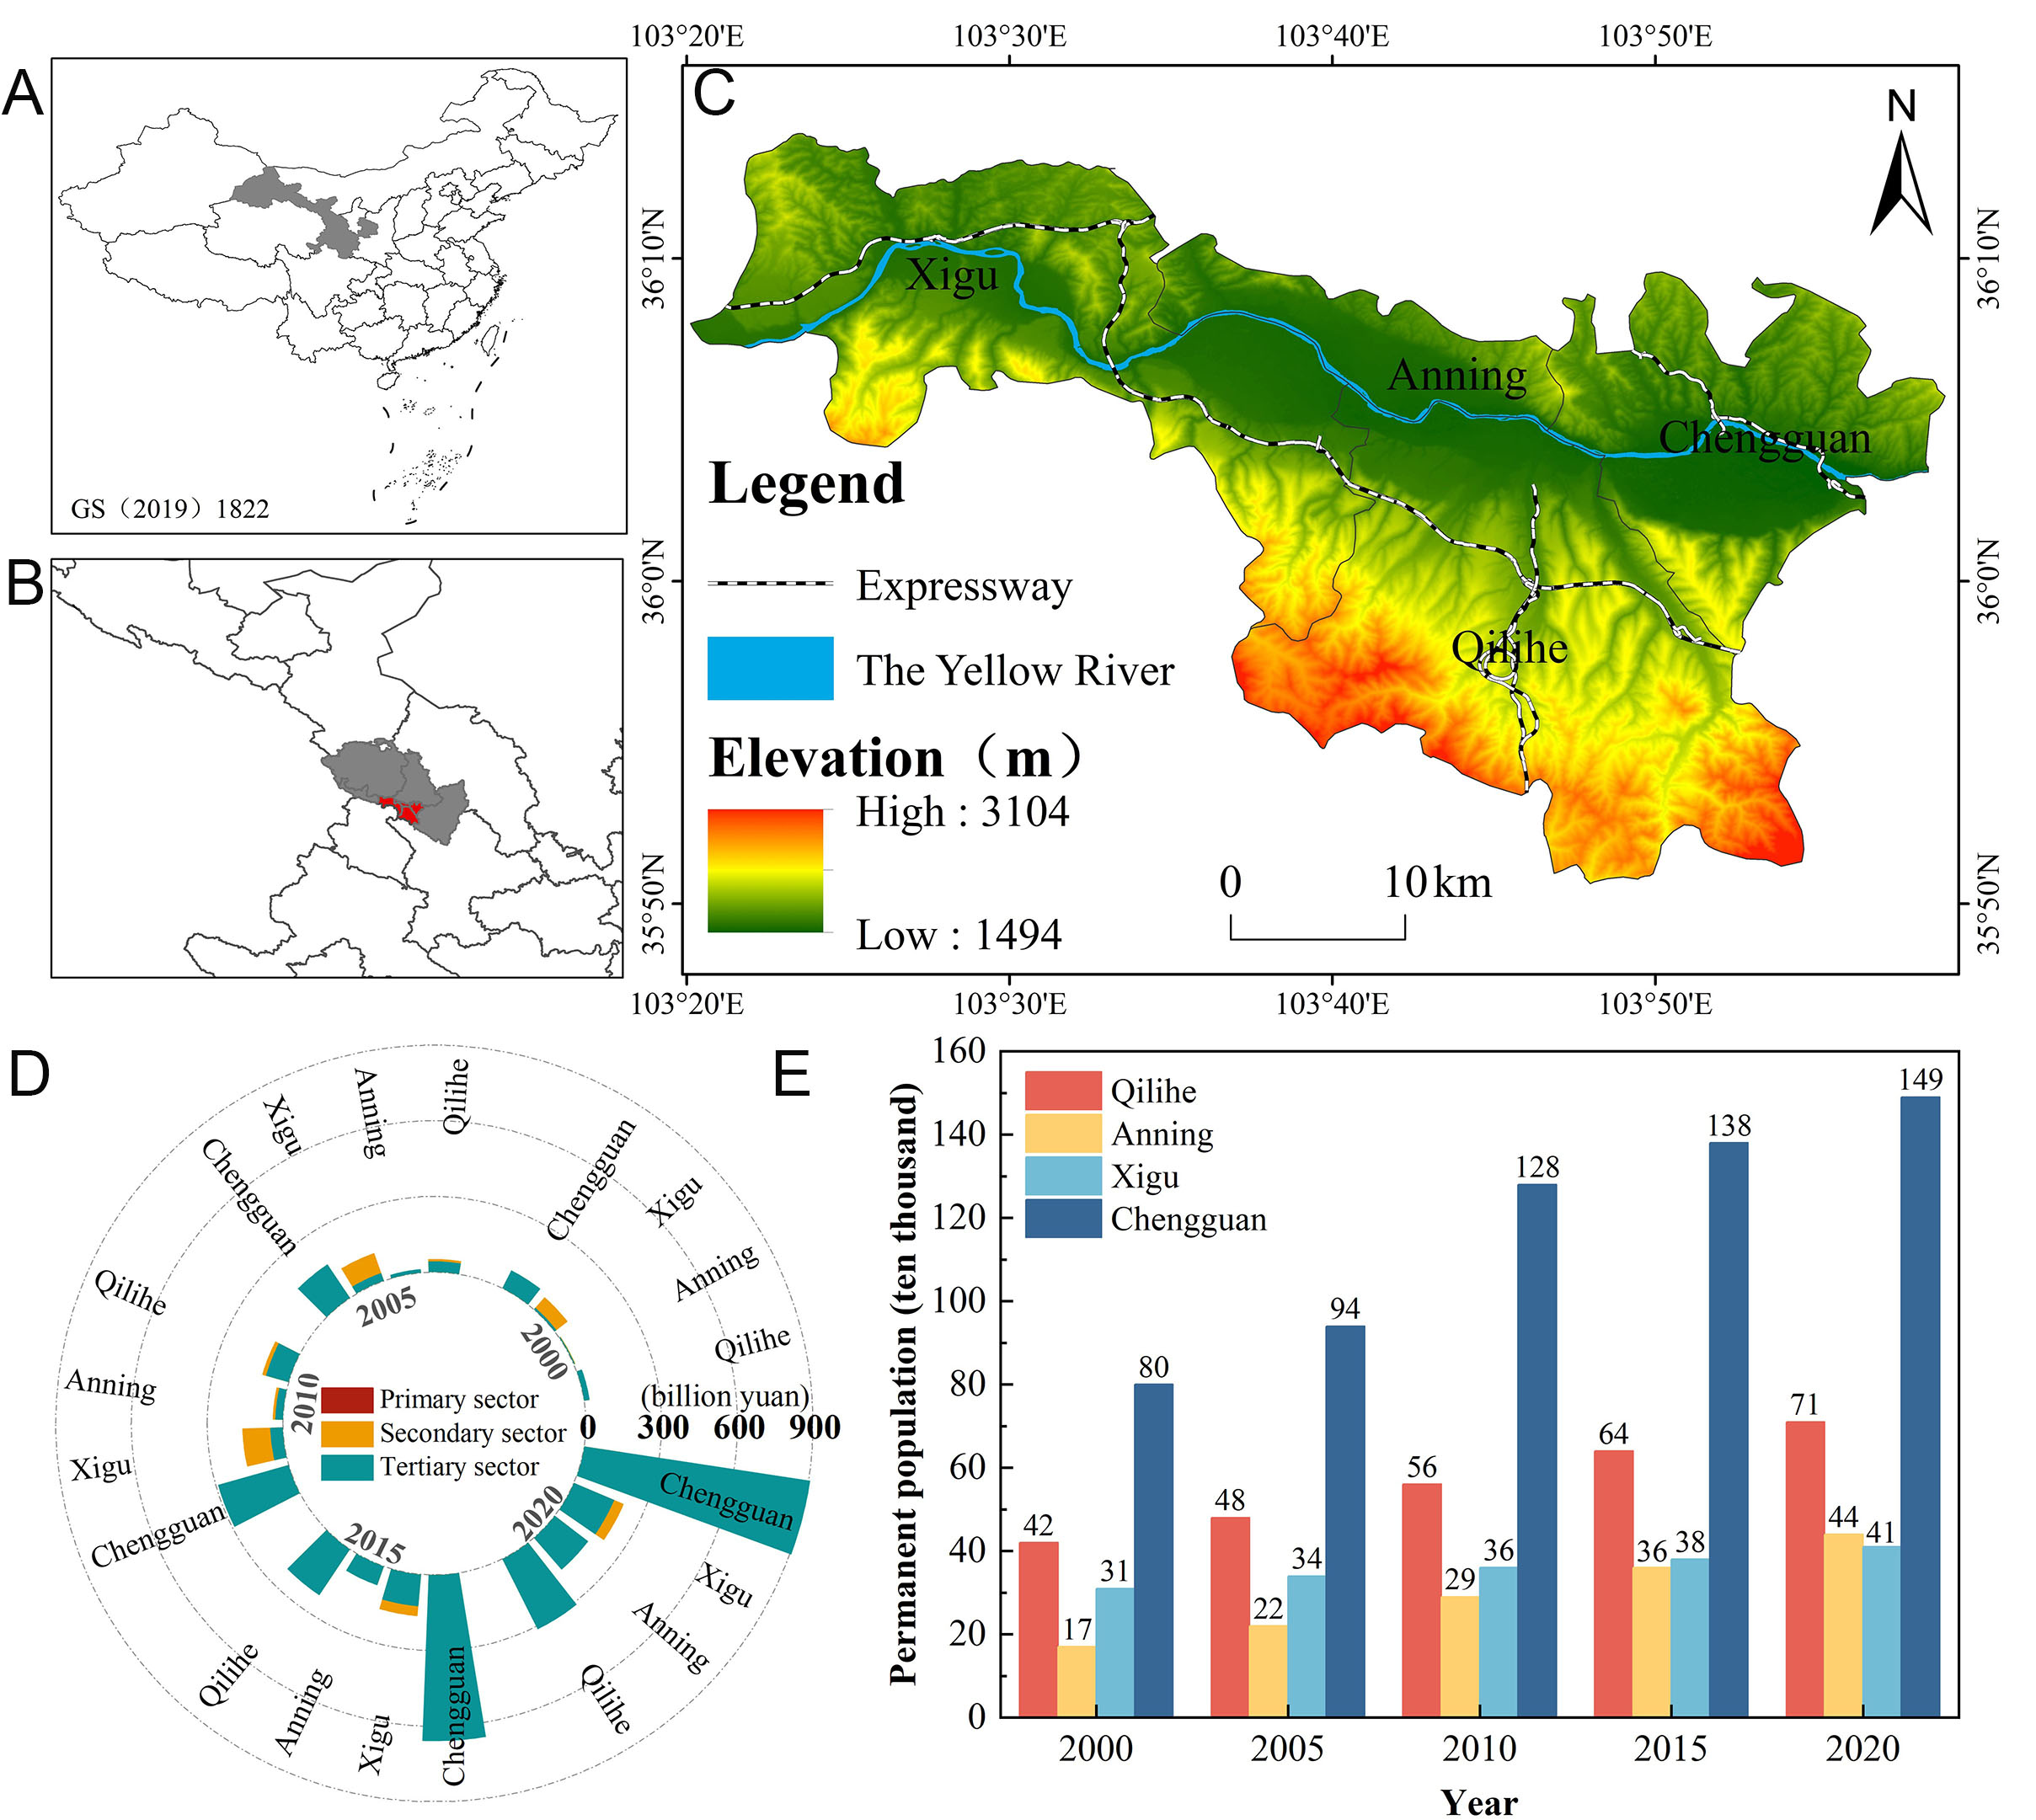
Figure 1. Overview of the study area: (A) Location of Gansu Province, China (gray); (B) Location of the main urban area of Lanzhou (red); (C) DEM elevation map of the main urban area of Lanzhou; (D) GDP, 2000-2020; (E) Permanent population, 2000-2020.
Methods
Land use transfer matrix
The land use transfer matrix quantifies both the direction and magnitude of land use changes between two time periods[38]. The calculation formula is as follows:
where Sij is the area of land converted from type i to type j, and n represents the number of land use types.
Carbon sink function and intensity
(1) Carbon sink function
Land use directly influences carbon sink capacity[39]. This study focuses on five major types of green land in Lanzhou: forest land, grassland, cropland, wetland, and park green space. The carbon sink is calculated using the following formula:
where Cs is the total carbon sink, Si is the carbon sink of type I, Ai represents the area of land use type i within the study area, and αi denotes the corresponding carbon sink coefficient.
(2) Carbon sink intensity
Because the size of the land area greatly affects the total carbon sink, carbon sink intensity is used to measure the carbon sink capacity per unit area. The formula is as follows:
where Cp is the carbon sink intensity, Cs is the total carbon sink, and Su is the area of land use.
Selection of carbon sink coefficients
Carbon sink coefficients vary by land use type. This study refers to relevant literature to identify appropriate coefficients for different land types in Lanzhou, as presented in Table 1. Forest land is divided into four subcategories: closed forest land, shrubbery, sparse woodland, and other woodlands. Wetland is subdivided into reservoir pits and ponds, rivers and canals, and mudflats. Priority was given to coefficients derived from empirical measurements and modeling conducted in arid or semi-arid regions. For example, the coefficients for woodland and cropland were obtained from large-scale field surveys and remote sensing assessments across northern China. Values for wetland and park green space were drawn from studies conducted in regions with similar land cover and climate characteristics. This approach ensures that the selected coefficients reflect both land type and environmental context, thereby enhancing the accuracy of carbon sink estimations.
Carbon sink coefficients by land use type
| Green space category | Carbon sink coefficient (ton/mu·year) | |
| Woodland | Closed forest land | 0.87[40] |
| Shrubbery | 0.23[40] | |
| Sparse woodland | 0.58[41] | |
| Other woodlands | 0.2327[41] | |
| Cropland | Dry land | 0.41[42] |
| Grassland | Grassland | 0.01[43] |
| Wetland | Reservoir pits and ponds | 0.303[44] |
| Rivers and canals | 0.671[44] | |
| Mudflat | 0.45[44] | |
| Park green space | Park green space | 1.66[45] |
Value of carbon sinks
(1) Market value method
The market value of carbon sinks depends on both their price and volume. Since changes in volume are objectively fixed from an elemental perspective[46], the price has the greatest impact on overall value. The calculation formula is as follows:
where V denotes the economic value of the ecological carbon sink; Co represents the total carbon sink of the ecosystem; and P denotes the carbon trading price in CNY per ton of CO2 (CNY/t-CO2).
(2) Present value method
The present value represents the value of a future amount of money discounted to its value today using compound interest. This study applies the present value method to calculate historical carbon trading prices. The formula is:
where Pn is the price in period n, F is the final value, (P/F,e,n) is the present value factor of compound interest, e is the discount rate, and n is the number of periods.
Dynamic degree analysis
Dynamic degree analysis quantifies changes in both rate and direction over a given time period. This study used dynamic degree analysis to examine the average annual variation in carbon sinks across different locations and land use types[22]. The formula is:
where D is the average annual rate of change, Ul is the carbon sink at the end of the study period, Uf is the carbon sink at the beginning, and T is the time interval in years.
Geographically weighted regression analysis
GWR accounts for spatial relationships in the context of least squares regression analysis[47]. GWR assigns different weights to spatial locations by calculating a spatial attenuation function, enabling the evaluation of how much individual factors influence the dependent variable across different locations. In this study, GWR was conducted using the “Geographically Weighted Regression” tool in ArcMap 10.7. A Gaussian kernel function and an adaptive bandwidth of 3.579 units were applied. The model is expressed as:
where (ui, vi) are the coordinates of location i, β0 (ui, vi) denotes the regression coefficient, xik denotes the value of the kth independent variable at point i, and εi is the error term assumed to follow a normal distribution, εi~N (0, σ2).
Data sources
Land use data were obtained from the “China Multi-period Land Use Land Cover Remote Sensing Monitoring Database”, which provides 30-meter resolution remote sensing classifications based on national land use standards. Primary land use types were used for spatial analysis, while secondary-level classifications supported the estimation of carbon sinks. Urban green space data, particularly for park areas, were supplemented by records from the Forestry Bureau of Lanzhou to improve the accuracy and completeness of green space information. Socioeconomic data, including population size and gross domestic product (GDP), were sourced from the Lanzhou Statistical Yearbooks for the corresponding years.
RESULTS
Evolution of urban green space structure
General characteristics of urban green space
The land use composition of Lanzhou's main urban area from 2000 to 2020 is summarized in Table 2. Over this 20-year period, cropland area exhibited a continuous decline, decreasing by 63.72 km2 - from
Land use structure in Lanzhou’s main urban area, 2000-2020
| Year | Area (km2) | |||||
| Cropland | Woodland | Grassland | Water | Built-up land | Unexploited land | |
| 2000 | 264.23 | 115.22 | 499.98 | 20.44 | 140.86 | 3.17 |
| 2005 | 253.29 | 109.53 | 501.03 | 20.28 | 156.62 | 3.17 |
| 2010 | 230.36 | 117.83 | 499.14 | 20.48 | 171.78 | 4.32 |
| 2015 | 225.90 | 116.35 | 492.20 | 20.35 | 177.54 | 11.57 |
| 2020 | 200.51 | 121.72 | 463.34 | 18.38 | 235.73 | 4.22 |
Figure 2 presents the spatial changes in land use types from 2000 to 2020. From a spatial perspective, due to the constraints of geographic location and natural conditions, the study area displays a landscape transition pattern from the urban core to the outskirts: built-up land, followed by woodland, cropland, and then grassland. Overall, grassland and cropland dominate the land use in the region. Cropland is mainly distributed in Xigu and Qilihe Districts, accounting for 71% to 79% of total cropland. Grassland is mainly concentrated in Qilihe District, while woodland is mostly distributed in Xigu and Qilihe, together making up 74% to 82% of the total woodland area. Built-up land is concentrated in Chengguan District, comprising 31% to 37% of all urban construction land. Unexploited land remains limited and is primarily found in Chengguan District. Water bodies are mainly distributed in Xigu District, contributing 49% to 53% of the total water area. Initially, built-up land was characterized by fragmented patches with limited connectivity. However, by 2010, surrounding land types - particularly cropland - had gradually been converted into urban land, improving the spatial continuity of built-up areas. This process further intensified land-use concentration and resulted in a belt-like distribution of built-up areas along both banks of the Yellow River.
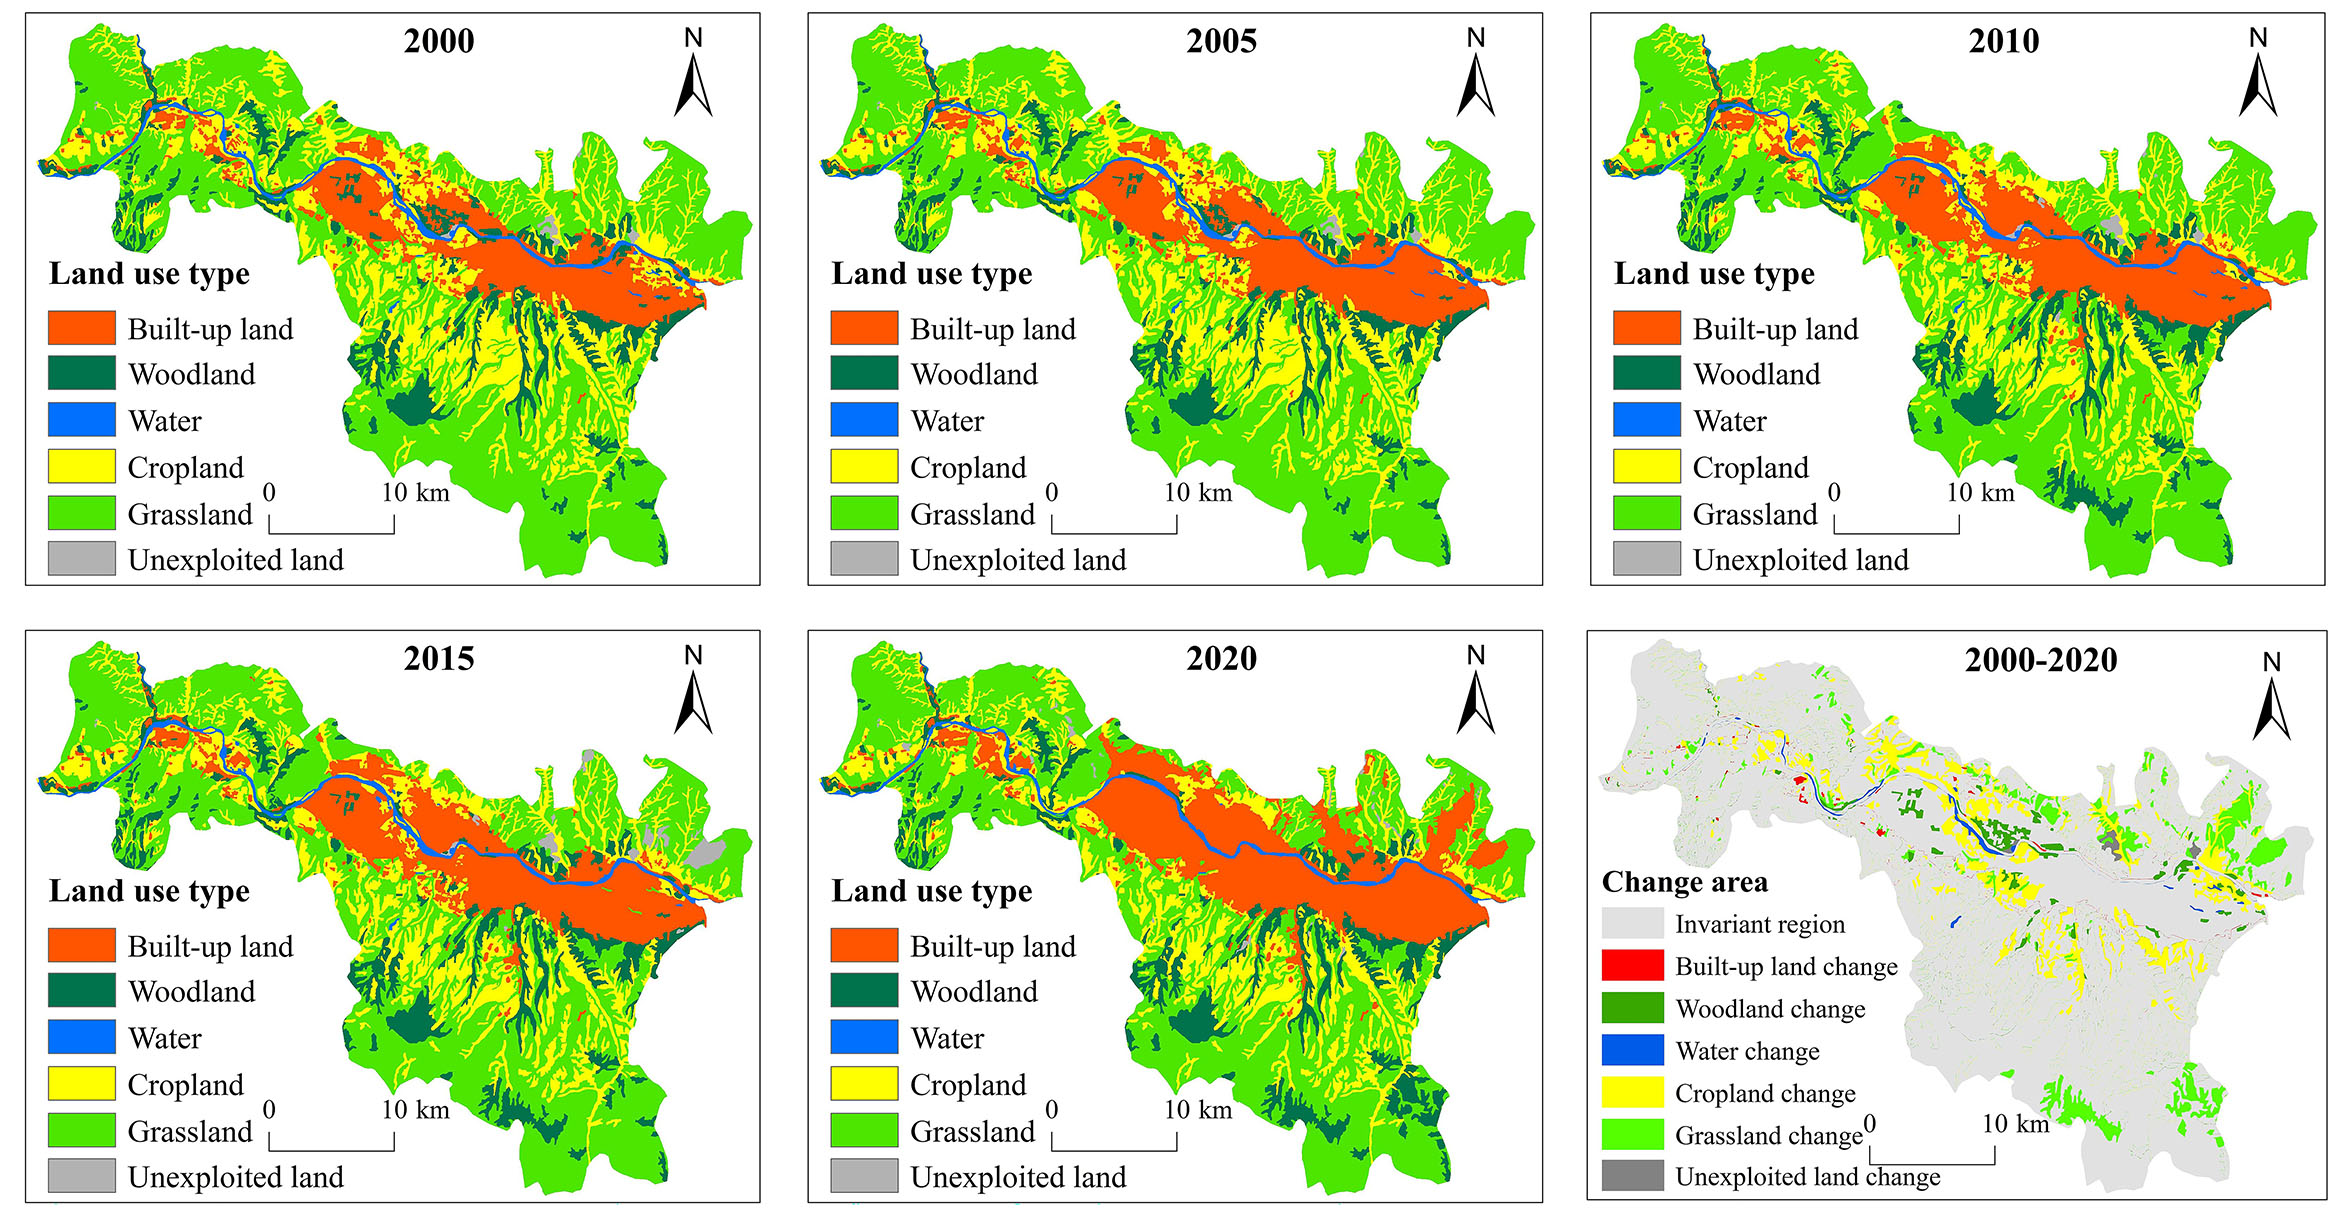
Figure 2. Spatial distribution map of land use in Lanzhou, 2000-2020.
Analysis of the evolution of urban green space
The land use transfer matrix reveals both the direction and magnitude of land type conversions over time. Figure 3 provides a more intuitive visualization of the inflows and outflows among land use categories. From 2000 to 2005, cropland was primarily converted to construction land, with a total of
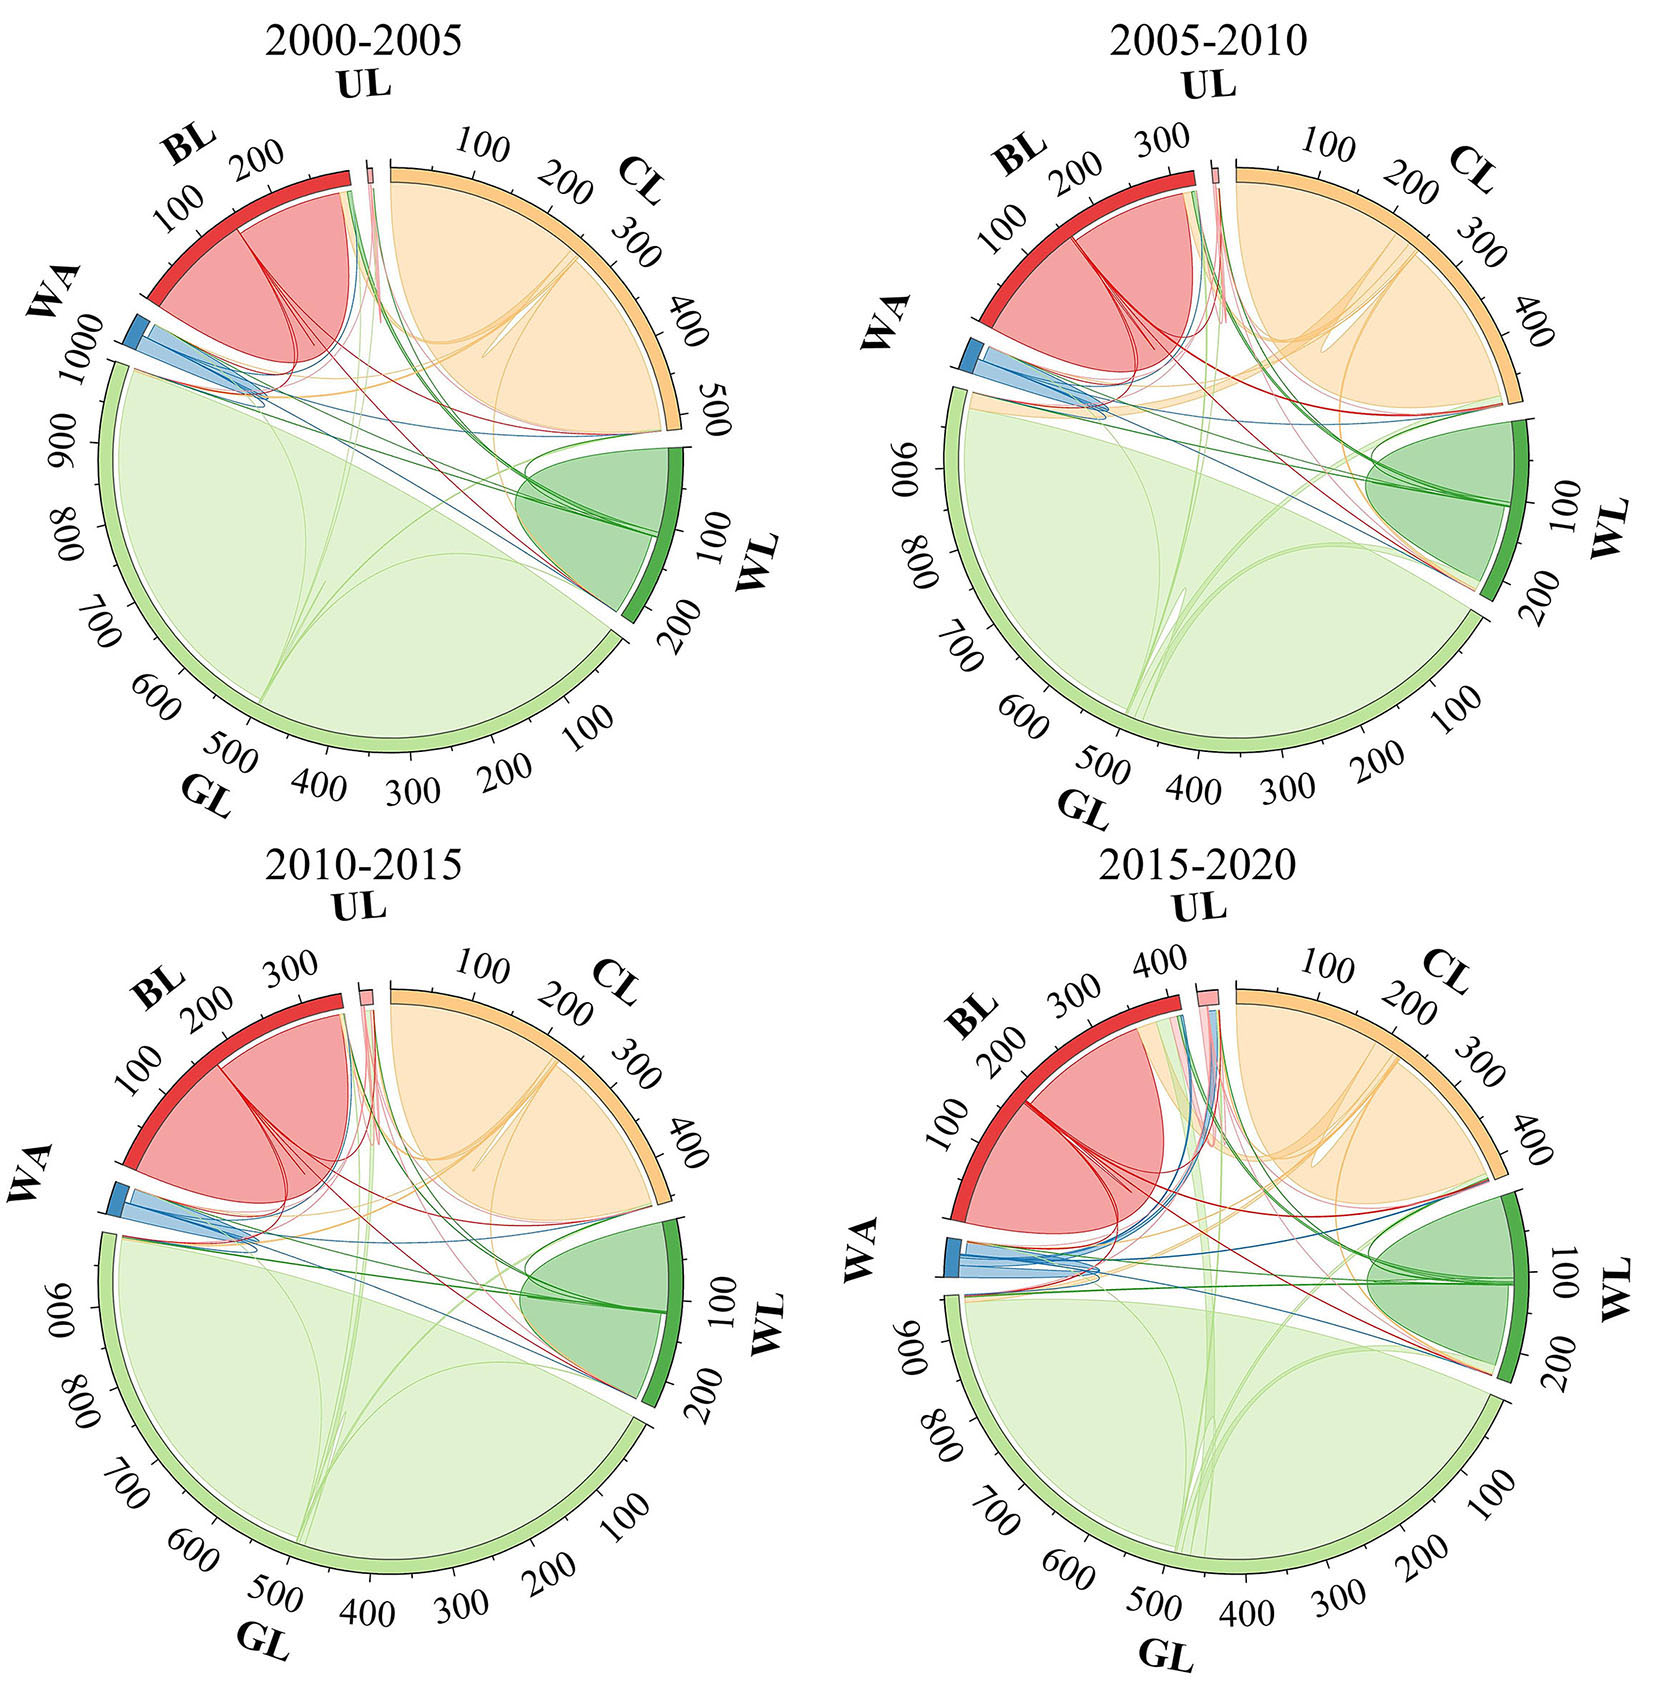
Figure 3. Land use transfer matrix chord chart, 2000-2020. Note: CL, WL, GL, WA, BL, and UL represent Cropland, Woodland, Grassland, Water area, Built-up land, and Unexploited land, respectively.
Carbon sink functions and the evolution of urban green spaces
Quantitative and structural characteristics of carbon sinks
As land use patterns evolved, both the total carbon sink and the carbon sink intensity of urban green spaces in Lanzhou underwent dynamic changes [Figure 4]. Overall, the total carbon sink decreased slightly, from 3.61 × 10⁵ tons in 2000 to 3.54 × 10⁵ tons in 2020. Between 2000 and 2005, carbon sinks declined sharply, primarily due to the accelerated expansion of built-up land and the conversion of ecological land into urban areas. These changes were further intensified by Lanzhou’s valley-constrained topography, which channels urban development into ecologically sensitive corridors along the Yellow River. From 2005 to 2015, a modest recovery in carbon sinks was observed. This improvement can be attributed to several factors. First, Lanzhou implemented a series of urban greening and ecological restoration initiatives that enhanced vegetation coverage. Second, growing public and governmental awareness of climate change and carbon neutrality goals led to improved local green infrastructure. However, from 2015 to 2020, carbon sinks declined once again, likely due to renewed urban expansion.
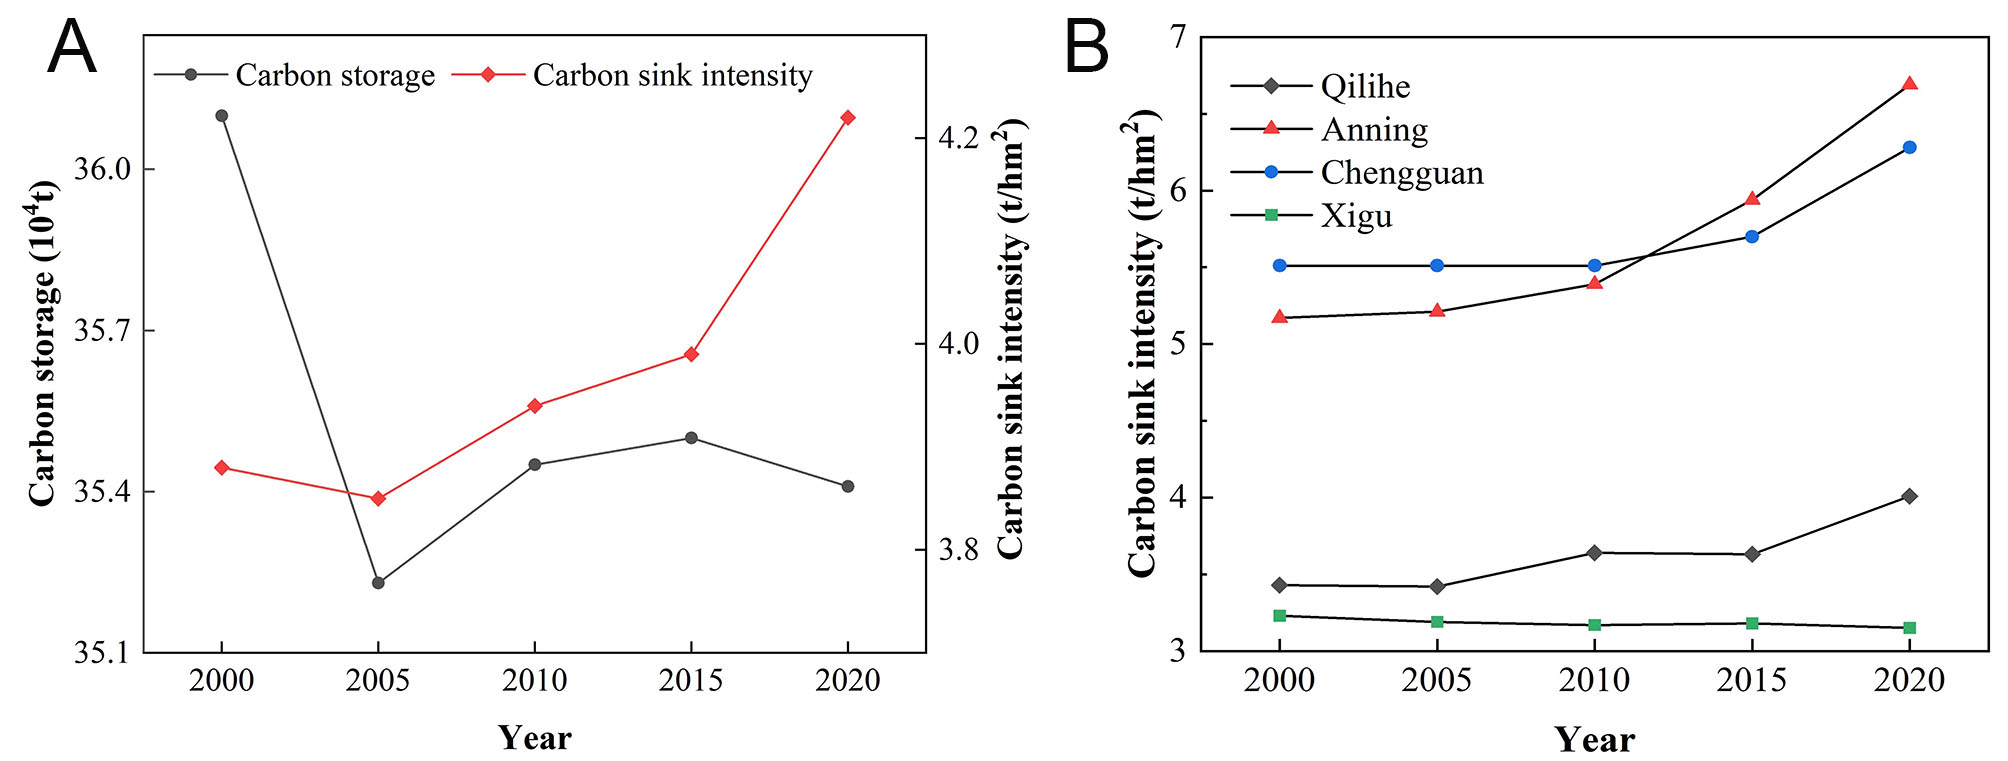
Figure 4. Changes in total carbon sinks and carbon sink intensity in Lanzhou, 2000-2020: (A) Carbon storage and carbon sink intensity across the study area; (B) Carbon sink intensity trends across the four districts.
In contrast, carbon sink intensity (measured in tons per hectare) increased from 3.88 t/hm2 in 2000 to
As shown in Figure 5, cropland consistently contributed the largest share of the total carbon sink (approximately 35%), followed by woodland (around 30%), park green spaces (20%), and wetlands (5%). While the overall structure remained relatively stable, different land types exhibited varying trends. Contributions from cropland, grassland, and other woodland types declined gradually due to land conversion and ecosystem degradation. In contrast, park green space and rivers/canals maintained relatively stable contributions. At the district level, Qilihe District had the highest carbon sink contribution, largely due to its extensive green coverage. Despite high urbanization levels, Chengguan District maintained a moderate contribution due to its well-preserved park system. However, recent declines suggest increasing development pressures. Xigu District experienced a substantial decrease in its carbon sink share after 2015, reflecting rapid industrial expansion.
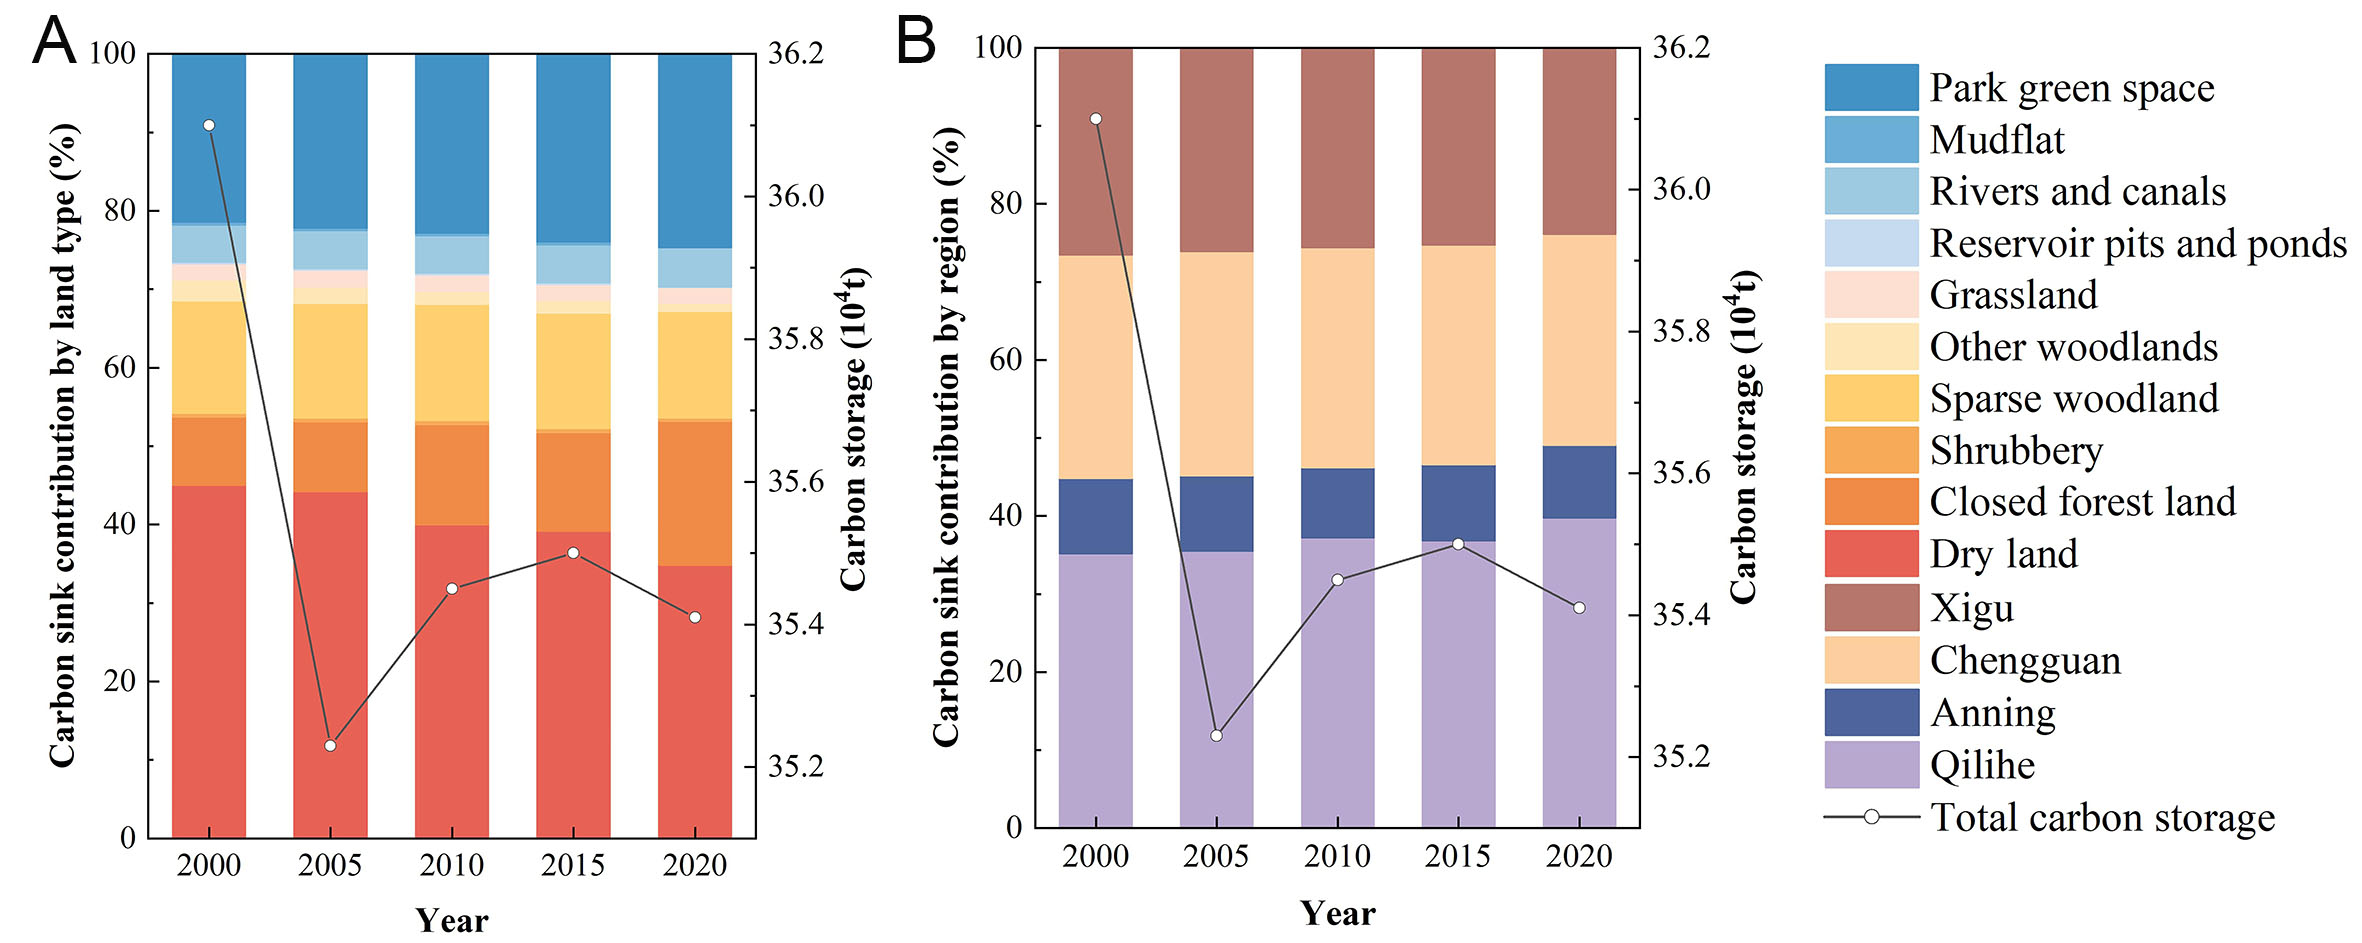
Figure 5. Carbon sink structure in Lanzhou, 2000-2020: (A) carbon sink contribution by land type; (B) carbon sink contribution by region.
Analysis of the evolution of carbon sink dynamics
The dynamic changes in carbon sinks across the four districts of Lanzhou over the four time periods are shown in Figure 6. The types and total amounts of carbon sinks in these districts do not exhibit any clear or consistent trends. In Qilihe District, the carbon sequestration capacity of forest land increased during 2005-2010 and 2015-2020, while the carbon sink of park green spaces grew in all periods except 2005-2010. while the carbon sinks of cropland, grassland, and wetland decreased in all study periods. In Anning District, the degree offluctuation in the various types of carbon sinks was more pronounced compared to the other three districts. In Xigu District, aside from an increase in wetland carbon sinks from 2010 to 2015, most types either showed little change or decreased. Notably, the carbon sink from park green spaces in Xigu District continued to grow and remained relatively stable compared to those in the other districts. In Chengguan District, except for the 2000-2005 period, the trends in woodland and grassland carbon sinks were similar: both increased from 2005 to 2010, then decreased during 2010-2015 and 2015-2020.
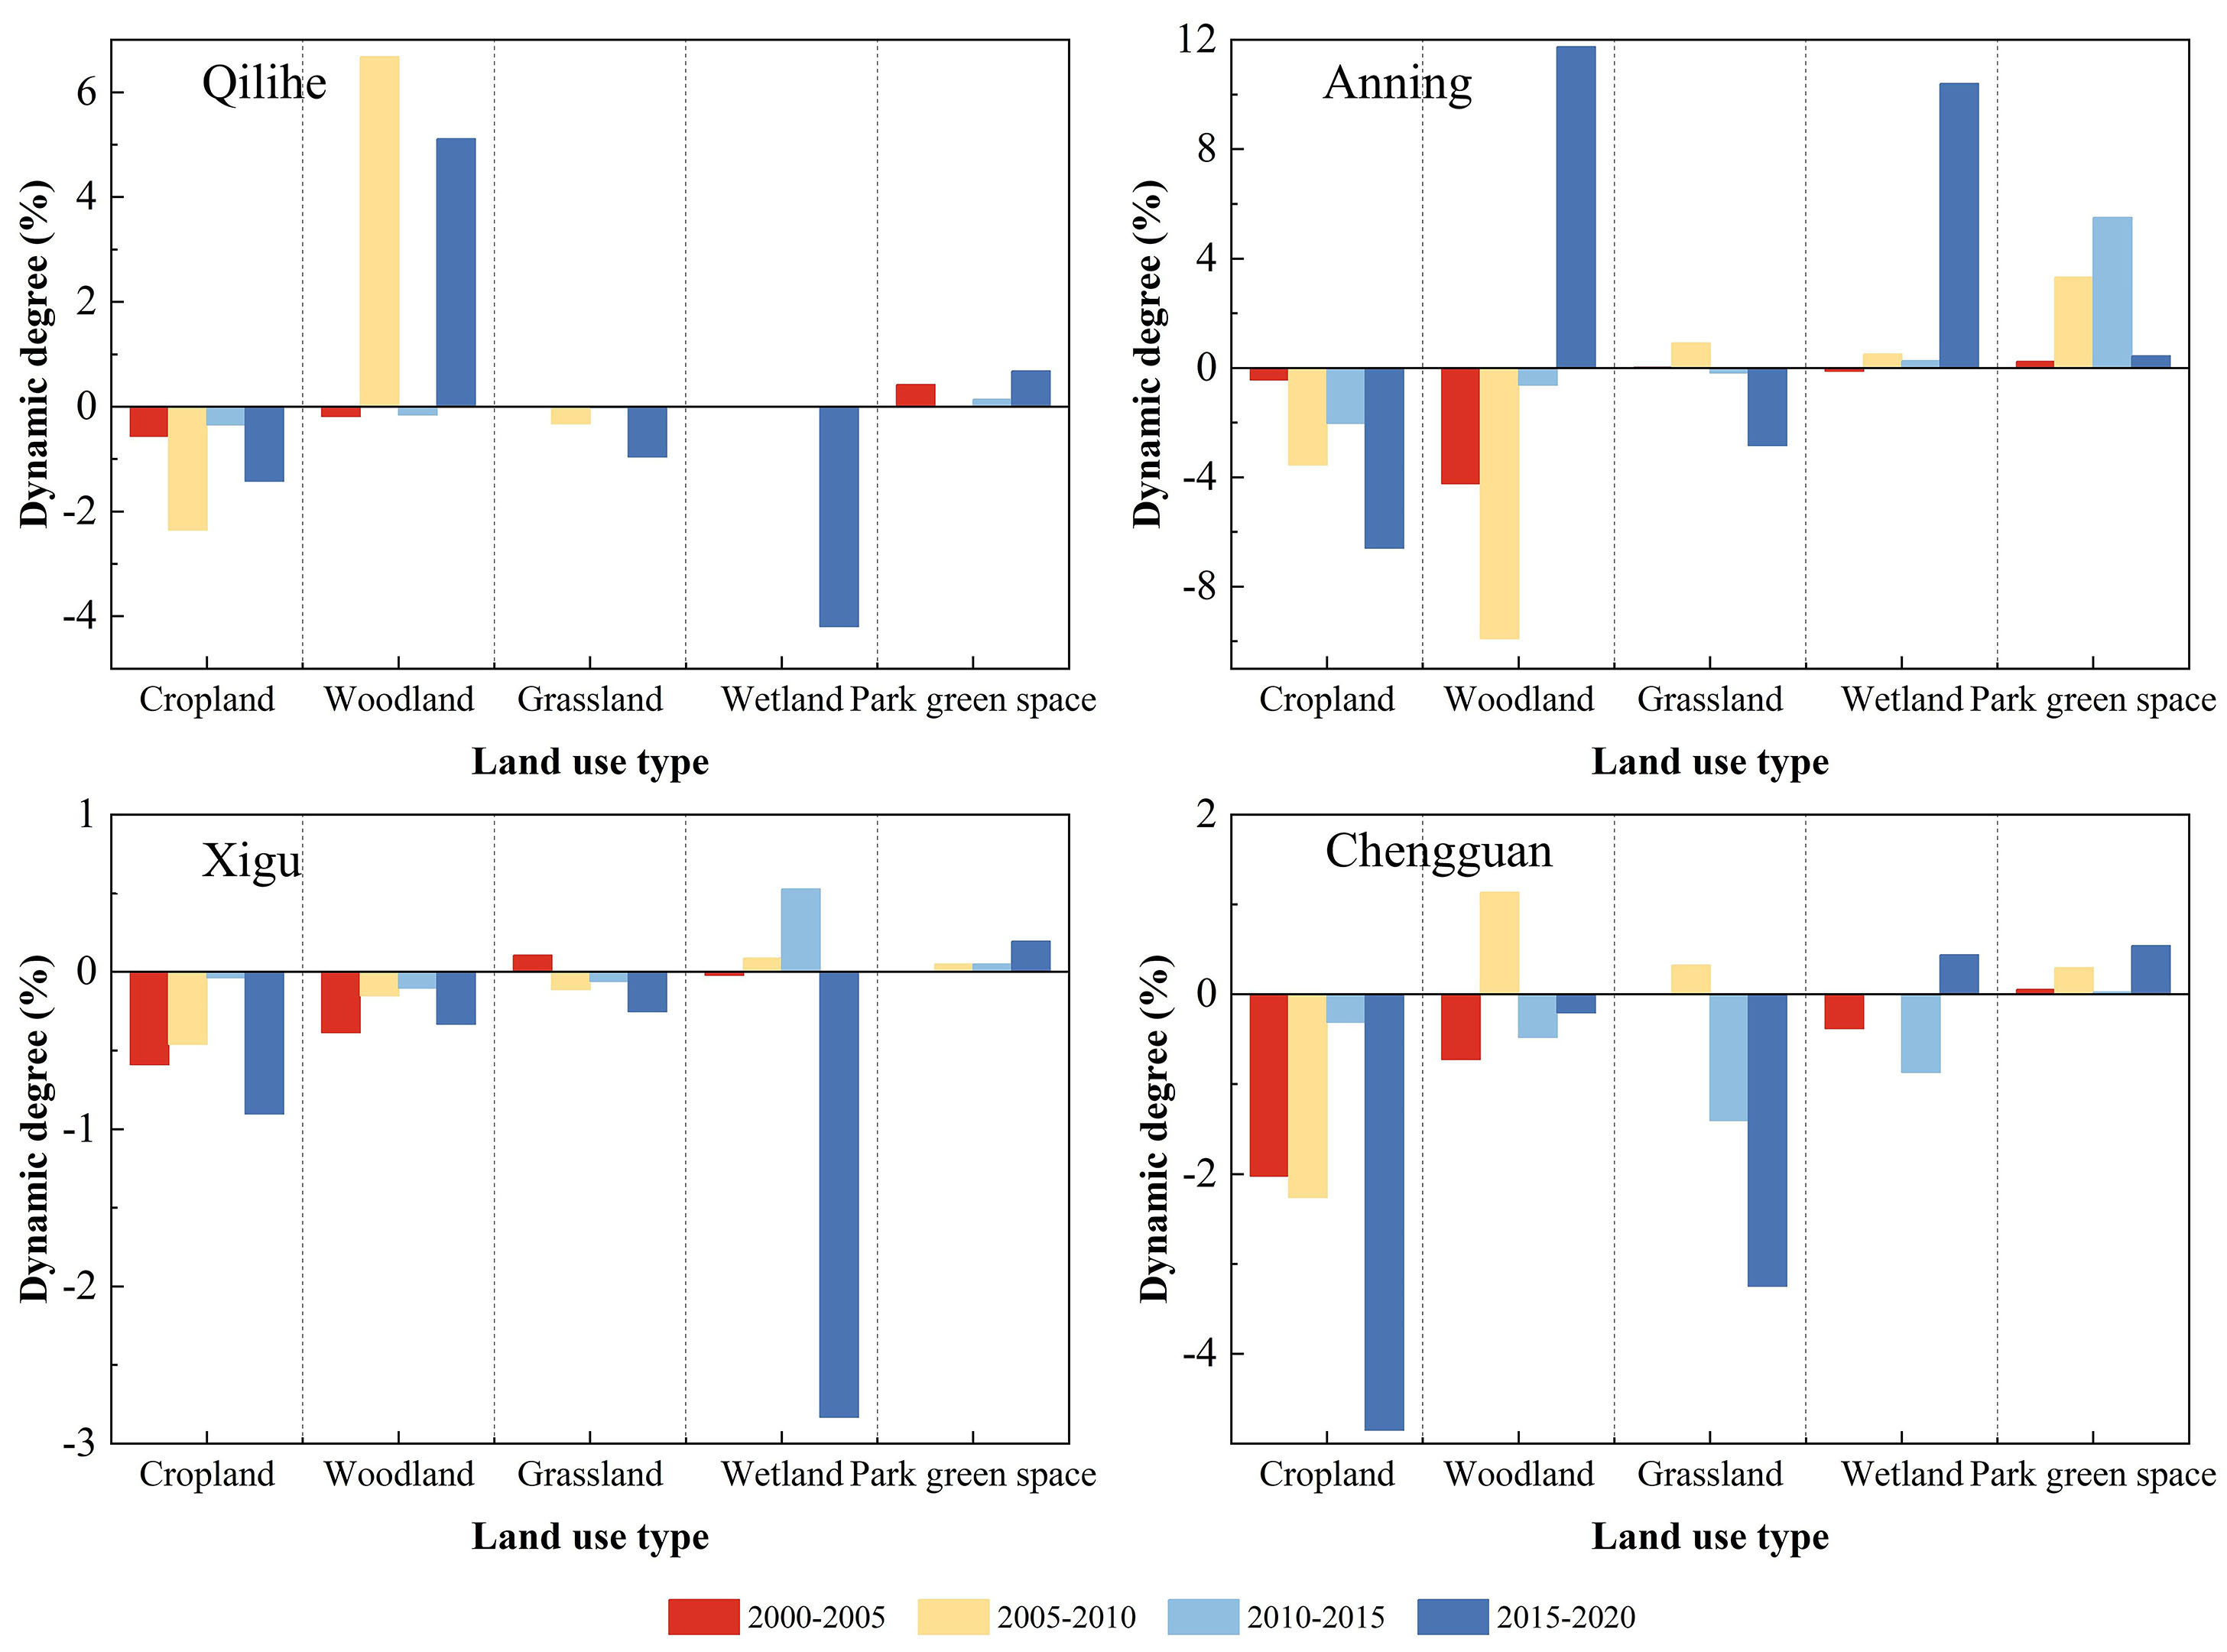
Figure 6. Changes in the dynamics of different types of carbon sinks in Lanzhou, 2000-2020.
Value of carbon sinks in urban green spaces
Carbon sink trading prices
During the carbon trading process, factors such as market supply and demand, trading locations, and policy conditions influence the price of carbon sinks. As shown in Table 3, the average carbon trading price in the Shanghai carbon emissions trading market from July to December 2021 was 44.11 CNY/ton. This figure is used as the representative carbon trading price for the year 2020 in this study.
National carbon emissions market trading data, July-December 2021
| Month | July | August | September | October | November | December |
| Transaction amount (million CNY) | 29,958.54 | 11,655.09 | 38,459.24 | 10,742.63 | 93,897.07 | 581,410.43 |
| Transaction quantity (tons) | 5,951,937 | 2,488,492 | 9,208,566 | 2,552,970 | 23,029,745 | 135,557,640 |
| Average price (CNY/ton) | 50.33 | 46.84 | 41.76 | 42.08 | 40.77 | 42.89 |
Carbon trading prices in 2000, 2005, 2010 and 2015 were estimated using the present value method and appropriate conversion factors, as displayed in Table 4.
Carbon trading prices, 2000-2020
| Year | 2000 | 2005 | 2010 | 2015 | 2020 |
| Carbon trading price (CNY/ton) | 29.69 | 32.77 | 36.18 | 39.95 | 44.11 |
Carbon sink value analysis
Figure 7 presents the temporal variations in the value of urban green space carbon sinks in Lanzhou from 2000 to 2020. Over this period, the total value increased steadily from 10.72 million CNY in 2000 to
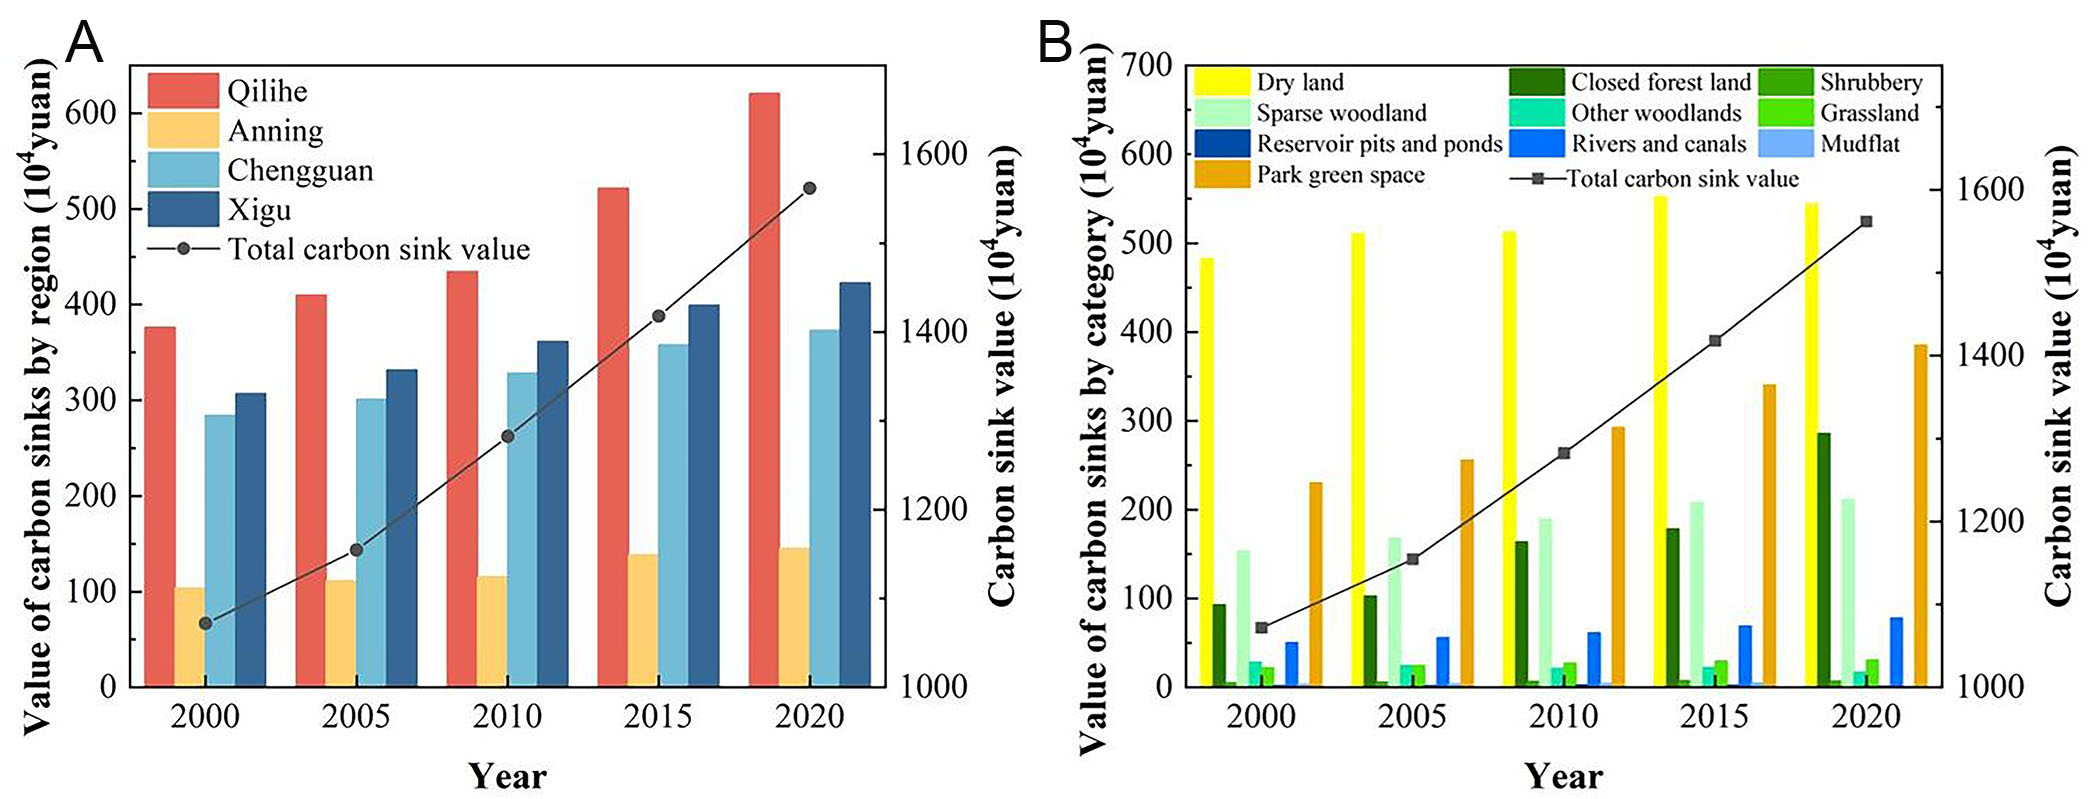
Figure 7. Value and share of carbon sinks in Lanzhou, 2000-2020: (A) Total carbon sink value in the study area and its major districts; (B) Carbon sink value and proportional share by land use type.
Although cropland accounted for the largest total carbon sink value, its ecological and socioeconomic functions differ markedly from other land types such as park green spaces and wetlands. Despite their limited area, park green spaces contributed nearly 25% of the total carbon sink value in 2020, highlighting their high per-unit ecological value in densely populated urban environments. Woodland areas, especially closed forests, exhibited strong carbon sequestration capacity. Wetlands, primarily composed of rivers and canals, provided essential water regulation and carbon storage services. These findings highlight that the carbon sink capacity of different land types is influenced not only by area but also by their ecological function and strategic role within urban systems. Understanding these differences is crucial for effective land use planning and the formulation of low-carbon urban development strategies.
Analysis of factors influencing the carbon sink function of urban green space
Selection of influencing factors
Most existing studies focus on the influence of natural factors such as climate, precipitation, vegetation, topography, and geomorphology on carbon sink functions. In contrast, this study investigates three human-induced factors: economic development, industrial structure, and land use intensity, aiming to explore anthropogenic drivers of carbon sink variation under the dual pressures of urbanization and land transformation. The selection of these variables is guided by both theoretical and methodological considerations. The GWR method requires a high degree of independence among explanatory variables, and including too many can lead to multicollinearity. This focused approach is further supported by recent county-level studies in China, which similarly prioritize human-induced variables over ecological ones when applying spatial regression models[48]. The definitions and rationale for the three selected variables are as follows: (1) Economic development: as urbanization and economic growth accelerate, associated problems - such as environmental degradation- also emerge, leading to declines in carbon sink capacity. Gross domestic product (GDP) is used as an indicator of economic development; (2) Industrial structure: Pollution generated by energy production and industrial activities adversely impacts the ecological environment. Adjusting the industrial structure is therefore essential for carbon sink enhancement. This factor is measured by the proportion of secondary industry output in total GDP; and (3) Land use intensity: With the advancement of urbanization, construction land increasingly encroaches upon green and ecological spaces, thereby weakening carbon sink functions. Land use intensity is quantified as the ratio of construction land area to total land area.
Results of the analysis of influencing factors
Among the three examined factors, land use intensity had the greatest impact on carbon sinks, followed by industrial structure and economic development [Figure 8]. A clear negative correlation was observed between land use intensity and carbon sink capacity, with the strongest effect seen in 2020.
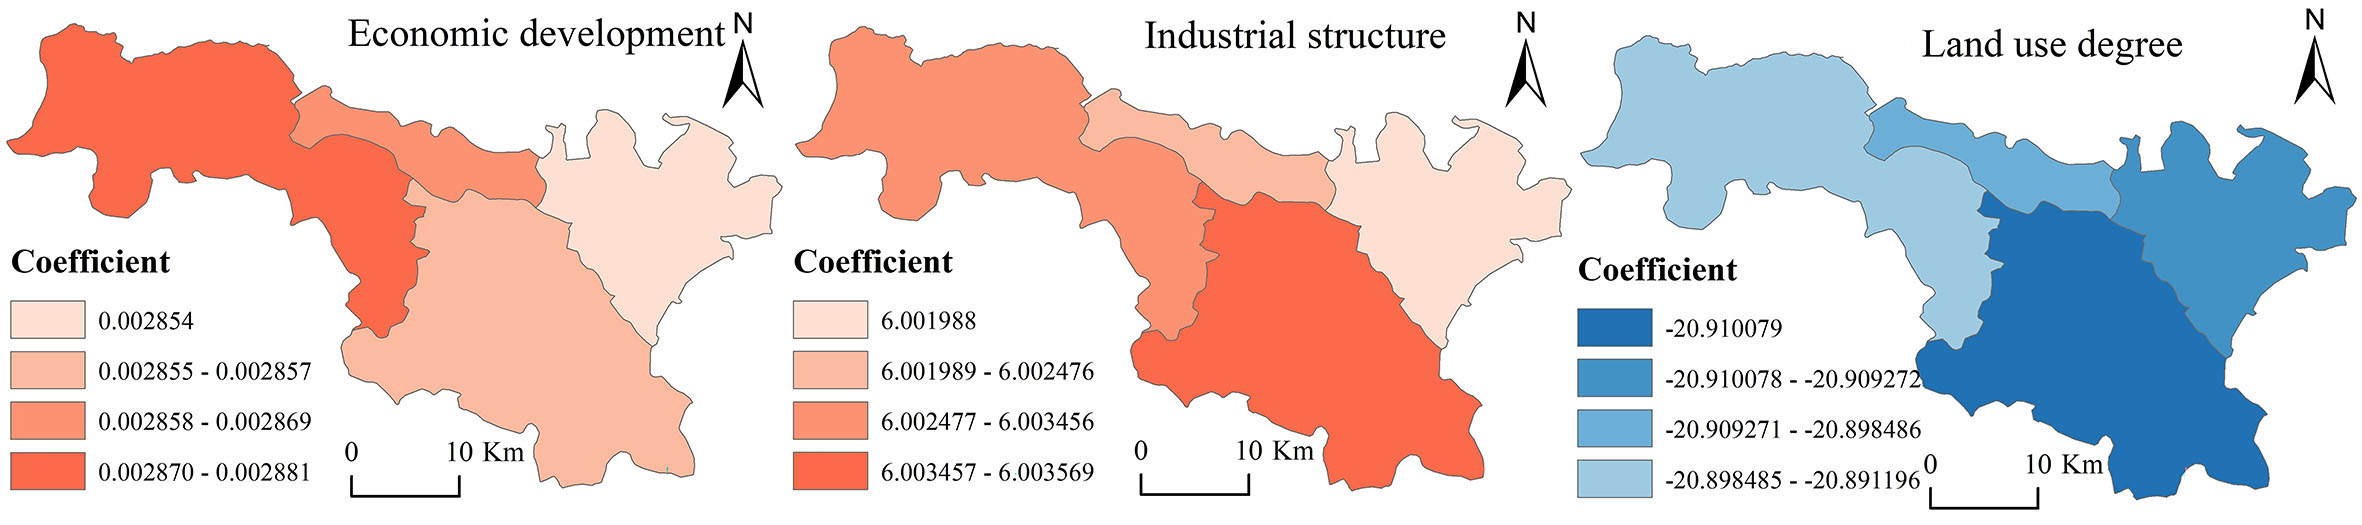
Figure 8. Spatial distribution of regression coefficients for the GWR model in 2020.
Regarding economic development, the regression coefficient for GDP showed relatively low fluctuation but displayed spatial heterogeneity. In 2020, the influence of economic development on carbon sinks was positively correlated across all regions, with the most pronounced effect observed in Xigu District. In these areas, regional economic development appears to promote the development of local environmental protection industries.
For the industrial structure, a positive correlation with carbon sink capacity indicates that technological advancements may mitigate environmental impacts. In 2020, this positive correlation was most significant in Qilihe District, suggesting that advances in cleaner industrial technologies contributed to improved carbon sink performance.
Land use intensity exerted the strongest negative impact on carbon sinks. Urbanization concentrates populations and accelerates land development, thereby impairing regional carbon sink functions. In 2020, the greatest negative impact was found in Qilihe District, followed by Chengguan and Anning Districts, while Xigu District was the least affected. These findings underscore the importance of prudent land-use planning and stricter regulation of urban expansion in Lanzhou’s central districts.
DISCUSSION
Urbanization-induced land use transitions and carbon sink dynamics in Lanzhou
Urbanization is the principal force reshaping land use in Lanzhou. Rapid population growth and economic development have sharply increased the demand for construction land, prompting the conversion of cropland, grassland, and even forest land into built-up areas. The resulting contraction of high-carbon-sink land types has diminished the city’s overall carbon sink capacity. Similar patterns have been reported for other arid cities, where limited land resources and rapid urban expansion create pronounced tension between ecological conservation and development - findings that accord with those of Pan et al.[19] and Gong et al.[20].
Lanzhou exhibits a concentric pattern of landuse change: moving outward from the urban core, the landscape shifts from construction land to forest land, cropland, and finally grassland. As a river-valley city with restricted developable area, competition for land is intense. Green spaces embedded within the urban fabric are increasingly converted to construction land, further compressing ecological space. Sustainable development, therefore, requires rigorous land-use planning that limits the expansion of construction land, promotes compact development, and prioritizes the use of unused land. Scenario analyses by Qin et al. likewise show that strict controls on construction land expansion are essential for slowing the loss of carbon sink function[18].
Strengthening woodland management and adopting region-specific governance
Among all land use categories, cropland exhibits the largest total carbon sink capacity, averaging 1.44 × 10⁵ tons per year, primarily due to its extensive area. Woodland, although covering only about 30% of the cropland area, is a highly efficient sink and therefore plays a disproportionately large role. Park green spaces, wetlands, and grasslands merit protection owing to their high per-unit sequestration potential. Reducing deforestation, restoring degraded forests, and applying bestpractice land management strategies are essential to sustaining and enlarging woodland sinks[49]. Urban greening policies should thus prioritize both conserving existing forests and expanding woodland cover, selecting tree species with high sequestration potential and rehabilitating degraded green spaces. Significant spatial heterogeneity exists within Lanzhou. Qilihe District provides the strongest carbon sink, whereas the economically advanced Chengguan District contains a higher proportion of construction land and therefore a lower relative share of carbon sink land. Even so, Chengguan’s total sink exceeds that of Anning District because of its extensive park and streetscape greening. This pattern, consistent with the findings of Wang et al., underscores the necessity for differentiated management strategies that reflect each district’s development stage and land use mix[21]. High-density areas such as Chengguan should prioritize vertical greening and other spaceefficient approaches to boost sink density.
Limitations
No universally accepted set of carbon sink coefficients exists; values vary by land use type and region[50]. Coefficients in this study were selected after an extensive literature review to best match Lanzhou’s conditions, but some subjective judgment was unavoidable and may have affected the final estimates. Historical carbon prices before 2020 were reconstructed using a compound present value method, with data from the Shanghai Environment and Energy Exchange. While this approach provides a standardized reference, the reconstruction of historical prices introduces uncertainty that warrants further refinement.
CONCLUSIONS
Using landuse data for 2000-2020 and a GWR model, we analyzed the spatiotemporal evolution of carbon sinks in Lanzhou’s main urban districts. The principal findings are as follows: (1) Land-use change: Cropland and grassland initially dominated Lanzhou’s green space, but accelerated urbanization and valley-type topography have driven substantial expansion of built-up land and corresponding losses of cropland and grassland; (2) Carbon-sink trends: Total carbon sink fell from 361,000 tons in 2000 to 354,100 tons in 2020. Despite this decline, the economic value of the sink rose owing to higher carbon prices. Cropland remained the largest contributor. Spatially, Qilihe District exhibited the strongest - and rising - sink capacity, whereas Chengguan District experienced a continuous decline, largely because of construction land encroachment; (3) Influencing factors: By 2020, land use intensity exerted a markedly stronger negative impact on carbon sinks than any other factor, underscoring the decisive role of land management policy. These insights can guide dry-region cities in enhancing their regional carbon sink potential through targeted urbangreenspace management.
DECLARATIONS
Authors’ contributions
Conceptualization, methodology, software, visualization, writing-original draft: Liang, T.
Conceptualization, methodology, supervision, writing-review and editing: Ma, W.
Methodology, software, visualization: Shao, J.; Gao, X.; Luo, J.; Fan, K
Availability of data and materials
Data and materials are available from the corresponding authors upon reasonable request.
Financial support and sponsorship
This work was supported by the National Natural Science Foundation of China [grant number 42201302], the Natural Science Foundation of Gansu Province [grant number 24JRRA406], and the “Double First-Class” University Construction Project of Lanzhou University [grant number 561120213].
Conflicts of interest
All authors declared that there are no conflicts of interest.
Ethical approval and consent to participate
Not applicable.
Consent for publication
Not applicable.
Copyright
© The Author(s) 2025.
REFERENCES
1. Prada, M.; Prada, I. F.; Cristea, M.; et al. New solutions to reduce greenhouse gas emissions through energy efficiency of buildings of special importance - hospitals. Sci. Total. Environ. 2020, 718, 137446.
2. Wei, W.; Hao, S.; Yao, M.; et al. Unbalanced economic benefits and the electricity-related carbon emissions embodied in China's interprovincial trade. J. Environ. Manag. 2020, 263, 110390.
3. Li, L.; Huang, X.; Yang, H. Optimizing land use patterns to improve the contribution of land use planning to carbon neutrality target. Land. Use. Policy. 2023, 135, 106959.
4. He, W.; Zhang, B. A comparative analysis of Chinese provincial carbon dioxide emissions allowances allocation schemes in 2030: an egalitarian perspective. Sci. Total. Environ. 2021, 765, 142705.
5. Brown, M. A.; Dwivedi, P.; Mani, S.; et al. A framework for localizing global climate solutions and their carbon reduction potential. Proc. Natl. Acad. Sci. USA. 2021, 118, e2100008118.
6. Sharifi, E.; Larbi, M.; Omrany, H.; Boland, J. Climate change adaptation and carbon emissions in green urban spaces: case study of Adelaide. J. Clean. Prod. 2020, 254, 120035.
7. Yang, H.; Ciais, P.; Frappart, F.; et al. Global increase in biomass carbon stock dominated by growth of northern young forests over past decade. Nat. Geosci. 2023, 16, 886-92.
8. Chen, J. M.; Ju, W.; Ciais, P.; et al. Vegetation structural change since 1981 significantly enhanced the terrestrial carbon sink. Nat. Commun. 2019, 10, 4259.
9. Hubau, W.; Lewis, S. L.; Phillips, O. L.; et al. Asynchronous carbon sink saturation in African and Amazonian tropical forests. Nature 2020, 579, 80-7.
10. Gruber, N.; Clement, D.; Carter, B. R.; et al. The oceanic sink for anthropogenic CO2 from 1994 to 2007. Science 2019, 363, 1193-9.
11. Li, Z.; Chen, Y.; Zhang, Q.; Li, Y. Spatial patterns of vegetation carbon sinks and sources under water constraint in Central Asia. J. Hydrol. 2020, 590, 125355.
12. Winkler, K.; Yang, H.; Ganzenmüller, R.; et al. Changes in land use and management led to a decline in Eastern Europe’s terrestrial carbon sink. Commun. Earth. Environ. 2023, 4, 893.
13. Raw, J. L.; Van, Niekerk. L.; Chauke, O.; Mbatha, H.; Riddin, T.; Adams, J. B. Blue carbon sinks in South Africa and the need for restoration to enhance carbon sequestration. Sci. Total. Environ. 2023, 859, 160142.
14. Duque, A.; Peña, M. A.; Cuesta, F.; et al. Mature Andean forests as globally important carbon sinks and future carbon refuges. Nat. Commun. 2021, 12, 2138.
15. Chen, Y.; Feng, X.; Tian, H.; et al. Accelerated increase in vegetation carbon sequestration in China after 2010: a turning point resulting from climate and human interaction. Glob. Chang. Biol. 2021, 27, 5848-64.
16. Zhang, D.; Zhao, Y.; Wu, J. Assessment of carbon balance attribution and carbon storage potential in China's terrestrial ecosystem. Resour. Conserv. Recycl. 2023, 189, 106748.
17. Steenberg, J. W. N.; Ristow, M.; Duinker, P. N.; et al. A national assessment of urban forest carbon storage and sequestration in Canada. Carbon. Balanc. Manag. 2023, 18, 11.
18. Qin, M.; Zhao, Y.; Liu, Y.; Jiang, H.; Li, H.; Zhu, Z. Multi-scenario simulation for 2060 and driving factors of the eco-spatial carbon sink in the Beibu gulf urban agglomeration, China. Chin. Geogr. Sci. 2023, 33, 85-101.
19. Pan, Y.; Zhang, H.; Wang, C.; Zhou, Y. Impact of land use change on regional carbon sink capacity: evidence from Sanmenxia, China. Ecol. Indic. 2023, 156, 111189.
20. Gong, W.; Duan, X.; Sun, Y.; et al. Multi-scenario simulation of land use/cover change and carbon storage assessment in Hainan coastal zone from perspective of free trade port construction. J. Clean. Prod. 2023, 385, 135630.
21. Wang, Y.; Liang, D.; Wang, J.; Zhang, Y.; Chen, F.; Ma, X. An analysis of regional carbon stock response under land use structure change and multi-scenario prediction, a case study of Hefei, China. Ecol. Indic. 2023, 151, 110293.
22. Luo, M.; Liu, H.; Gao, J.; et al. Spatiotemporal variations and influencing factors of urban carbon sink: a case study of Wuhan, China. Ecosyst. Health. Sustain. 2023, 9, 0133.
23. Xiang, S.; Wang, Y.; Deng, H.; Yang, C.; Wang, Z.; Gao, M. Response and multi-scenario prediction of carbon storage to land use/cover change in the main urban area of Chongqing, China. Ecol. Indic. 2022, 142, 109205.
24. Bherwani, H.; Banerji, T.; Menon, R. Role and value of urban forests in carbon sequestration: review and assessment in Indian context. Environ. Dev. Sustain. 2024, 26, 603-26.
25. Shi, X.; Wang, T.; Lu, S.; Chen, K.; He, D.; Xu, Z. Evaluation of China's forest carbon sink service value. Environ. Sci. Pollut. Res. Int. 2022, 29, 44668-77.
26. Wei, J.; Shen, M. Analysis of the efficiency of forest carbon sinks and its influencing factors - evidence from China. Sustainability 2022, 14, 11155.
27. Song, S.; Kong, M.; Su, M.; Ma, Y. Study on carbon sink of cropland and influencing factors: a multiscale analysis based on geographical weighted regression model. J. Clean. Prod. 2024, 447, 141455.
28. Li, X.; Jiang, Y.; Liu, Y.; Sun, Y.; Li, C. The impact of landscape spatial morphology on green carbon sink in the urban riverfront area. Cities 2024, 148, 104919.
29. Wei, X.; Yang, J.; Luo, P.; Lin, L.; Lin, K.; Guan, J. Assessment of the variation and influencing factors of vegetation NPP and carbon sink capacity under different natural conditions. Ecol. Indic. 2022, 138, 108834.
30. Masoudi, M.; Tan, P. Y. Multi-year comparison of the effects of spatial pattern of urban green spaces on urban land surface temperature. Landsc. Urban. Plan. 2019, 184, 44-58.
31. Wong, N. H.; Tan, C. L.; Kolokotsa, D. D.; Takebayashi, H. Greenery as a mitigation and adaptation strategy to urban heat. Nat. Rev. Earth. Environ. 2021, 2, 166-81.
32. Venter, Z. S.; Hassani, A.; Stange, E.; Schneider, P.; Castell, N. Reassessing the role of urban green space in air pollution control. Proc. Natl. Acad. Sci. USA. 2024, 121, e2306200121.
33. Zhang, H. O.; Cen, Q. H. A study summary of urban open space abroad. Urban. Plan. Forum. 2007, 5, 78-84.
34. Feng, L.; Song, W. R. Research advance in ecosyste m service of urban green space. Chin. J. Appl. Ecol. 2004, 3, 527-31.
35. Chen, L.; Wang, Y.; Zhu, E.; Wu, H.; Feng, D. Carbon storage estimation and strategy optimization under low carbon objectives for urban attached green spaces. Sci. Total. Environ. 2024, 923, 171507.
36. Wang, R. Y.; Mo, X.; Ji, H.; et al. Comparison of the CASA and InVEST models' effects for estimating spatiotemporal differences in carbon storage of green spaces in megacities. Sci. Rep. 2024, 14, 5456.
37. Zhao, D.; Cai, J.; Shen, S.; Liu, Q.; Lan, Y. Nature-based solutions: assessing the carbon sink potential and influencing factors of urban park plant communities in the temperate monsoon climate zone. Sci. Total. Environ. 2024, 950, 175347.
38. Wei, M.; Du, C.; Wang, X. Analysis and forecast of land use and carbon sink changes in Jilin Province, China. Sustainability 2023, 15, 14040.
39. Pei, J.; Niu, Z.; Wang, L.; et al. Spatial-temporal dynamics of carbon emissions and carbon sinks in economically developed areas of China: a case study of Guangdong Province. Sci. Rep. 2018, 8, 13383.
40. Fang, J.; Yu, G.; Liu, L.; Hu, S.; Chapin, F. S. 3rd. Climate change, human impacts, and carbon sequestration in China. Proc. Natl. Acad. Sci. USA. 2018, 115, 4015-20.
41. Tang, X.; Zhao, X.; Bai, Y.; et al. Carbon pools in China's terrestrial ecosystems: new estimates based on an intensive field survey. Proc. Natl. Acad. Sci. USA. 2018, 115, 4021-6.
42. Chen, K.; Tao, W.; Fang, X.; We, J. Carbon neutrality assessment and planning application path in territorial spatial planning. Planners 2022, 38, 134-41.
43. Piao, S.; Fang, J.; Zhou, L.; Zhu, B.; Tan, K.; Tao, S. Changes in vegetation net primary productivity from 1982 to 1999 in China. Global. Biogeochem. Cycles. 2005, 19, 2004GB002274.
44. Kong, D.; Zhang, H. Economic value of wetland ecosystem services in the Heihe National Nature Reserve of Zhangye. Acta. Ecol. Sinica. 2015, 35, 972-83.
45. Zhao, M.; Kong, Z. H.; Escobedo, F. J.; Gao, J. Impacts of urban forests on offsetting carbon emissions from industrial energy use in Hangzhou, China. J. Environ. Manag. 2010, 91, 807-13.
46. Berzaghi, F.; Chami, R.; Cosimano, T.; Fullenkamp, C. Financing conservation by valuing carbon services produced by wild animals. Proc. Natl. Acad. Sci. USA. 2022, 119, e2120426119.
47. Li, S.; Zhang, D.; Xie, Y.; Yang, C. Analysis on the spatio-temporal evolution and influencing factors of China's grain production. Environ. Sci. Pollut. Res. Int. 2022, 29, 23834-46.
48. He, Z.; Rui, P. Q.; Rui, W.; Li, Q. W.; Xun, Z. J. Spatiotemporal patterns and factors influencing county carbon sinks in China. Acta. Ecol. Sinica. 2020, 40, 8988-98.
49. Pan, Y.; Birdsey, R. A.; Phillips, O. L.; et al. The enduring world forest carbon sink. Nature 2024, 631, 563-9.
Cite This Article
How to Cite
Download Citation
Export Citation File:
Type of Import
Tips on Downloading Citation
Citation Manager File Format
Type of Import
Direct Import: When the Direct Import option is selected (the default state), a dialogue box will give you the option to Save or Open the downloaded citation data. Choosing Open will either launch your citation manager or give you a choice of applications with which to use the metadata. The Save option saves the file locally for later use.
Indirect Import: When the Indirect Import option is selected, the metadata is displayed and may be copied and pasted as needed.
About This Article
Special Issue
Copyright

Data & Comments
Data
0


Comments
Comments must be written in English. Spam, offensive content, impersonation, and private information will not be permitted. If any comment is reported and identified as inappropriate content by OAE staff, the comment will be removed without notice. If you have any queries or need any help, please contact us at [email protected].