

Life cycle assessment of photo-electrodialysis for freshwater production: A Qatar-based study
 0
0 Abstract
This study evaluates the environmental sustainability of brackish water desalination using photo-electrodialysis (photo-ED). A cradle-to-gate life cycle assessment (LCA) was conducted for a small-scale theoretical photo-ED desalination plant in Qatar. The system employs a Pt/Ir-coated titanium photo-anode that harnesses sunlight to drive ion transport. The assessment covers brackish water extraction, pre-treatment, photo-ED cell operation, and post-treatment. Life cycle impact assessment (LCIA) results indicate a global warming potential (GWP) of
Keywords
INTRODUCTION
Water scarcity is a growing global concern, with nearly two-thirds of the world's population experiencing shortages for at least one month each year[1]. Driven by population growth, global water demand - currently estimated at 4,600 km3 per year - is predicted to increase to 5,500-6,000 km3 annually[2,3]. By 2030, approximately 700 million people are expected to be displaced due to water shortages. Addressing this crisis requires the development of more sustainable methods for freshwater production.
The Gulf Cooperation Council (GCC) countries account for approximately 60% of global desalination capacity, operating more than 400 plants due to limited natural freshwater sources[4]. Membrane-based desalination technologies, such as reverse osmosis (RO), forward osmosis (FO), electrodialysis (ED), and membrane desalination (MD), are increasingly favorable over thermal methods because of their lower energy requirements. RO is currently the most widely adopted technology; however, it has drawbacks such as high pressure demands and membrane fouling[5]. Unlike RO, ED operates under low-pressure conditions, using electricity to drive ion transport and remove salts. By alternating cation exchange membranes (CEMs) and anion exchange membranes (AEMs), ED enables the selective separation of ions, recovery of high-value chemicals, and purification of water streams[6]. Seawater, the most abundant source of water globally, is the primary feedstock for desalination. However, its high salinity (~35 g/L) requires considerably more energy for treatment compared to brackish water (1 g/L)[7]. For this reason, ED is particularly well-suited to brackish water desalination, requiring only 0.4-4 kWh/m3, compared with 2-6 kWh/m3 for RO. ED also achieves high salt removal rates, demonstrates lower susceptibility to scaling, and can operate effectively at high temperatures.
The growing accessibility of renewable energy sources, such as solar and wind, supports the deployment of small, off-grid ED plants in remote areas[8]. Several pilot studies have explored photovoltaic-powered ED (PV-ED) systems for brackish water desalination[9-12], while a few studies have investigated ED coupled with wind energy[13,14]. Recently, emerging approaches such as photo-assisted ED (photo-ED) have gained attention. In photo-ED, photoactive electrodes aid ion transport and pollutant removal under illumination. While studies on photo-ED desalination remained limited, existing work has shown that continuous desalination can be achieved under zero bias (short-circuit conditions) with high salt removal efficiencies. To date, more research has focused on wastewater treatment applications of photo-ED than on desalination[15]. For example, Bensaadi et al. used photo-ED with FeAl2O4 photoelectrodes to remove Ni2+, Cu2+, and Zn2+ ions from wastewater, finding that illumination improved ion transfer[16]. One of the earliest photo-ED desalination studies, conducted in 1980, combined a photoelectrochemical cell with ED[17]. Hamane et al. investigated n-Sr2Fe2O5/p-Sr2Co2O5 photoelectrodes for ion removal and observed enhanced electron transfer and diffusion flux under illumination[18]. Similarly, Cherif et al. reported improved ion transport using CuFeO2 photoelectrodes[19], while Khiter et al. demonstrated the removal of lead ions with membrane photo-ED using visible-light-responsive electrodes (n-BaFeO3-x and p-CuO)[20]. Their study showed that sunlight enabled the photo-reduction of 71% of lead ions. In addition, Chaurasiya et al. conducted a systematic review of carbon-based electrodes for photo-bio-electrocatalytic electrolysis cells, highlighting the superior photocatalytic performance of advanced carbon nanomaterials such as nanotubes and graphene[21]. Despite these advances, photo-ED still faces limitations, including long-term stability issues, photocurrent degradation, and membrane fouling[22].
Like other desalination technologies, photo-ED has potential environmental impacts associated with feedstock use, plant construction, brine disposal, and energy requirements[23]. Life cycle assessment (LCA) is a useful tool for quantifying these impacts across a product's or process's full life cycle, including goal and scope definition, life cycle inventory (LCI), life cycle impact assessment (LCIA), and interpretation[24]. Since electricity generation is often the largest contributor to environmental burden, the type of fuel used in desalination is a critical factor. Integrating renewable energy can substantially reduce these impacts. Although LCA studies on photo-ED are still scarce, some analyses have been conducted on ED systems integrated with other renewable technologies. Xu et al. reviewed ISO standards for seawater desalination, focusing on classification, future development, and applications[25]. Biswas and Yek[26] reported climate change (CC) impacts of 2.46 kg CO2 eq/m3 for seawater and 0.38 kg CO2 eq/m3 for groundwater desalination using ED, with electricity consumption identified as the dominant contributor. Mueller et al. performed an LCA of a reverse ED (RED) system for salinity-gradient power generation and found that membrane manufacturing was the major source of environmental impact across categories[27]. There remains a need to evaluate the sustainability of ED systems powered by renewable energy. This study addresses that gap by performing an LCA of a photo-ED desalination system in Qatar, using a functional unit of 1 m3 of freshwater produced. Sensitivity analyses are also conducted to assess the influence of electricity consumption, membrane durability and electrode coating lifetimes on overall system performance.
SYSTEM DESCRIPTION
In this analysis, the LCA of a theoretical small-scale photo-ED plant is examined in the context of Doha, Qatar. The photo-ED cell design is based on our previous experimental and environmental study[22]. Figure 1 presents a schematic of the photo-ED cell, in which AEMs and CEMs facilitate ion transport under an applied electric field, producing a freshwater diluate stream and a concentrated brine stream. The system incorporates a Pt/Ir-coated titanium anode for solar energy utilization and a V4A steel cathode. Each membrane measures 11 cm × 11 cm, with an active area of 64 cm2. The ED unit comprises five cell pairs (six CEMs and five AEMs), providing a total membrane area of 0.1332 m² and a desalination capacity of 1 L/h. The photoanode coating procedure follows the method described by Rasmi et al.[28]. For the experimental analysis, a salt solution with a salinity of 20 g/L Na2SO4 was used, while a 2 g/L Na2SO4 solution served as the electrolyte. Brackish water was selected for this study due to its regional availability. Furthermore, brackish water desalination by ED requires less energy compared to seawater desalination, making it a suitable option for water-scarce regions. Treating water of lower salinity is also more cost-effective, as higher salinity increases electricity demand. Conversely, RO is generally more effective for seawater desalination, which remains the dominant technology in Qatar.
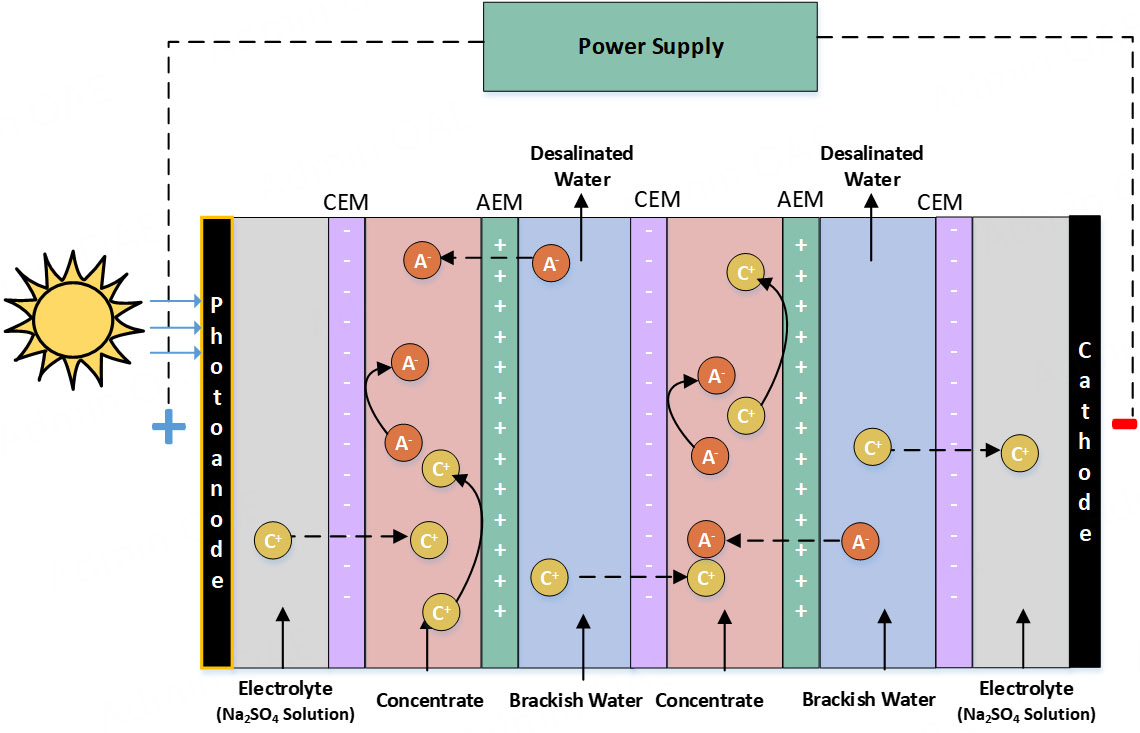
Figure 1. Schematic diagram of the photo-ED process for freshwater production.
GOAL AND SCOPE
The LCA study was conducted using the LCA for Experts software[27], which provides extensive datasets on existing materials and processes. The study adheres to the ISO 14040 principles and frameworks[29], which comprise four main stages: goal and scope definition, inventory analysis, impact assessment, and interpretation, as shown in Figure 2.
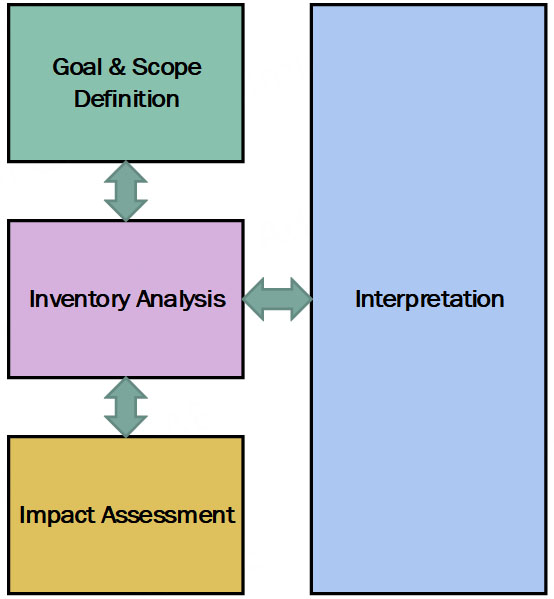
Figure 2. LCA framework based on ISO 14040[29].
This study applies a cradle-to-gate LCA to a photo-ED desalination system in Doha, Qatar. The functional unit is defined as 1 m3 of desalinated water, allowing for consistent comparison with existing literature. Figure 3 shows the system boundary diagram for the production of 1 m3 of freshwater using a photo-ED system. In this process, brackish water is first extracted using pumps, then pre-treated before entering the photo-ED unit for desalination. The freshwater produced undergoes treatment and is subsequently stored for use. As this is a cradle-to-gate study, the distribution, end use, waste management, and disposal stages are excluded. Similarly, the disposal of the brine stream is not considered, as the ED system operates at laboratory scale (1 L/h), producing negligible volumes of brine not managed through conventional large-scale methods. However, it should be noted that brine disposal can have significant environmental impacts, particularly in terms of marine ecotoxicity. Its exclusion may therefore underestimate the overall environmental burden. Future pilot-scale assessments should include brine management to provide more comprehensive results. The LCIA methodology used is CML 2001 (version: August 2016). The selected environmental impact categories include global warming potential (GWP), abiotic depletion potential (ADP), eutrophication potential (EP), freshwater aquatic ecotoxicity (FAE) potential, and terrestrial ecotoxicity (TE) potential.
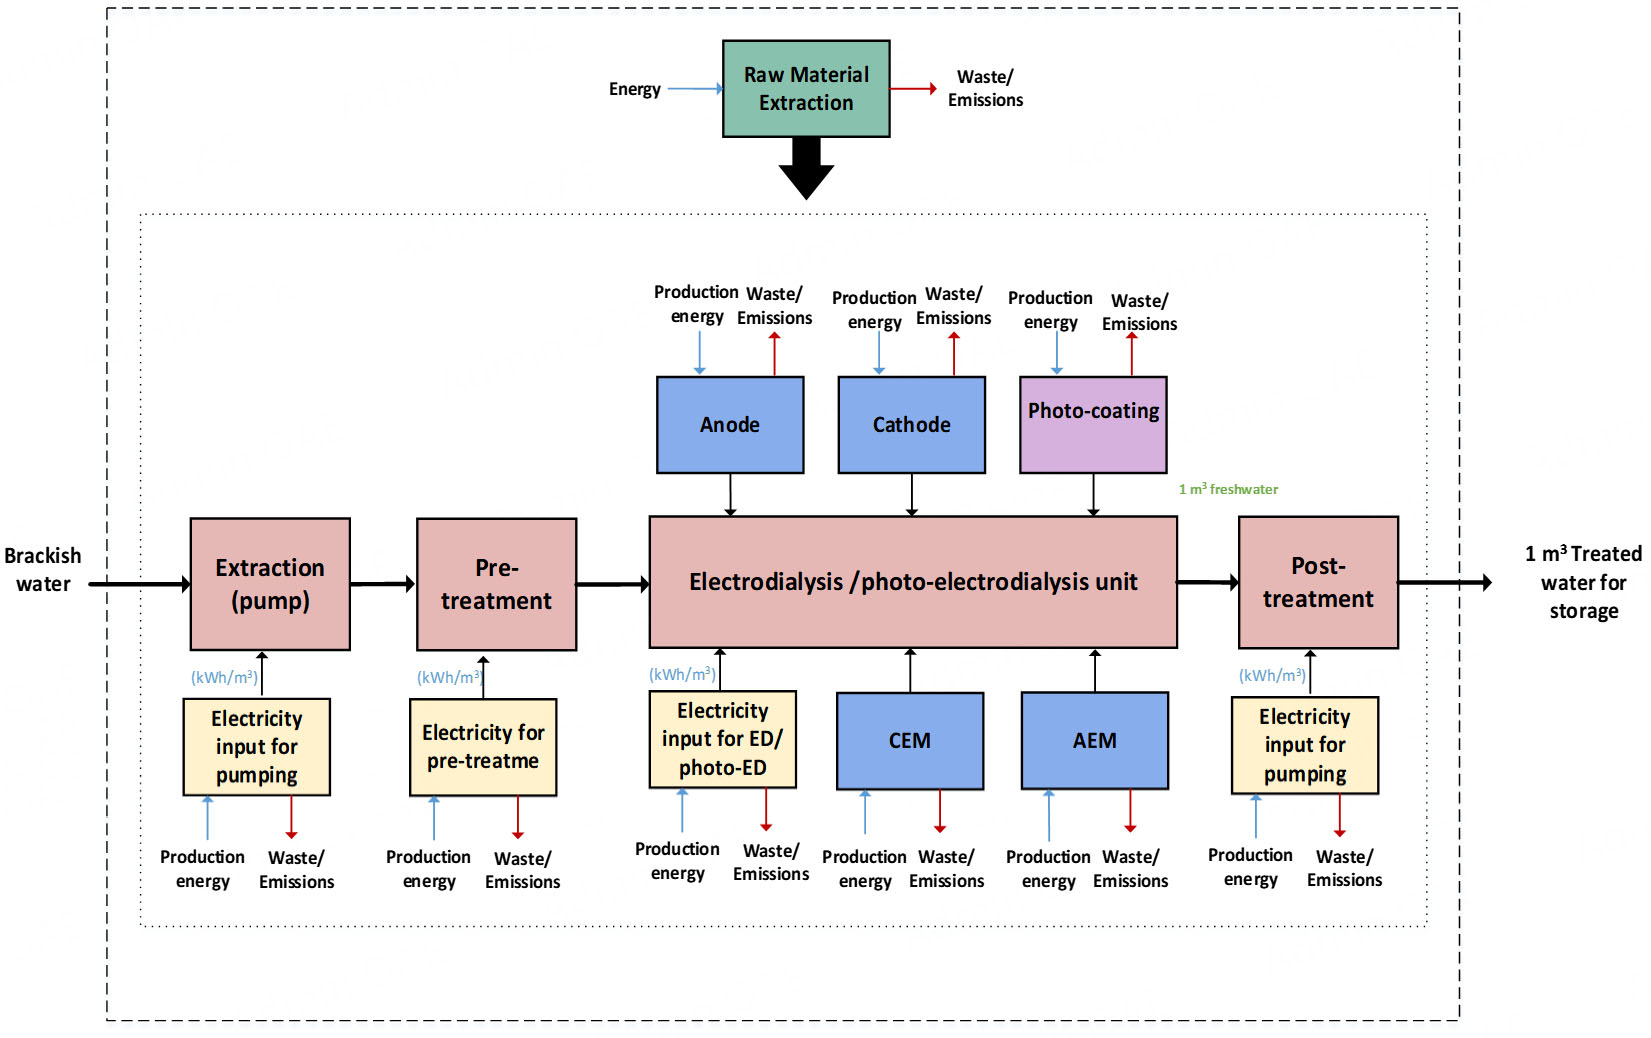
Figure 3. System boundary diagram for a cradle-to-gate LCA of freshwater production via photo-ED desalination.
INVENTORY ANALYSIS
This section presents the inventory analysis. The ED stack design is based on the experimental results detailed in our previous study[22]. For maintenance, the membranes and electrodes are replaced every 10 and 5 years, respectively[30,31]. Additionally, the photoactive material on the anode is recoated monthly[32]. The input datasets were obtained from various databases available in the LCA for Experts tool[27]. Since the analysis is conducted in Doha, Qatar, the Qatari electricity grid mix was applied for extraction, pre-treatment, photo-ED cell electricity, anode coating, post-treatment, and pumping processes. Other relevant datasets are listed in Table 1. Some materials, such as divinylbenzene, chloromethyl styrene, and chloroplatinic acid, are not available in the database; therefore, proxy reactions were used to represent their production. The inventory data for extraction, pre-treatment, and post-treatment processes were adapted from Biswas and Yek[26].
Inventory data for producing 1 m3 of freshwater via the photo-ED process
| Material | Value | Unit | Dataset |
| Photo-ED cell electricity | 4.31 | kWh/m3 | Electricity grid QA |
| Anode | |||
| Titanium | 6.85E-07 | kg/m3 water | Titanium sphera |
| Cathode | |||
| V4A steel | 1.16E-06 | kg/m3 water | Steel sheet 0.75 mm HDG |
| Housing | |||
| Polypropylene | 2.48E-05 | kg/m3 water | Polypropylene granulate |
| AEM monomer production | |||
| Polyvinyl chloride | 0.21 | kg/kg AEM | Polyvinyl chloride granulates |
| Divinylbenzenea | 0.043 | kg/kg AEM | - |
| Chloromethyl styreneb | 0.410 | kg/kg AEM | - |
| Benzoyl peroxide | 0.0080 | kg/kg AEM | Benzoyl peroxide |
| CEM monomer production | |||
| Styrene | 0.32 | kg/kg CEM | Styrene PlasticsEurope |
| Divinylbenzenea | 0.050 | kg/kg CEM | - |
| Benzoyl peroxide | 0.0094 | kg/kg CEM | Benzoyl peroxide |
| Pt/lr coating | |||
| Ruthenium | 2.37E-06 | kg/coating | Ruthenium primary route IPA |
| Chlorine | 2.09E-06 | kg/coating | Chlorine mix |
| n-butanol | 9.25E-05 | kg/coating | Butanol (n-butanol) |
| TiO2 or tetrabutyl titanate | 2.09E-06 | kg/coating | Titanium dioxide pigment (sulfate) |
| Iridium | 3.29E-06 | kg/coating | Iridium, primary route IPA |
| Chlorine | 9.10E-07 | kg/coating | Chlorine mix |
| Heating | 4.57E-05 | kWh/coating | Electricity grid mix Sphera |
| n-Butanol | 9.25E-05 | kg/coating | Butanol (n-butanol) |
| Chloroplatinic acidc | 4.68E-06 | kg/coating | - |
| Coating electricity | 4.57E-05 | kWh/coating | Electricity grid mix QA |
| CEM membrane production | |||
| CEM monomer | 2.64E-07 | kg/m3 water | - |
| Sulfuric acid | 1.39E-06 | kg/m3 water | Sulfuric acid at plant |
| AEM membrane production | |||
| AEM monomer | 2.64E-07 | kg/m3 water | - |
| Trimethylamine | 5.09E-07 | kg/m3 water | Methylamine (by-product di-, tri-methylamines) |
| Pre-treatment | |||
| Alum | 0.063 | kg/m3 | Alum |
| Energy | 0.020 | kWh/m3 | Electricity from grid QA |
| Post-treatment | |||
| Chlorine | 0.0074 | kg/m3 | Chlorine mix |
| Hydrated lime | 0.0160 | kg/m3 | Hydrated lime |
| Energy | 0.000040 | kWh/m3 | Electricity from grid QA |
| Extraction | |||
| Overall pumping | 0.032 | kWh/m3 | Electricity from grid QA |
Impact assessment
This section presents and discusses the results of the LCIA. Additionally, several sensitivity analyses are performed on operational electricity consumption, membrane replacement, and component lifetimes. The scalability of the system is also examined.
Results and discussion
Table 2 presents the total environmental impacts of the photo-ED desalination process for producing 1 m3 of freshwater. Figure 4 shows the percentage breakdown of the GWP impact category. The largest contributor to GWP is the electricity required to operate the photo-ED cell, accounting for 94% of the total. This is followed by chlorine used in the post-treatment step, contributing approximately 2%. The remaining inventories have a minimal influence on the overall GWP and are grouped under the "rest" category. This includes the production of membranes, electrodes, and casting materials. The software aggregates the inventories listed in Table 1 that individually have negligible contributions and reports them collectively as “rest”. A baseline study was also conducted on the same ED configuration without the photoactive anode coating, with results shown in Figure 4. Compared with photo-ED, the baseline case exhibited slightly lower GWP and EP values, by approximately 4% and 2 %, respectively. However, for the other impact categories, photo-ED showed higher values due to the additional burden from coating materials such as TiO2, iridium, and ruthenium. Despite this, the overall GWP remained lower for photo-ED because electricity dominates the environmental profile. Specifically, photo-ED consumed 4.31 kWh/m3 of electricity, compared with
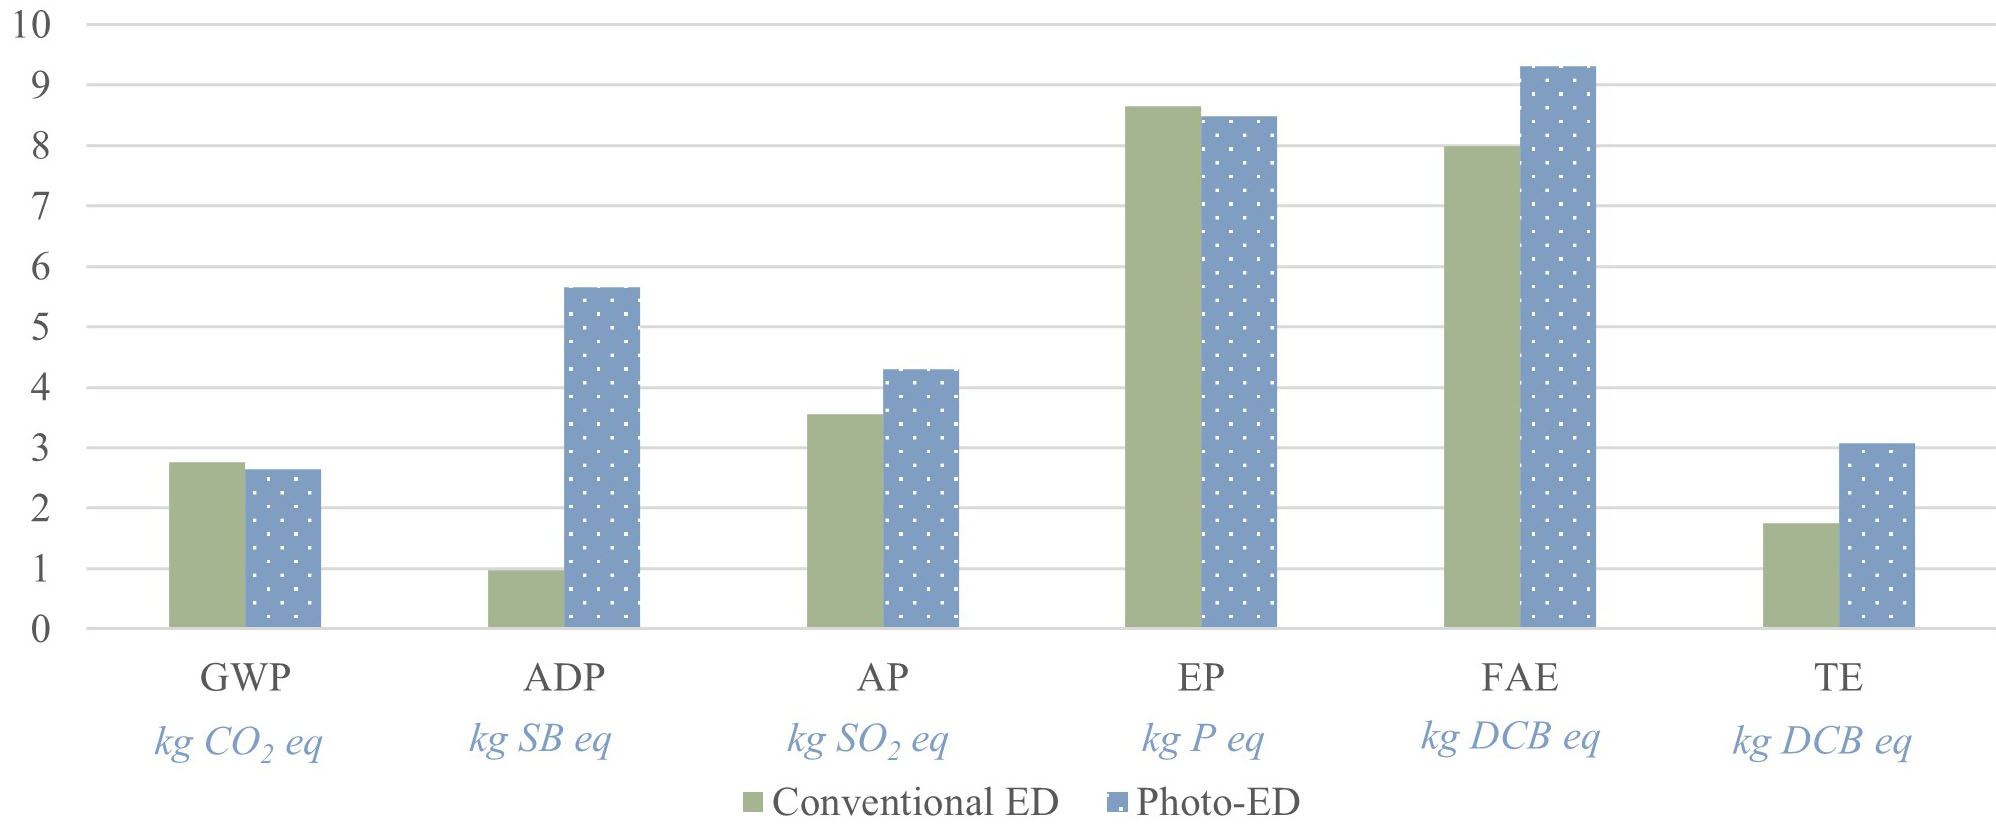
Figure 4. Comparison of conventional ED and photo-ED.
Overall environmental impact assessment results (CML, August 2016) for producing 1 m3 of freshwater using photo-ED desalination
| Environmental impact | Total | Unit |
| Global warming potential (GWP) | 2.64 | kg CO2 eq |
| Abiotic depletion potential (ADP) | 5.65 × 10⁻⁶ | kg SB eq |
| Acidification potential (AP) | 4.30 × 10⁻³ | kg SO2 eq |
| Eutrophication potential (EP) | 8.48 × 10⁻⁴ | kg P eq |
| Freshwater aquatic ecotoxicity (FAE) | 9.31 × 10⁻³ | kg DCB eq |
| Terrestrial ecotoxicity (TE) | 3.07 × 10⁻⁴ | kg DCB eq |
Figure 5 illustrates the breakdown of the remaining impact categories. For ADP, iridium used in the photo-anode coating contributes the most (around 40%), followed by ruthenium, platinum, and chlorine. For AP and EP, the electricity required to operate the photo-ED cell dominates, contributing roughly 73% and 93% of the total, respectively. Iridium, ruthenium, and platinum used in the coatings contribute more to AP than EP. Electricity also accounts for the highest share of impacts in FAE and TE. In FAE, electricity contributes about half of the total impact, while in TE it accounts for around 20%. Hydrated lime, used in the post-treatment step, is the major contributor to FAE but has little influence on the other categories. TE is almost equally affected by electricity use and chlorine from post-treatment, each contributing about 20%, with photo-coating materials each contributing around 15%. Overall, across nearly all categories except ADP, electricity use in the photo-ED cell represents the largest environmental burden. For ADP specifically, the coating materials for the photo-anode are the dominant contributors.
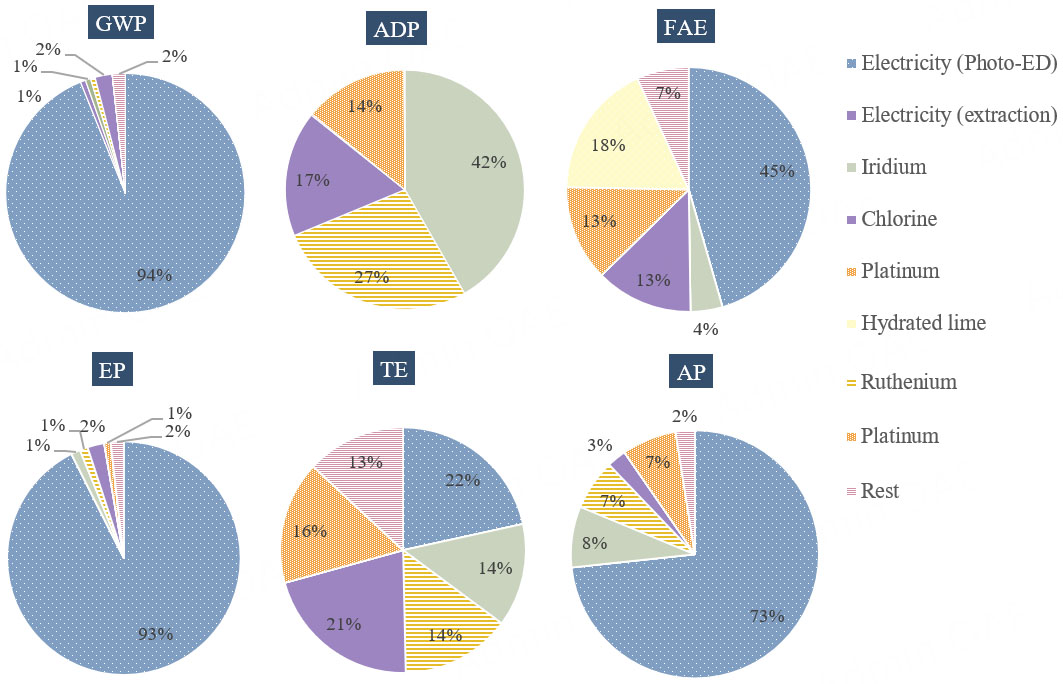
Figure 5. Percentage distribution of GWP, ADP, FAE, EP, TE, and AP impacts for the photo-ED desalination process.
Sensitivity analysis
Since the primary contributor to almost all environmental impacts was the electricity used for operating the photo-ED cell, a sensitivity analysis was performed on this input. Various renewable electricity sources were selected from the LCA for Experts software database[27], including electricity derived from solar PV, wind, solid biomass, geothermal, and biogas. Figure 6 presents the overall environmental impact results when different electricity sources are applied. The Qatari grid mix, which is heavily fossil fuel-based, exhibits high environmental impacts. In contrast, using alternative electricity sources significantly reduces these impacts. For the GWP, the base result with the Qatar grid mix was 2.65 kg CO2 eq/m3, which decreases to
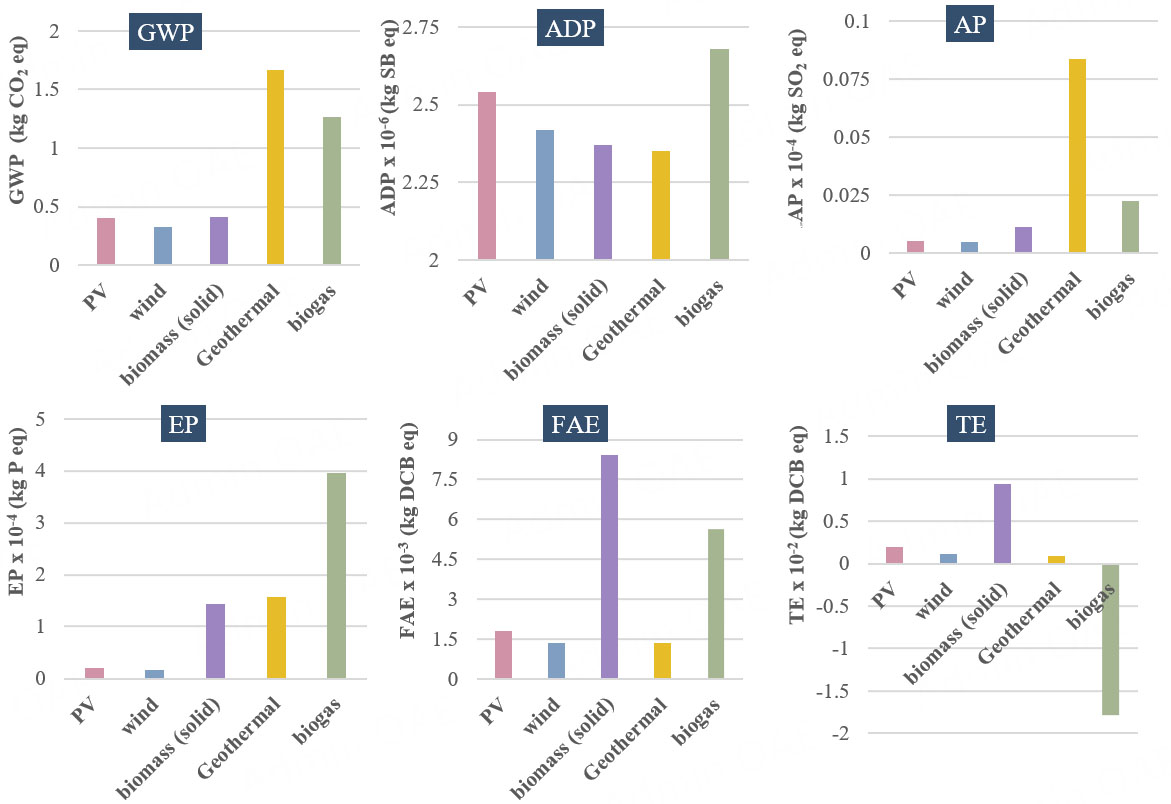
Figure 6. Sensitivity analysis of GWP, ADP, AP, EP, FAE, and TE using different renewable electricity sources for photo-ED cell operation.
Compared to literature values, the base-case environmental impacts in this study are slightly higher. For instance, Zhou et al.[36] reported a GWP of 1.15 kg CO2 eq/m3 for RO brackish water desalination, which is lower than in this study. However, our study uses the Qatari grid mix, which is primarily fossil fuel-based and thus has a higher environmental impact. When operational electricity is sourced from wind energy, yielding a GWP of 0.325 kg CO2 eq/m3, the results are more favorable. Similarly,
Figure 7 shows a sensitivity band analysis of GWP concerning membrane lifetime, electricity, and coating lifetime, with variations of ±20%. The analysis indicates that changes in operational electricity have the greatest impact on GWP. In comparison, GWP is less sensitive to membrane and coating lifetimes, likely due to the small scale of the ED system, where membrane and coating contributions are minor. Future studies could examine larger ED plant sizes and their sensitivity to membrane and coating lifetimes.
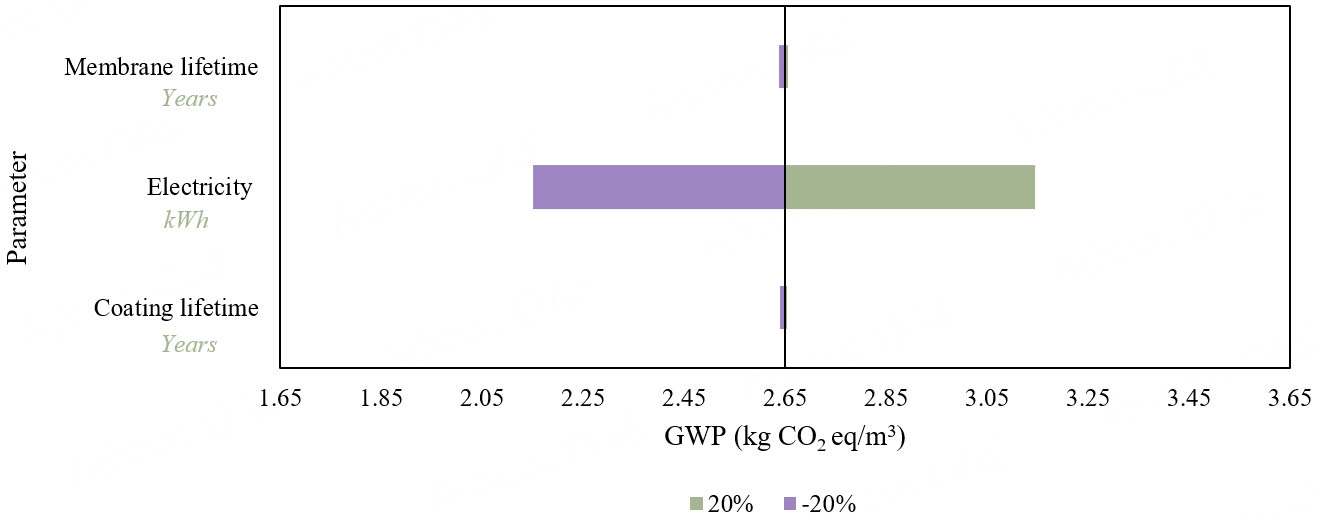
Figure 7. Sensitivity band analysis of GWP with respect to membrane lifetime, electricity, and coating lifetime.
Scalability
The current LCA is based on a lab-scale system, informed by experimental data. The total membrane area of the ED stack is 0.133 m2, with a capacity of 1 L/h. As the technology is at an early development stage, lab-scale LCA is an appropriate approach to identify environmental hotspots and guide future scale-up. Scaling up cannot be directly proportional due to changes in stack dimensions and membrane sizes, which require either pilot-scale setups or theoretical modeling. To account for scale effects, a sensitivity analysis was performed by varying the total membrane area to approximate different plant sizes [Figure 8]. Percentage variations were used as a simple scaling approach. For a pilot-scale plant with a total membrane area of
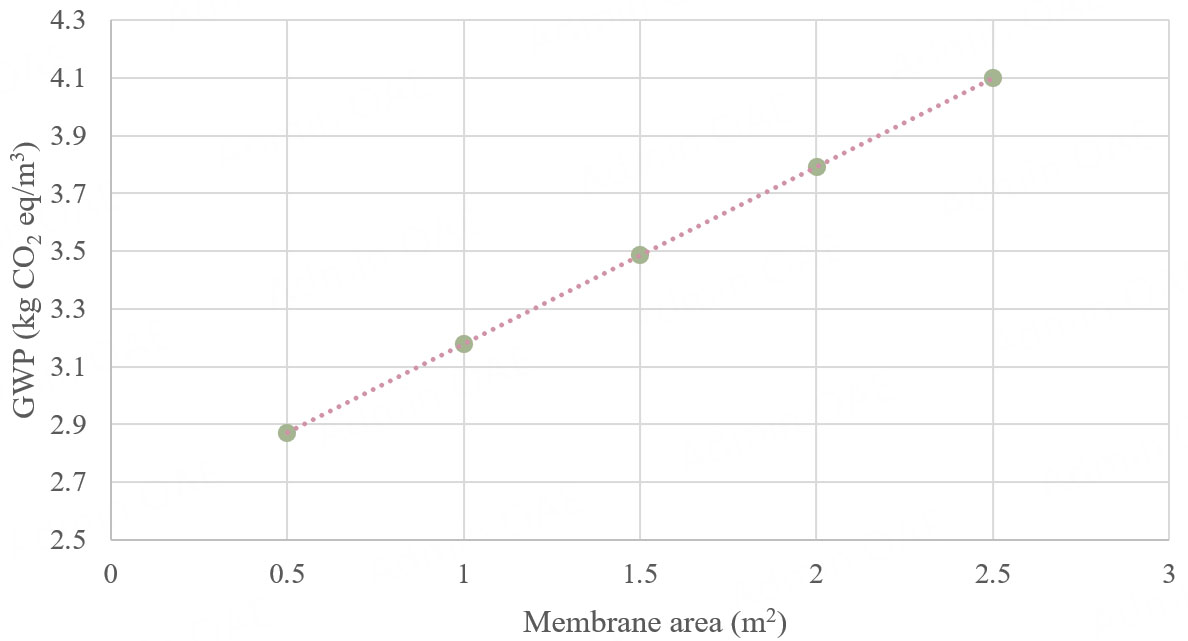
Figure 8. Sensitivity analysis of membrane area for larger-sized plants.
CONCLUSIONS
This study assessed the environmental sustainability of a photo-ED desalination system in Qatar using LCA. A cradle-to-gate analysis was conducted with a functional unit of 1 m3 of freshwater produced. The system boundaries included brackish water extraction, pre-treatment, post-treatment, and photo-ED cell operation. The LCIA results were as follows: 2.65 kg CO2 eq (GWP), 5.65 × 10⁻⁶ kg SB eq (ADP), 4.30 × 10⁻³ kg SO2 eq (AP), 8.48 × 10⁻⁴ kg P eq (EP), 9.31 × 10⁻³ kg DCB eq (FAE), and 3.07 × 10⁻³ kg DCB eq (TE). The dominant contributor to GWP was operational electricity for the photo-ED cell, accounting for 94% of the total. Electricity consumption also had the highest impact on all other categories except ADP, where iridium used in the photo-coating was the primary contributor. Platinum, ruthenium, and iridium in the photo-coating process also significantly contributed to FAE and TE. Sensitivity analysis indicated that the GWP could be substantially reduced by using renewable electricity sources. Wind power yielded the lowest GWP, at
DECLARATIONS
Acknowledgements
The authors acknowledge the support of Hamad Bin Khalifa University, Qatar Foundation, Qatar.
Authors’ contributions
Formal analysis, investigation, writing- original draft preparation: Mir, N.
Conceptualization, methodology, supervision, resources, writing- review and editing: Bicer, Y.
Availability of data and materials
The data that support the findings of this study are available from the corresponding author upon reasonable request.
Financial support and sponsorship
This publication was made possible by grant MME04-0529-230038 from the Qatar National Research Fund (a member of Qatar Foundation) and the Qatar Research, Development and Innovation Council.
Conflicts of interest
Both authors declared that there are no conflicts of interest.
Ethical approval and consent to participate
Not applicable.
Consent for publication
Not applicable.
Copyright
© The Author(s) 2025.
REFERENCES
1. Water scarcity. Available from: https://www.unicef.org/wash/water-scarcity [Last accessed on 27 Aug 2025].
2. Tashtoush, B.; Alyahya, W.; Al, Ghadi. M.; Al-Omari, J.; Morosuk, T. Renewable energy integration in water desalination: State-of-the-art review and comparative analysis. Appl. Energy. 2023, 352, 121950.
3. Boretti, A.; Rosa, L. Reassessing the projections of the world water development report. NPJ. Clean. Water. 2019, 2, 39.
4. Ghimire, U.; Sarpong, G.; Gude, V. G. Transitioning wastewater treatment plants toward circular economy and energy sustainability. ACS. Omega. 2021, 6, 11794-803.
5. Mir, N.; Bicer, Y. Thermodynamic modeling of a combined photo-electrodialysis-chloralkali system for sustainable desalination. Desalination 2021, 499, 114822.
6. Khan, M. I.; Zheng, C.; Mondal, A. N.; et al. Preparation of anion exchange membranes from BPPO and dimethylethanolamine for electrodialysis. Desalination 2017, 402, 10-8.
7. Patel, S. K.; Lee, B.; Westerhoff, P.; Elimelech, M. The potential of electrodialysis as a cost-effective alternative to reverse osmosis for brackish water desalination. Water. Res. 2024, 250, 121009.
8. Mir, N.; Bicer, Y. Integration of electrodialysis with renewable energy sources for sustainable freshwater production: a review. J. Environ. Manag. 2021, 289, 112496.
9. Gonzalez, A.; Grágeda, M.; Ushak, S. Assessment of pilot-scale water purification module with electrodialysis technology and solar energy. Appl. Energy. 2017, 206, 1643-52.
10. Campione, A.; Cipollina, A.; Calise, F.; Tamburini, A.; Galluzzo, M.; Micale, G. Coupling electrodialysis desalination with photovoltaic and wind energy systems for energy storage: dynamic simulations and control strategy. Energy. Convers. Manag. 2020, 216, 112940.
11. He, W.; Wright, N. C.; Amrose, S.; Buonassisi, T.; Peters, I. M.; Winter, A. G. Preliminary field test results from a photovoltaic electrodialysis brackish water desalination system in rural India; 2018.
12. Rheinländer, J.; Geyer, D. Photovoltaic reverse osmosis and electrodialysis. Green. Energy. Technol. 2009, 189-211.
13. Malek, P.; Ortiz, J.; Schulte-Herbrüggen, H. Decentralized desalination of brackish water using an electrodialysis system directly powered by wind energy. Desalination 2016, 377, 54-64.
14. Veza, J. M.; Peñate, B.; Castellano, F. Electrodialysis desalination designed for wind energy (on-grid tests). Desalination 2001, 141, 53-61.
15. Liang, M.; Karthick, R.; Wei, Q.; et al. The progress and prospect of the solar-driven photoelectrochemical desalination. Renew. Sustain. Energy. Rev. 2022, 155, 111864.
16. Bensaadi, S.; Nasrallah, N.; Amrane, A.; et al. Dialysis and photo-electrodialysis processes using new synthesized polymeric membranes for the selective removal of bivalent cations. J. Environ. Chem. Eng. 2017, 5, 1037-47.
18. Hamane, D.; Arous, O.; Kaouah, F.; Trari, M.; Kerdjoudj, H.; Bendjama, Z. Adsorption/photo-electrodialysis combination system for Pb2+ removal using bentonite/membrane/semiconductor. J. Environ. Chem. Eng. 2015, 3, 60-9.
19. Cherif, A. Y.; Arous, O.; Amara, M.; Omeiri, S.; Kerdjoudj, H.; Trari, M. Synthesis of modified polymer inclusion membranes for photo-electrodeposition of cadmium using polarized electrodes. J. Hazard. Mater. 2012, 227-8, 386-93.
20. Khiter, A.; Arous, O.; Nasrallah, N.; et al. Removal of lead by membrane photo-electrolysis. Sep. Purif. Technol. 2025, 378, 134565.
21. Chaurasiya, A.; Budania, Y.; Shah, G.; Mishra, A.; Singh, S. Carbon-based electrodes for photo-bio-electrocatalytic microbial fuel and electrolysis cells: advances and perspectives. Mater. Horiz. 2025. Online ahead of print.
22. Mir, N.; Yuzer, B.; Bicer, Y. Photo-electrodialysis for brackish water desalination: a life cycle sustainability assessment from experimental insights. Energy. Technol. 2025, 2402079.
23. Elsaid, K.; Kamil, M.; Sayed, E. T.; Abdelkareem, M. A.; Wilberforce, T.; Olabi, A. Environmental impact of desalination technologies: a review. Sci. Total. Environ. 2020, 748, 141528.
24. Finnveden, G.; Hauschild, M. Z.; Ekvall, T.; et al. Recent developments in life cycle assessment. J. Environ. Manag. 2009, 91, 1-21.
25. Xu, J.; Wang, M.; Xu, G.; Sokolova, E.; Vail, T.; Song, D. A critical review of ISO standards for seawater desalination: classification, applications, and future development. Sep. Purif. Technol. 2025, 367, 132898.
26. Biswas, W. K.; Yek, P. Improving the carbon footprint of water treatment with renewable energy: a Western Australian case study. Renewables 2016, 3, 36.
27. Mueller, K. E.; Thomas, J. T.; Johnson, J. X.; Decarolis, J. F.; Call, D. F. Life cycle assessment of salinity gradient energy recovery using reverse electrodialysis. J. Ind. Ecol. 2021, 25, 1194-206.
28. Rasmi, K.; Vanithakumari, S.; George, R. P.; Kamachi, Mudali. U. Performance evaluation of platinum nanoparticle-coated titanium electrodes. Mater. Perform. 2017, 56, 48-52.
29. ISO 14040:2006. Environmental management - Life cycle assessment - Principles and framework. Available from: https://www.iso.org/standard/37456.html [Last accessed on 27 Aug 2025].
30. Mueller, K. E.; Thomas, J. T.; Johnson, J. X.; DeCarolis, J. F.; Call, D. F. Life cycle assessment of salinity gradient energy recovery using reverse electrodialysis. J. Ind. Ecol. 2021, 25, 1194-1206.
31. Veerman, J.; Saakes, M.; Metz, S. J.; Harmsen, G. J. Reverse electrodialysis: evaluation of suitable electrode systems. J. Appl. Electrochem. 2010, 40, 1461-74.
32. Mudali U, Raju V, Dayal R. Preparation and characterisation of platinum and platinum–iridium coated titanium electrodes. J. Nucl. Mater. 2000, 277, 49-56.
33. Zeynali, M. E.; Abedini, H.; Sadri, H. R. Effect of operating conditions on divinylbenzene production in diethyl benzene dehydrogenation reactor. Iran. J. Chem. Chem. Eng. 2018, 15. Available from: https://www.ijche.com/article_80773.html [Last accessed on 1 Sep 2025].
34. Camps, M.; Chatzopoulos, M.; Monthéard, J. Chloromethylstyrene: synthesis, polymerization, transformations, applications. J. Macromol. Sci. Part. C. 1982, 22, 343-407.
35. Chloroplatinic Acid Formula: Structure, Preparations and Properties. Available from: https://www.toppr.com/guides/chemistry-formulas/chloroplatinic-acid-formula/ [Last accessed on 27 Aug 2025].
36. Zhou, J.; Chang, V. W. C.; Fane, A. G. Environmental life cycle assessment of brackish water reverse osmosis desalination for different electricity production models. Energy. Environ. Sci. 2011, 4, 2267-78.
Cite This Article
How to Cite
Download Citation
Export Citation File:
Type of Import
Tips on Downloading Citation
Citation Manager File Format
Type of Import
Direct Import: When the Direct Import option is selected (the default state), a dialogue box will give you the option to Save or Open the downloaded citation data. Choosing Open will either launch your citation manager or give you a choice of applications with which to use the metadata. The Save option saves the file locally for later use.
Indirect Import: When the Indirect Import option is selected, the metadata is displayed and may be copied and pasted as needed.
About This Article
Copyright

Data & Comments
Data
0


Comments
Comments must be written in English. Spam, offensive content, impersonation, and private information will not be permitted. If any comment is reported and identified as inappropriate content by OAE staff, the comment will be removed without notice. If you have any queries or need any help, please contact us at [email protected].