


Green finance structure and green total factor productivity of energy firms
 0
0 Abstract
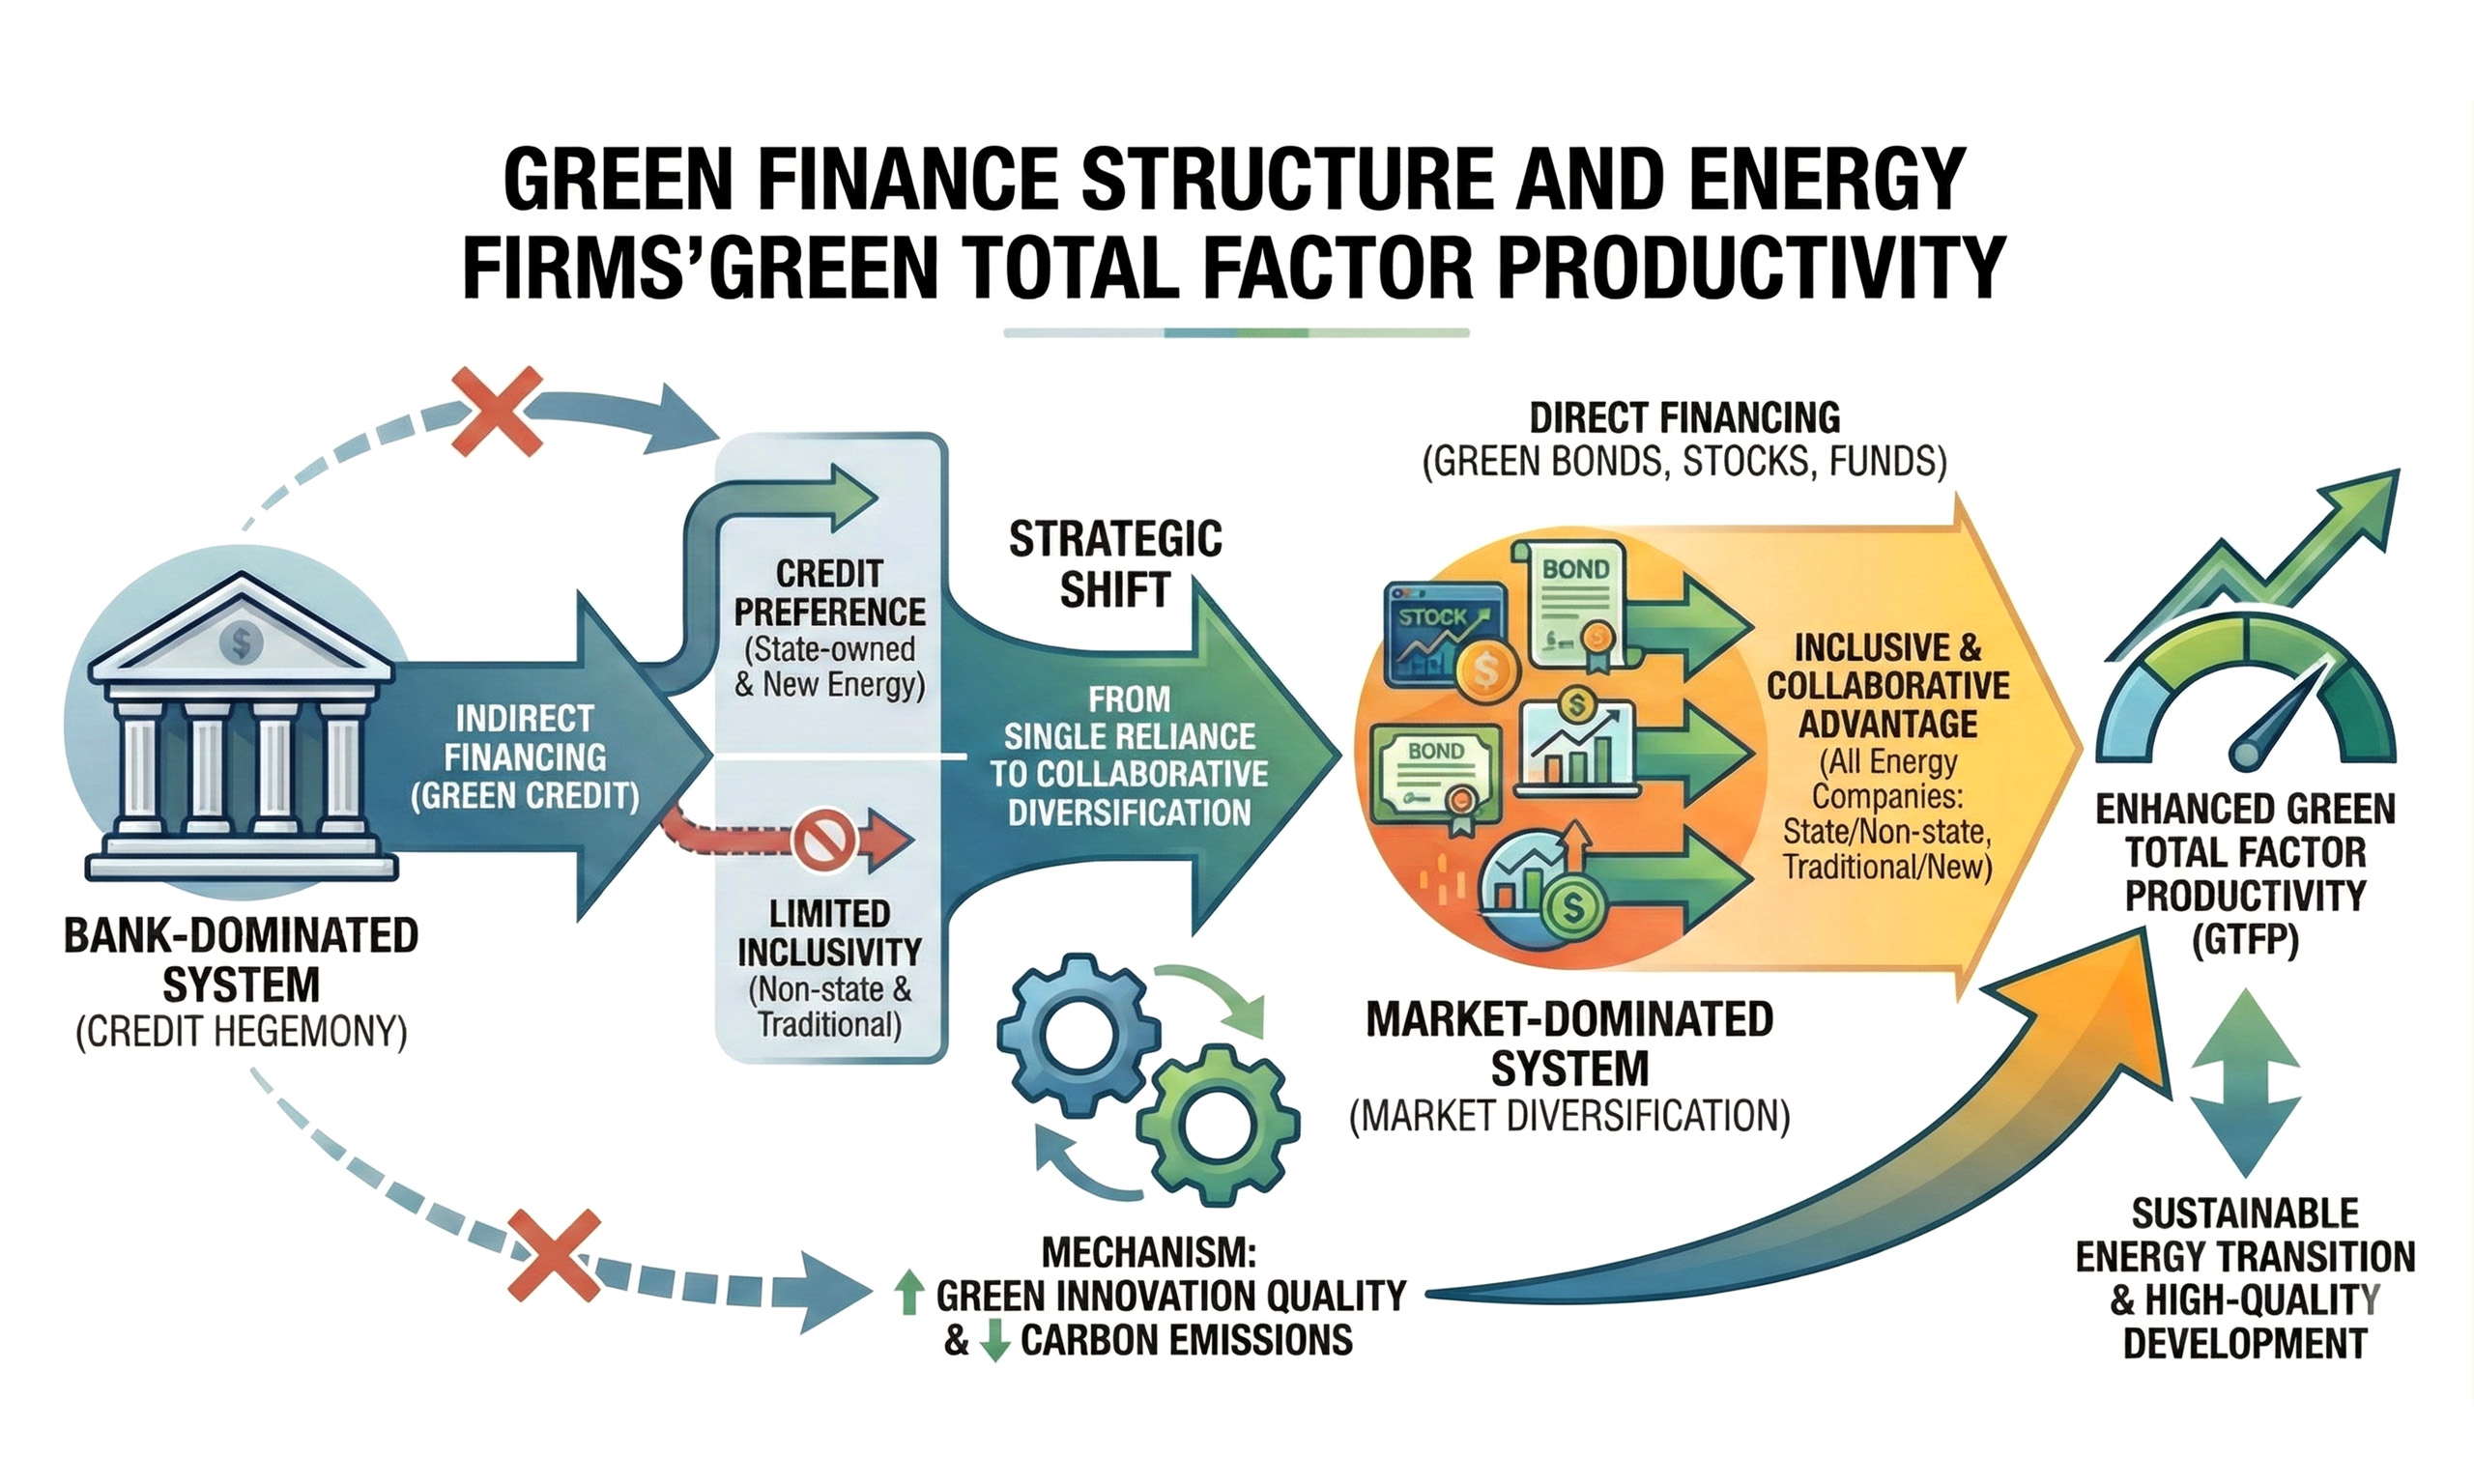
Advancing the energy sector’s sustainable transformation requires structural optimization of the green financial system. Differentiating between bank- and market-dominated systems, this study categorizes green financial instruments into indirect financing (green credit) and direct financing (green bonds, green stocks, and green funds). It examines pathways to enhance green total factor productivity (GTFP) of energy firms by shifting from credit hegemony to market diversification. The findings indicate that: (1) Green finance significantly promotes GTFP in energy firms; however, the effect of market-dominated direct financing is notably stronger than that of bank-dominated indirect financing, revealing the advantages of market diversification; (2) The positive effect of green credit (indirect financing) is limited to state-owned enterprises and the new energy sector, showing a clear credit preference. In contrast, direct financing mitigates ownership discrimination and benefits all energy firms, especially non-state-owned and new energy companies, demonstrating greater market inclusiveness; (3) Mechanism tests show that green finance enhances GTFP of energy firms by improving green innovation quality and reducing carbon emissions. This study clarifies the logic by which green finance drives transformation of energy firms, providing a scientific basis for policy design that shifts from reliance on a single credit channel toward incentivizing collaboration among diverse market participants.
Keywords
INTRODUCTION
Transitioning toward green, high-quality development is a foundational strategy for China’s modern economy. General Secretary Xi Jinping has emphasized that innovative productive capabilities are inherently sustainable, necessitating an accelerated transition[1]. This shift depends heavily on the high-quality development of the energy sector, a critical pillar of economic and social progress. Transforming energy systems through low-carbon, eco-friendly pathways and technological innovation is vital for fostering new productive forces[2,3]. However, the advancement of these new productive forces, driven by renewable energy growth and technological progress, is expected to generate significant investment and financing gaps that exceed government fiscal capacity[4]. Therefore, financial support mechanisms, particularly green finance, have become essential for the efficient allocation of resources to support the energy sector’s low-carbon transformation[5].
The recent evolution of green finance has reshaped China’s financial structure. Energy firms now access diverse financing channels beyond traditional bank loans, including green bonds, stocks, and funds in capital markets[6-8]. As a primary determinant of resource allocation efficiency, financial structure markedly influences corporate financing behavior[9]. Existing research identifies two main financial structures: market-dominated direct financing, particularly equity financing, which meets substantial funding demands driven by innovation[10,11], and bank-dominated indirect financing, which offers advantages in risk management[12,13]. Despite the rise of diversified green financing channels, previous research often treats “green finance” as a uniform construct, overlooking the functional distinctions among financial structures within the green finance system[14]. Because their economic outcomes depend on how these structures shape capital allocation and corporate governance, understanding their differential impacts is crucial for China’s energy transition.
To address this gap and provide targeted policy guidance, this study examines the differential impacts of financing modes on green total factor productivity (GTFP) in China’s energy sector. Categorizing green financial instruments into market-dominated direct financing (green bonds, green stocks, and green funds) and bank-dominated indirect financing (green credit), this study makes three key contributions. First, it provides empirical evidence on the comparative effectiveness of these financing structures. Second, heterogeneity analysis reveals how enterprise ownership and industry type influence the effectiveness of financing structures. Third, mechanism tests identify the specific channels through which green finance enhances corporate GTFP. These insights help policymakers optimize green finance structures to improve resource allocation efficiency and environmental outcomes in the green economy.
LITERATURE REVIEW
Green finance institutionalizes sustainable development goals within capital deployment strategies and encompasses financial activities that promote environmental governance and efficient resource utilization[15-18]. Using financial instruments such as green credit, green bonds, green stocks, and green funds, it directs enterprises toward energy saving, emission reduction, and sustainable development objectives, ultimately balancing economic growth with environmental protection[19,20]. Research on the policy effects of green finance primarily focuses on two aspects. First, at the macroeconomic level, green finance drives the development of green technologies, thereby enhancing resource utilization efficiency and reducing energy intensity[21-23]. As China’s most established green finance product, green credit fosters carbon reduction and supports the green transition of energy firms[24]. One study, using a novel index, shows that green finance significantly lowers carbon emissions of electricity firms[25], improves total factor carbon productivity, and reduces carbon emission intensity[26,27]. Second, green finance has a significant impact on the high-quality development of micro-level enterprises. Studies show that green finance mitigates corporate “greenwashing” behaviors[28,29], enhances green innovation capabilities of firms[30], and drives green transformation[31]. Specifically, the issuance of green bonds eases financing constraints[32], promotes the growth of green innovation capabilities[33,34], and supports high-quality enterprise development[35].
The impact of green finance on micro-level enterprise development is closely linked to total factor productivity (TFP). Most studies agree that green finance enhances firm-level TFP[36]. Research further indicates that green bonds sustainably promote TFP growth[37]. Although TFP is a key indicator of economic growth, it often ignores resource and environmental constraints, making it an incomplete measure of high-quality enterprise development. Unlike traditional productivity measures, GTFP has emerged as a better metric that balances environmental stewardship with economic performance to evaluate high-quality growth[20]. Existing research indicates that green finance significantly enhances regional and industrial GTFP[38-40].
Recent studies have focused on how green finance affects heterogeneous enterprises. An analysis of Chinese A-share-listed firms (2010-2023) finds that green finance significantly affects the GTFP of heavily polluting and non-state-owned enterprises[41]. Furthermore, an emerging research frontier suggests that green finance is a core instrument for fostering “new quality productive forces” by directing capital toward renewable energy and energy storage technology innovation[42]. While bank-dominated green credit remains foundational, recent literature emphasizes the growing “greenium” and the superior efficiency of market-dominated instruments, such as green bonds, in promoting energy efficiency[35,43].
Although recent research explores the impact of green finance on heterogeneous enterprises and “new quality productive forces”, two significant limitations remain. First, existing studies tend to examine green finance from a scale perspective, neglecting the nuanced effects of its structural composition. However, the core constraint on high-quality growth lies not in the quantity of financial resources, but in financial structure and its underlying dynamics[44]. Financial systems, broadly categorized as market-dominated or bank-dominated, influence capital allocation through direct and indirect financing channels[45]. While market-dominated structures enhance macroeconomic resilience and optimize corporate investment efficiency[46], their specific impact on energy sector GTFP remains underexplored. Therefore, examining how green finance drives GTFP of energy firms from a financial structure perspective effectively addresses this research gap. Second, by distinguishing between direct and indirect green financing, this study addresses a “structural blind spot” in the current literature. We categorize green financial instruments into market-dominated direct financing and bank-dominated indirect financing to examine their differential impacts on corporate GTFP, thereby introducing a new analytical framework for understanding the relationship between green finance and high-quality enterprise development. This framework provides important implications for policymakers and corporate decision-makers pursuing sustainable development.
THEORETICAL BACKGROUND
A significant relationship between green finance and GTFP can be explained through two primary dimensions. First, with regard to resource allocation, green finance uses various financial instruments to reallocate resources from polluting firms to green enterprises, thereby increasing funding for the latter and accelerating green sector development[47]. An effective financial system alleviates external financing constraints of firms, thereby enhancing TFP and fostering high-quality development[48]. Second, regarding ecological stewardship and economic prosperity, green finance incentivizes micro-level entities to engage in environmentally friendly practices while pursuing economic growth[20]. This engagement improves resource utilization efficiency[21], reduces pollution emissions, and increases the focus on environmentally sustainable investments, all of which enhance corporate GTFP. Given these theoretical considerations, we propose the following hypothesis:
Hypothesis 1: Green finance contributes to corporate GTFP.
Optimal financial structure theory emphasizes alignment between the financial system and the real economy. Thus, “optimal financial structure” refers to the composition of various financial institutional arrangements within the financial system. The impacts of market-dominated direct financing and bank-dominated indirect financing on corporate financing, innovation, and growth are well documented[49], with research confirming that an optimal financial structure aligns with the real economy across firms of varying sizes[50,51]. The influence of these structures varies along two dimensions. First, compared with market-dominated direct financing, bank-dominated indirect financing has inherent limitations. To mitigate risk, banks impose higher credit requirements on green loan seekers and rely heavily on “information symmetry”[52]. In cases of high risk or information asymmetry between enterprises and banks, indirect financing, such as green loans, may fail to reach genuine green projects and industries, thereby limiting the potential benefits of green finance[53]. Furthermore, bank-dominated indirect financing weakens the link between fund supply and demand by relying on intermediaries, which can reduce capital allocation and utilization efficiency. Second, unlike bank-dominated indirect financing, market-dominated direct financing provides long-term capital with greater flexibility in fund utilization and risk sharing. This flexibility supports innovative, research-intensive, and high-risk industries, resulting in more efficient capital use and optimal resource allocation[54]. Based on this, we propose the following hypothesis:
Hypothesis 2: Firms benefit more in terms of GTFP from market-dominated direct financing than from traditional bank-dominated channels.
Green finance policies motivate corporate green innovation through both incentive and constraint mechanisms, thereby promoting high-quality economic development supported by green innovation[32]. Green credit stimulates green innovation by enhancing corporate investment efficiency and reducing green agency costs[55]. Similarly, green bonds facilitate increased R&D investment of firms while lowering agency costs, attracting investor interest, and improving green innovation capabilities[56]. Furthermore, pilot zones for green finance reform and innovations boost both the quantity and quality of corporate green technological innovation, exerting a long-term positive impact on enterprise high-quality development[57]. Moreover, green technological innovation enhances corporate GTFP by reducing production costs and improving overall corporate performance[58].
Green finance policy is also a powerful instrument for mitigating carbon emission intensity and achieving significant emission reductions[59]. As primary conduits for carbon reduction efforts, enterprises are incentivized to minimize pollutant emissions[60], enhance energy efficiency, and optimize production processes to meet green lending criteria and secure financial support[61]. Moreover, green credit reduces carbon emissions, significantly improves total carbon productivity, and decreases carbon emission intensity[62]. Based on this, we propose the following hypotheses:
Hypothesis 3a: Green finance enhances corporate GTFP by stimulating corporate green innovation.
Hypothesis 3b: Green finance improves corporate GTFP by reducing carbon emissions.
METHODS
Statistical analysis
To verify the causal relationship between the Green Finance Development Index (G-Finance) and GTFP, we employed a two-way fixed-effects model incorporating both time and firm-specific effects. A mediation effect model was used to test whether corporate green innovation and carbon emissions mediate the relationship between green finance and corporate GTFP. Endogeneity concerns were addressed through a difference-in-differences robustness test. In addition, an entropy-weighting approach was used to construct a direct financing index for analyzing green financial structures. All statistical analyses were performed using Stata 16.0.
Research sample and data sources
The sample consists of Chinese energy firms listed between 2010 and 2021. To ensure data rigor and representativeness, the final sample was determined through a two-stage identification and filtering process. First, industry classification was used to distinguish new energy firms from traditional energy firms. (1) Based on Eastmoney’s new energy concept segment (https://www.eastmoney.com/), 187 new energy companies were selected; (2) Traditional energy industry classification follows Yu et al. and the “Guidance on Industry Classification for Listed Companies”[63], covering the mining sector - specifically coal mining and washing (B06), and oil and gas extraction (B07) - as well as the electricity, heat, gas, and water production and supply sectors, such as electric power and heat production and supply (D44), gas production and supply (D45), and companies in the manufacturing sector, particularly petroleum refining, coking, and nuclear fuel processing (C25). Second, to ensure the reliability and robustness of the findings, the combined pool of 328 energy firms underwent a rigorous screening process as follows: (1) ST and *ST firms were excluded due to financial irregularities or other anomalies that could compromise data validity; and (2) observations with missing values for key variables, including green credit, green bonds, green stocks, green funds, and corporate GTFP, were removed. This resulted in a final balanced panel comprising 328 enterprises (187 new energy firms and 141 traditional energy firms), totaling 2,762 valid observations.
Control variable data were obtained from the China Securities Market and Accounting Research (CSMAR) Database. Corporate GTFP and green finance data were compiled from multiple authoritative sources, including the China Statistical Yearbook, the China City Statistical Yearbook, the China Environmental Statistical Yearbook, CSMAR, and the Wind Database. Data on green innovation, the primary mediating variable in this study, were retrieved from the China Research Data Services Platform (CNRDS). Moreover, corporate carbon emission data were primarily extracted from annual reports and sustainability reports of publicly listed companies.
Variable setting and measurement
Dependent variable
The dependent variable is corporate GTFP (GTFP). Unlike patent-based measures of green innovation, GTFP evaluates input-output efficiency under environmental constraints. Following Li and Wang, this study uses the Malmquist-Luenberger productivity index integrated with a slacks-based measure directional distance function to assess corporate GTFP[64]. We develop a systematic framework for measuring corporate GTFP using the following input-output indicators:
(1) Input factors: Labor is measured by the total number of employees at the firm level; capital input is measured by the net value of fixed assets; and energy input is measured by allocating city-level industrial electricity consumption based on each firm’s share of total urban employment.
(2) Desirable outputs: A firm’s expected output is measured by operating revenue, which reflects its economic performance.
(3) Non-desirable outputs: These include environmental pollutants such as sulfur dioxide, wastewater, and particulate matter (soot). Because firms do not directly report these emissions, they are estimated by multiplying city-level total emissions of each pollutant by the firm’s proportion of total urban employment. This approach assumes that pollutant generation is correlated with employment scale, providing a reasonable proxy for a firm’s environmental burden.
Independent variable
The independent variable is G-Finance. Because there is no standardized metric for green finance evaluation, some studies use proxy indicators such as green credit. However, this approach does not fully capture the overall development of green finance. This study constructs a provincial-level G-Finance index by integrating the main components of China’s green finance system while considering data availability. The selected instruments - green credit, green bonds, green stocks, and green funds - are weighted using the entropy weight method to ensure a systematic and reliable evaluation[21].
Green credit represents bank-dominated indirect financing, whereas the other components represent market-dominated direct financing. Specifically, green credit is measured as the ratio of non-high-energy-consuming industry interest expenditures to total industrial interest expenditures in each province[65]. Green bonds are measured as the ratio of each province’s green bond issuance to total bond issuance[30]. Green stocks are measured as the proportion of the total market capitalization of environmentally friendly enterprises in each province to the total market capitalization of A-shares. Finally, green funds are measured as the ratio of the total market capitalization of green funds in each province to the total market capitalization of all funds.
Mediating variables
This study examines two mechanisms: green innovation and carbon emissions. Green patent research and development is a widely used and effective measure of green innovation[66]. This study uses annual green patent applications to represent green innovation (Patent). Corporate carbon emissions (Carbon) are calculated following the methodology of Wang et al.[67]. Firms are classified based on their disclosure practices. The first category includes firms that directly disclose total carbon emissions in their reports. The second category includes firms that do not directly disclose annual carbon emissions[68]. For these firms, total carbon emissions are estimated based on fossil energy, electricity, and thermal energy consumption[69,70]. Following the IPCC (2006) framework and the National Development and Reform Commission (NDRC) guidelines, total carbon dioxide emissions (E) for each firm are calculated as follows:
where AD represents resource consumption, and EF represents emission factors. For Scope 1 emissions, AD is derived from fossil fuel consumption multiplied by their average low calorific values provided in the NDRC guidelines. For Scope 2 emissions, AD includes purchased electricity and heat. EF are calibrated using official parameters. For fossil fuels, we adopt NDRC default emission factors. For purchased electricity, we apply regional average grid emission factors from the National Center for Climate Change Strategy and International Cooperation. For heat consumption, we use a standardized factor of 0.11CO2/GJ. Finally, this study applies a natural logarithm transformation to total carbon emissions.
Control variables
This study incorporates several firm-level control variables to account for additional economic factors affecting corporate GTFP, ensuring analytical comprehensiveness and clarity. Specifically, the control variables include firm age (Age), firm size (Size), revenue growth rate (Growth), return on total assets (ROA), return on invested capital (ROIC), and core business revenue growth rate (Income)[64,71]. To enhance regression robustness, the model includes firm-level (Firm) and year (Year) fixed effects. Table 1 presents the variable definitions.
Description of variables
| Category | Variable | Symbol | Define |
| Dependent variable | Corporate green total factor productivity | GTFP | SBM-ML index |
| Independent variable | Green finance | G-Finance | The entropy-weighting method is applied to assess four components of green finance - credit, bonds, stocks, and funds |
| Direct financing | D-finance | Using the entropy-weighting method, we evaluate four dimensions of green finance: credit, bonds, stocks, and funds | |
| Indirect financing (green credit) | I-finance (credit) | Interest expenditures of non-six high energy-consuming industries/total industrial interest expenditures | |
| Green bond | Bond | The total amount of green bond issuances/the total amount of all bond issuances | |
| Green fund | Fund | Green fund total market capitalization/Total market capitalization of all funds | |
| Green stock | Stock | Market capitalization of environmentally friendly enterprises/Total market capitalization of A-shares | |
| Mediating variables | Green finance | Patent | The quantity of green patent applications |
| Corporate carbon emissions | Carbon | The natural logarithm of carbon emissions | |
| Control variables | Firm age | Age | Observation years of the sample - year of establishment of the firm |
| Firm size | Size | ln(total assets) | |
| Revenue growth rate | Growth | (The current period’s operating revenue - the previous period’s operating revenue)/the previous period’s operating revenue | |
| Return on total assets | ROA | Net profit/average total assets | |
| Return on invested capital | ROIC | (Net profit + finance costs)/(total assets - current liabilities + notes payable + short-term loans + current portion of non-current liabilities) | |
| Revenue growth rate of core business operations | Income | (The current period’s core business revenue - the previous period’s core business revenue)/the previous period’s core business revenue |
Model specification
Based on the preceding analysis, a significant causal relationship exists between the G-Finance and GTFP. Consequently, we develop a two-way fixed-effects model incorporating both time and enterprise-specific effects for further investigation[43]. The model specification is as follows:
where i denotes the listed company and t denotes the year (t = 2010, 2011, ..., 2021). The variables include the G-Finance, corporate GTFP, and a set of control variables (control). Furthermore, Year captures time fixed effects, Firm captures firm-specific fixed effects, and ε represents the random disturbance term. A statistically significant positive coefficient for G-Finance would indicate that green finance meaningfully enhances corporate GTFP, thereby supporting Hypothesis 1.
Building on Equation (2), this study develops Equations (3-6) to examine the mechanism through which green finance affects corporate GTFP, thereby testing Hypothesis 3a and 3b.
where Patent is measured through green patenting activities of firms in Equations (3) and (4). Specifically, the overall level of green innovation (Total) is the aggregate of green invention patents and green utility model patents. The number of green invention patent applications (Inva) measures green innovation quality, whereas the number of green utility model patent applications (Uma) is used as a proxy for green innovation quantity. Carbon represents the carbon emissions in Equations (5) and (6). The meanings of other variables remain consistent with those mentioned above.
Descriptive statistics
Table 2 presents the descriptive statistical results. GTFP values range from 0.800 to 1.148. G-Finance (0.016-0.649) indicates significant regional disparities in green finance development across China. Direct financing (D-Finance) ranges from 0 to 0.666. Regarding specific green finance instruments, green credit ranges from 0.094 to 0.800, green bonds from 0 to 0.893, green stocks from 0 to 0.072, and green funds from 0.131 to 0.861.
Descriptive statistics of key variables
| Variables | Observation | Mean | Std. Dev. | Minimum | Maximum |
| GTFP | 2762 | 0.981 | 0.094 | 0.800 | 1.148 |
| G-Finance | 2762 | 0.098 | 0.077 | 0.016 | 0.649 |
| D-Finance | 2762 | 0.089 | 0.081 | 0.000 | 0.666 |
| I-Finance (Credit) | 2762 | 0.554 | 0.136 | 0.094 | 0.800 |
| Bond | 2762 | 0.019 | 0.067 | 0.000 | 0.893 |
| Stock | 2762 | 0.012 | 0.014 | 0.000 | 0.072 |
| Fund | 2762 | 0.461 | 0.167 | 0.131 | 0.861 |
| Size | 2762 | 22.950 | 1.477 | 19.551 | 28.636 |
| Age | 2762 | 13.060 | 7.024 | 1.000 | 30.000 |
| ROA | 2762 | 0.026 | 0.067 | -1.220 | 0.242 |
| Growth | 2762 | 0.268 | 2.380 | -0.907 | 96.024 |
| ROIC | 2762 | 0.046 | 0.121 | -4.351 | 0.278 |
| Income | 2762 | 0.268 | 2.684 | -0.907 | 127.475 |
RESULTS
This study makes three key findings. First, it provides empirical evidence comparing different financing structures. Results suggest a stronger positive effect of market-dominated direct financing, offering theoretical support for national strategies aimed at increasing the share of direct financing. Second, heterogeneity analysis indicates that indirect financing significantly promotes GTFP primarily in state-owned and renewable energy firms, whereas direct financing benefits all energy companies, particularly non-state-owned firms and firms in the renewable energy sector. Third, mechanism testing reveals that green finance enhances corporate GTFP by improving the quality of green innovation and reducing corporate carbon emissions.
Baseline regression results
Table 3 presents the results concerning the relationship between green finance and GTFP. Column (1) reports the regression results excluding control variables, time fixed effects, and firm fixed effects. Column (2) incorporates time and firm fixed effects into the regression model. Column (3) further includes control variables in addition to time and firm fixed effects. The results show that green finance significantly improves corporate GTFP across all model specifications, thereby supporting Hypothesis 1.
Baseline estimation results
| Variables | (1) | (2) | (3) |
| GTFP | GTFP | GTFP | |
| G-Finance | 0.5077*** | 0.0144*** | 0.0145*** |
| (24.21) | (2.64) | (2.65) | |
| Size | 0.0009 | ||
| (1.27) | |||
| Age | -0.0005 | ||
| (-0.95) | |||
| ROA | -0.0253** | ||
| (-2.50) | |||
| Growth | 0.0009** | ||
| (2.14) | |||
| ROIC | 0.0120** | ||
| (2.28) | |||
| Income | -0.0007* | ||
| (-1.93) | |||
| Constant | 0.9312*** | 0.8199*** | 0.8090*** |
| (356.05) | (197.75) | (43.67) | |
| Year | No | Yes | Yes |
| Firm | No | Yes | Yes |
| Observations | 2,762 | 2,762 | 2,762 |
| R2 | 0.175 | 0.981 | 0.981 |
Robustness tests
To enhance the credibility of the empirical results, six robustness tests are conducted: addressing endogeneity issues, modifying model fixed effects, replacing the independent variable, excluding centrally administered municipalities, applying winsorization, and altering the sample period.
Addressing endogeneity issues
The baseline analysis does not fully account for potential endogeneity, relying on direct regression estimates and concluding that green finance significantly promotes corporate GTFP. However, potential endogeneity and omitted variable bias may undermine the causal interpretation of the relationship between green finance initiatives and corporate GTFP. To address these concerns, this study adopts a difference-in-differences (DID) approach. In 2017, the State Council designated Zhejiang, Jiangxi, Guangdong, Guizhou, and Xinjiang as pilot regions for green finance reform and innovations. This initiative aims to explore new mechanisms for green finance development, expand diversified financing channels for green industries, and enhance corporate green productivity. As a centrally coordinated policy, it generates a relatively exogenous shock at the regional level, allowing the use of a DID model to identify the impact of green finance development on corporate GTFP. These pilot zones provide a credible quasi-natural experiment for empirical identification, leading to the following model:
where i denotes listed companies, k denotes the province in which the company is located, and t represents the year (t = 2010, 2011, ..., 2021). GTFPi,t represents GTFP of enterprises. For Treatk, a value of 1 is assigned to firms located in provinces with pilot zones for green finance reform and innovations, and 0 otherwise. For Postt, a value of 1 is assigned if the observation year falls within or after the establishment of the pilot zones, and 0 otherwise. The interaction term DIDk,t = Treatk × Postt captures the policy effect.
Columns (1-3) of Table 4 report the corresponding results. The coefficient of the interaction term is positive and statistically significant at the 1% level (coefficient = 0.0989, t-statistic = 18.53 in Column 1), confirming that green finance reforms causally improve corporate GTFP. During China’s energy transition, enterprises often face significant “carbon transition risks”. Firms in pilot regions leverage green finance to signal environmental compliance and future growth potential to capital markets. This reduces information asymmetry for external investors and generates a significant “green premium”, enabling firms to obtain long-term capital at lower financing costs for long-horizon, high-risk green technological transformation projects. Regardless of whether control variables, time fixed effects, or firm fixed effects are included, the DID coefficient remains consistently positive and statistically significant. Consistent with the baseline results, this indicates that the establishment of pilot zones for green finance reform and innovations significantly enhances corporate GTFP in the treated regions.
Modifying model fixed effects
Although Equation (1) controls for time and firm fixed effects, firms may also experience structural changes related to industry affiliation or registered location. Because these variations cannot be fully captured by only time and firm fixed effects, this study further incorporates time, firm, province, and industry fixed effects. This specification helps mitigate the influence of unobserved regional and sectoral heterogeneity on the estimation results. Columns (4-6) of Table 4 show that G-Finance maintains a positive and statistically significant coefficient (0.0141, t = 2.57), even under these more stringent specifications. These findings demonstrate that green finance significantly enhances corporate GTFP, consistent with the results in Table 3 and further supporting Hypothesis 1.
Results of addressing endogeneity issues and modifying model fixed effects
| Variables | Addressing endogeneity issues | Modifying model fixed effects | ||||
| (1) | (2) | (3) | (4) | (5) | (6) | |
| GTFP | GTFP | GTFP | GTFP | GTFP | GTFP | |
| DID(Treat × Post) | 0.0989*** | 0.0025* | 0.0024* | |||
| (18.53) | (1.91) | (1.87) | ||||
| G-Finance | 0.5077*** | 0.0140** | 0.0141** | |||
| (24.21) | (2.55) | (2.57) | ||||
| Size | 0.0009 | 0.0009 | ||||
| (1.36) | (1.26) | |||||
| Age | -0.0005 | -0.0007 | ||||
| (-1.08) | (-1.27) | |||||
| ROA | -0.0245** | -0.0254** | ||||
| (-2.42) | (-2.51) | |||||
| Growth | 0.0009** | 0.0009** | ||||
| (2.11) | (2.13) | |||||
| ROIC | 0.0118** | 0.0118** | ||||
| (2.24) | (2.24) | |||||
| Income | -0.0007* | -0.0007* | ||||
| (-1.89) | (-1.93) | |||||
| Constant | 0.9699*** | 0.8198*** | 0.8088*** | 0.9312*** | 0.8199*** | 0.8135*** |
| (543.33) | (197.01) | (43.62) | (356.05) | (197.66) | (41.90) | |
| Year | No | Yes | Yes | No | Yes | Yes |
| Firm | No | Yes | Yes | No | Yes | Yes |
| Province | No | No | No | No | Yes | Yes |
| Industry | No | No | No | No | Yes | Yes |
| Observations | 2,762 | 2,762 | 2,762 | 2,762 | 2,762 | 2,762 |
| R2 | 0.111 | 0.981 | 0.981 | 0.175 | 0.981 | 0.981 |
Replacing the independent variable
To mitigate potential selection bias in the green finance indicator system, we adopt established methodologies to construct alternative measures of green finance development[72]. Specifically, we apply the entropy-weighting method to construct a composite index based on four components: green credit, green insurance, green bonds, and green funds. This newly constructed green finance index replaces the original explanatory variable for robustness testing. Columns (1-3) of Table 5 indicate that green finance continues to significantly enhance corporate GTFP under this alternative specification. These results are consistent with those reported in Table 3, further supporting Hypothesis 1.
Results of replacing the independent variable and excluding centrally administered municipalities
| Variables | Replacing the independent variable | Excluding centrally administered municipalities | ||||
| (1) | (2) | (3) | (4) | (5) | (6) | |
| GTFP | GTFP | GTFP | GTFP | GTFP | GTFP | |
| G-Finance | 0.4821*** | 0.0134** | 0.0135** | 0.5931*** | 0.0119** | 0.0120** |
| (23.87) | (2.45) | (2.45) | (26.09) | (1.97) | (1.99) | |
| Size | 0.0009 | 0.0007 | ||||
| (1.28) | (1.01) | |||||
| Age | -0.0005 | -0.0005 | ||||
| (-0.95) | (-0.97) | |||||
| ROA | -0.0252** | -0.0285*** | ||||
| (-2.49) | (-2.75) | |||||
| Growth | 0.0009** | 0.0008** | ||||
| (2.13) | (2.07) | |||||
| ROIC | 0.0119** | 0.0133** | ||||
| (2.27) | (2.51) | |||||
| Income | -0.0007* | -0.0007* | ||||
| (-1.92) | (-1.87) | |||||
| Constant | 0.9304*** | 0.8199*** | 0.8088*** | 0.9265*** | 0.8202*** | 0.8125*** |
| (348.68) | (197.62) | (43.65) | (338.04) | (198.19) | (41.56) | |
| Year | No | Yes | Yes | No | Yes | Yes |
| Firm | No | Yes | Yes | No | Yes | Yes |
| Observations | 2,762 | 2,762 | 2,762 | 2,252 | 2,252 | 2,252 |
| R2 | 0.171 | 0.981 | 0.981 | 0.232 | 0.981 | 0.981 |
Excluding centrally administered municipalities
Considering potential regional disparities in green finance effectiveness due to uneven economic development, we exclude China’s centrally administered municipalities (i.e., Beijing, Tianjin, Shanghai, and Chongqing) from the baseline sample. The robustness results in Columns (4-6) of Table 5 show that the estimated coefficients remain significantly positive. These findings confirm that Hypothesis 1 holds even after excluding these municipalities.
Applying winsorization
To mitigate the influence of extreme values, we apply 1% bidirectional winsorization to all continuous variables. Columns (1-3) of Table 6 indicate that green finance consistently improves corporate GTFP after winsorization.
Results of applying winsorization and altering the sample period
| Variables | Applying winsorization | Altering the sample period | ||||
| (1) | (2) | (3) | (4) | (5) | (6) | |
| GTFP | GTFP | GTFP | GTFP | GTFP | GTFP | |
| G-Finance | 0.5982*** | 0.0226*** | 0.0224*** | 0.1671*** | 0.0133** | 0.0133** |
| (25.55) | (3.04) | (3.01) | (11.62) | (1.97) | (1.97) | |
| Size | 0.0008 | 0.0024 | ||||
| (1.21) | (1.53) | |||||
| Age | -0.0005 | -0.0003 | ||||
| (-0.93) | (-0.56) | |||||
| ROA | -0.0250** | -0.0075 | ||||
| (-2.49) | (-0.24) | |||||
| Growth | 0.0009** | 0.0007 | ||||
| (2.20) | (1.59) | |||||
| ROIC | 0.0121** | -0.0090 | ||||
| (2.30) | (-0.42) | |||||
| Income | -0.0007** | -0.0006 | ||||
| (-1.99) | (-1.51) | |||||
| Constant | 0.9230*** | 0.8201*** | 0.8100*** | 1.0337*** | 0.9872*** | 0.9387*** |
| (334.44) | (198.77) | (44.00) | (488.81) | (158.99) | (23.51) | |
| Year | No | Yes | Yes | No | Yes | Yes |
| Firm | No | Yes | Yes | No | Yes | Yes |
| Observations | 2,762 | 2,762 | 2,762 | 1,512 | 1,512 | 1,512 |
| R2 | 0.191 | 0.981 | 0.981 | 0.082 | 0.924 | 0.924 |
Altering the sample period
Following Guo and Zhang[36], we conduct a robustness test by altering the sample period. In 2016, China became the world’s largest issuer of green bonds. Therefore, we select the period from 2016 to 2021 as the new sample period for the regression analysis. As shown in Columns (4-6) of Table 6, the contribution of green finance to GTFP remains robust even with a reduced sample size.
The role of green financial structures
Recognizing that different green finance channels may exert heterogeneous effects on corporate GTFP, this study examines market-dominated direct financing, bank-dominated indirect financing, and multiple green financial instruments. We categorize green finance into direct financing (green bonds, green stocks, and green funds) and indirect financing (green credit). Using an entropy-weighting approach, we construct a direct financing index and specify Equation (8) as follows:
We include D-Finance, indirect financing (I-Finance/Credit), and individual green financial instruments (Bond, Stock, and Fund) as independent variables GFi,t in the regression analysis. The results are presented in Table 7.
Relationship between green finance structure and corporate GTFP
| Variables | (1) | (2) | (3) | (4) | (5) | (6) | (7) | (8) | (9) | (10) |
| GTFP | GTFP | GTFP | GTFP | GTFP | GTFP | GTFP | GTFP | GTFP | GTFP | |
| D-Finance | 0.0214*** | 0.0212*** | ||||||||
| (2.96) | (2.92) | |||||||||
| I-Finance (Credit) | 0.0100** | 0.0091* | ||||||||
| (2.06) | (1.88) | |||||||||
| Bond | 0.0295*** | 0.0281** | ||||||||
| (2.61) | (2.48) | |||||||||
| Stock | 0.0735* | 0.0742* | ||||||||
| (1.71) | (1.73) | |||||||||
| Fund | 0.0066** | 0.0063* | ||||||||
| (2.04) | (1.95) | |||||||||
| Size | 0.0008 | 0.0009 | 0.0009 | 0.0009 | 0.0009 | |||||
| (1.22) | (1.36) | (1.29) | (1.31) | (1.28) | ||||||
| Age | -0.0005 | -0.0005 | -0.0005 | -0.0005 | -0.0005 | |||||
| (-0.93) | (-0.97) | (-0.98) | (-0.96) | (-0.97) | ||||||
| ROA | -0.0250** | -0.0242** | -0.0247** | -0.0250** | -0.0246** | |||||
| (-2.49) | (-2.41) | (-2.45) | (-2.49) | (-2.44) | ||||||
| Growth | 0.0009** | 0.0008** | 0.0008** | 0.0009** | 0.0009** | |||||
| (2.19) | (2.07) | (2.08) | (2.19) | (2.16) | ||||||
| ROIC | 0.0120** | 0.0116** | 0.0119** | 0.0120** | 0.0118** | |||||
| (2.30) | (2.22) | (2.28) | (2.29) | (2.25) | ||||||
| Income | -0.0007** | -0.0007* | -0.0007* | -0.0007** | -0.0007* | |||||
| (-1.98) | (-1.84) | (-1.85) | (-1.98) | (-1.93) | ||||||
| Constant | 0.8204*** | 0.8102*** | 0.8157*** | 0.8042*** | 0.8205*** | 0.8097*** | 0.8210*** | 0.8096*** | 0.81930*** | 0.8085*** |
| (199.13) | (44.00) | (166.86) | (43.24) | (199.09) | (43.96) | (199.30) | (43.92) | (194.49) | (43.88) | |
| Year | Yes | Yes | Yes | Yes | Yes | Yes | Yes | Yes | Yes | Yes |
| Firm | Yes | Yes | Yes | Yes | Yes | Yes | Yes | Yes | Yes | Yes |
| Observations | 2,762 | 2,762 | 2,762 | 2,762 | 2,762 | 2,762 | 2,762 | 2,762 | 2,762 | 2,762 |
| R2 | 0.981 | 0.981 | 0.981 | 0.981 | 0.981 | 0.981 | 0.981 | 0.981 | 0.981 | 0.981 |
Columns (1) and (2) of Table 7 report the results for D-Finance, while Columns (3) and (4) present the results for I-Finance/Credit. Columns (5)-(10) focus on specific green financial instruments. Specifically, Columns (5) and (6) examine green bonds (Bond), Columns (7) and (8) analyze green stocks (Stock), and Columns (9) and (10) report results for green funds (Fund).
The results indicate that both direct and indirect financing exhibit significantly positive coefficients, suggesting that both market-dominated direct financing and bank-dominated indirect financing enhance corporate GTFP. In the energy sector, which is characterized by high information asymmetry, green financing signals environmental compliance of firms and technological foresight to the market. This signaling effect enables firms to obtain long-term capital at lower financing costs, thereby supporting the long-term, high-risk development of green technologies. After controlling for additional variables, direct financing significantly increases corporate GTFP at the 1% significance level, whereas indirect financing increases corporate GTFP only at the 10% level. This finding highlights the stronger impact of market-dominated direct financing relative to bank-dominated indirect financing, revealing the synergistic advantages of a “coordinated market” approach.
Regarding different green financial instruments, the inclusion of control variables shows that green bonds significantly promote corporate GTFP at the 5% level. In contrast, other green financial instruments, such as green credit, green stocks, and green funds, exhibit positive effects that are significant at the 10% level, suggesting that green bonds have a relatively significant impact on corporate GTFP.
Heterogeneity analysis
Enterprise heterogeneity: non-state-owned and state-owned enterprises
Compared with non-state-owned enterprises, state-owned enterprises face more severe agency problems. Managers in state-owned enterprises are often more risk-averse and short-term oriented, leading them to avoid green technology innovation. In contrast, non-state-owned enterprises often lack strong government ties and fiscal support. To improve profitability and GTFP, they are therefore more incentivized to invest in green technological innovation to gain greater policy recognition and support, thereby enhancing their competitive advantage. Given that ownership structure may influence the effectiveness of green finance, this study classifies enterprises into non-state-owned and state-owned categories.
Table 8 presents the regression results by ownership type: Columns (1-6) report results for non-state-owned enterprises, and Columns (7-12) report results for state-owned enterprises. Columns (1), (2), (7), and (8) show that overall green finance development significantly promotes corporate GTFP. Furthermore, Columns (3-6) and (9-12) reveal that direct and indirect financing exert heterogeneous effects on corporate GTFP depending on ownership structure.
Results by enterprise heterogeneity
| Variables | Non-state-owned enterprises | State-owned enterprises | ||||||||||
| (1) | (2) | (3) | (4) | (5) | (6) | (7) | (8) | (9) | (10) | (11) | (12) | |
| GTFP | GTFP | GTFP | GTFP | GTFP | GTFP | GTFP | GTFP | GTFP | GTFP | GTFP | GTFP | |
| G-Finance | 0.0330*** | 0.0353*** | 0.0167* | 0.0165* | ||||||||
| (2.59) | (2.77) | (1.77) | (1.74) | |||||||||
| D-Finance | 0.0309** | 0.0331*** | 0.0161* | 0.0158* | ||||||||
| (2.46) | (2.63) | (1.76) | (1.72) | |||||||||
| I-Finance (Credit) | 0.0066 | 0.0066 | 0.0124** | 0.0112* | ||||||||
| (0.83) | (0.83) | (1.96) | (1.77) | |||||||||
| Size | 0.0006 | 0.0006 | 0.0006 | 0.0010 | 0.0010 | 0.0010 | ||||||
| (0.59) | (0.57) | (0.54) | (0.97) | (0.97) | (1.02) | |||||||
| Age | -0.0005 | -0.0005 | -0.0006 | 0.0010* | 0.0010* | 0.0011* | ||||||
| (-0.99) | (-0.99) | (-1.08) | (1.79) | (1.79) | (1.81) | |||||||
| ROA | -0.0176 | -0.0174 | -0.0142 | -0.0257* | -0.0256* | -0.0246* | ||||||
| (-0.70) | (-0.69) | (-0.56) | (-1.89) | (-1.88) | (-1.80) | |||||||
| Growth | 0.0057** | 0.0057** | 0.0054** | 0.0007 | 0.0007 | 0.0007 | ||||||
| (2.42) | (2.41) | (2.29) | (1.26) | (1.26) | (1.22) | |||||||
| ROIC | 0.0054 | 0.0053 | 0.0032 | 0.0125** | 0.0125** | 0.0120** | ||||||
| (0.31) | (0.30) | (0.18) | (2.13) | (2.12) | (2.04) | |||||||
| Income | -0.0044** | -0.0044** | -0.0042** | -0.0006 | -0.0006 | -0.0006 | ||||||
| (-2.43) | (-2.42) | (-2.29) | (-0.70) | (-0.70) | (-0.70) | |||||||
| Constant | 0.8180*** | 0.8133*** | 0.8184*** | 0.8140*** | 0.8152*** | 0.8127*** | 0.8425*** | 0.8003*** | 0.8428*** | 0.8005*** | 0.8375*** | 0.7943*** |
| (175.26) | (30.91) | (175.59) | (30.93) | (124.93) | (30.44) | (61.07) | (34.21) | (61.13) | (34.21) | (59.05) | (33.73) | |
| Year | Yes | Yes | Yes | Yes | Yes | Yes | Yes | Yes | Yes | Yes | Yes | Yes |
| Firm | Yes | Yes | Yes | Yes | Yes | Yes | Yes | Yes | Yes | Yes | Yes | Yes |
| Observations | 1,161 | 1,161 | 1,161 | 1,161 | 1,161 | 1,161 | 1,601 | 1,601 | 1,601 | 1,601 | 1,601 | 1,601 |
| R2 | 0.980 | 0.980 | 0.980 | 0.980 | 0.980 | 0.980 | 0.982 | 0.982 | 0.982 | 0.982 | 0.982 | 0.982 |
Specifically, the results show that: (1) market-dominated direct financing significantly promotes GTFP across all types of enterprises, highlighting the inclusive nature of market-based financing mechanisms; and (2) the effect of bank-dominated indirect financing on GTFP differs substantially between state-owned and non-state-owned enterprises. It significantly improves GTFP for state-owned enterprises but remains statistically insignificant for non-state-owned enterprises.
These differences can be explained as follows. First, as the ultimate owner of state-owned enterprises, the government enables these firms to operate under soft budget constraints. By contrast, non-state-owned enterprises often face substantial financing constraints and limited access to external capital. As a result, external financial support is particularly important for industrial upgrading and cost reduction in non-state-owned enterprises, thereby strengthening the positive impact of green finance on GTFP. Second, state-owned enterprises benefit from stronger policy support and lower operational risk. Banks typically impose higher creditworthiness requirements for green lending, which favors state-owned enterprises or large firms with lower perceived risk. This makes it difficult for non-state-owned enterprises to obtain sufficient green credit support. Consequently, bank-dominated indirect financing is less effective in enhancing the GTFP of non-state-owned enterprises.
Industry heterogeneity: traditional and renewable energy sectors
Distinguishing between the traditional and renewable energy sectors is crucial for understanding how green finance influences corporate GTFP. High-polluting and energy-intensive production methods prevalent in the traditional energy sector pose significant challenges to sustainable development. In contrast, the renewable energy sector relies on more environmentally friendly production processes. Increased investment in the renewable energy sector is instrumental in achieving China’s low-carbon emission reduction goals, attracting both investor interest and substantial government support. This study categorizes the energy sector into two groups: traditional energy and renewable energy. Following Yu et al., we classify five industries (i.e., B06, B07, C25, D44, and D45) as the traditional energy sector, with all remaining industries classified as the renewable energy sector[63]. The results of the grouped regression analyses are presented in Table 9.
Results of industry heterogeneity
| Variables | Traditional energy sector | Renewable energy sector | ||||||||||
| (1) | (2) | (3) | (4) | (5) | (6) | (7) | (8) | (9) | (10) | (11) | (12) | |
| GTFP | GTFP | GTFP | GTFP | GTFP | GTFP | GTFP | GTFP | GTFP | GTFP | GTFP | GTFP | |
| G-Finance | 0.0181* | 0.0186* | 0.0317*** | 0.0325*** | ||||||||
| (1.79) | (1.84) | (2.79) | (2.85) | |||||||||
| D-Finance | 0.0169* | 0.0173* | 0.0307*** | 0.0314*** | ||||||||
| (1.73) | (1.78) | (2.74) | (2.79) | |||||||||
| I-Finance (Credit) | 0.0044 | 0.0042 | 0.0183*** | 0.0172** | ||||||||
| (0.65) | (0.62) | (2.59) | (2.44) | |||||||||
| Size | 0.0011 | 0.0011 | 0.0012 | 0.0006 | 0.0006 | 0.0007 | ||||||
| (0.99) | (0.99) | (1.04) | (0.66) | (0.65) | (0.76) | |||||||
| Age | -0.0006 | -0.0006 | -0.0006 | -0.0005 | -0.0005 | -0.0005 | ||||||
| (-1.02) | (-1.03) | (-1.00) | (-0.97) | (-0.96) | (-1.02) | |||||||
| ROA | 0.0116 | 0.0118 | 0.0121 | -0.0266** | -0.0265** | -0.0244* | ||||||
| (0.33) | (0.34) | (0.35) | (-2.10) | (-2.09) | (-1.92) | |||||||
| Growth | 0.0008** | 0.0008** | 0.0008** | 0.0033 | 0.0033 | 0.0033 | ||||||
| (2.05) | (2.04) | (1.97) | (0.74) | (0.74) | (0.74) | |||||||
| ROIC | -0.0250 | -0.0252 | -0.0254 | 0.0123** | 0.0123** | 0.0114* | ||||||
| (-0.87) | (-0.87) | (-0.88) | (2.10) | (2.09) | (1.94) | |||||||
| Income | -0.0007* | -0.0007* | -0.0006* | -0.0020 | -0.0020 | -0.0021 | ||||||
| (-1.90) | (-1.89) | (-1.80) | (-0.45) | (-0.45) | (-0.47) | |||||||
| Constant | 0.8323*** | 0.8160*** | 0.8326*** | 0.8162*** | 0.8309*** | 0.8132*** | 0.8208*** | 0.8154*** | 0.8212*** | 0.8160*** | 0.8118*** | 0.8054*** |
| (195.99) | (30.75) | (196.76) | (30.75) | (149.31) | (30.44) | (191.30) | (34.03) | (191.78) | (34.04) | (140.32) | (33.35) | |
| Year | Yes | Yes | Yes | Yes | Yes | Yes | Yes | Yes | Yes | Yes | Yes | Yes |
| Firm | Yes | Yes | Yes | Yes | Yes | Yes | Yes | Yes | Yes | Yes | Yes | Yes |
| Observations | 1,371 | 1,371 | 1,371 | 1,371 | 1,371 | 1,371 | 1,391 | 1,391 | 1,391 | 1,391 | 1,391 | 1,391 |
| R2 | 0.982 | 0.982 | 0.982 | 0.982 | 0.982 | 0.982 | 0.980 | 0.980 | 0.980 | 0.980 | 0.980 | 0.980 |
Columns (1-6) of Table 9 represent the traditional energy sector, whereas Columns (7-12) cover the renewable energy sector. First, the results in Columns (1), (2), (7), and (8) indicate that green finance development significantly enhances corporate GTFP in both sectors, with a stronger effect observed in renewable energy firms. Second, Columns (3-6) and (9-12) show that direct and indirect financing affect GTFP of firms differently across the two sectors. Two main findings emerge: (1) market-dominated direct financing significantly enhances GTFP growth in both traditional and renewable energy firms, demonstrating strong industry adaptability within a “market synergy” framework; and (2) bank-dominated indirect financing exhibits substantial sectoral heterogeneity. Indirect financing significantly improves the GTFP of renewable energy firms but has no statistically significant effect on traditional energy firms.
This discrepancy can be attributed to China’s strong policy support for the renewable energy sector, which promotes green transition and sustainable development. The renewable energy industry benefits from its clean production characteristics, enabling it to obtain greater green finance support and more efficient allocation of financial resources toward structured green transformation initiatives. In contrast, indirect financing mechanisms, such as green credit, primarily target lower-risk projects, creating financing constraints for traditional high-pollution enterprises and limiting their ability to improve GTFP.
Mechanism analysis
Green finance, green innovation, and corporate GTFP
Table 10 presents the mediation analysis results for corporate green innovation. Columns (2) and (3) report results for total green innovation, Columns (4) and (5) focus on green innovation quality, and Columns (6) and (7) examine green innovation quantity. In Columns (2) and (3), the estimated coefficients for green finance are significantly positive, indicating that green finance development enhances both corporate green innovation and GTFP. The significantly positive coefficient for Total in Column (3) further confirms the mediating role of overall green innovation and supports Hypothesis 3a.
Mediation analysis results for corporate green innovation
| Variables | (1) | (2) | (3) | (4) | (5) | (6) | (7) |
| GTFP | Total | GTFP | Inva | GTFP | Uma | GTFP | |
| G-Finance | 0.0155** | 42.6395** | 0.0149** | 40.3693** | 0.0148** | 1.8697 | 0.0154** |
| (2.42) | (2.05) | (2.32) | (2.26) | (2.31) | (0.34) | (2.41) | |
| Total | 0.00001** | ||||||
| (2.12) | |||||||
| Inva | 0.00002** | ||||||
| (2.18) | |||||||
| Uma | 0.00002 | ||||||
| (0.89) | |||||||
| Size | 0.0010 | 8.2331*** | 0.0009 | 6.0443*** | 0.0009 | 2.1213*** | 0.0010 |
| (1.42) | (3.47) | (1.27) | (2.98) | (1.29) | (3.36) | (1.36) | |
| Age | -0.0005 | -0.9185 | -0.0005 | -0.4143 | -0.0005 | -0.5124 | -0.0005 |
| (-0.94) | (-0.57) | (-0.92) | (-0.30) | (-0.93) | (-1.19) | (-0.92) | |
| ROA | -0.0286*** | -13.6190 | -0.0284*** | -8.1659 | -0.0285*** | -5.3474 | -0.0285*** |
| (-2.74) | (-0.40) | (-2.72) | (-0.28) | (-2.73) | (-0.59) | (-2.73) | |
| Growth | 0.0009** | -0.4910 | 0.0009** | -0.3120 | 0.0009** | -0.1807 | 0.0009** |
| (2.12) | (-0.37) | (2.14) | (-0.28) | (2.13) | (-0.51) | (2.13) | |
| ROIC | 0.0126** | -2.5342 | 0.0126** | -3.6208 | 0.0126** | 1.0985 | 0.0125** |
| (2.30) | (-0.14) | (2.31) | (-0.24) | (2.32) | (0.23) | (2.30) | |
| Income | -0.0007* | 0.5074 | -0.0007* | 0.3256 | -0.0007* | 0.1825 | -0.0007* |
| (-1.89) | (0.43) | (-1.91) | (0.32) | (-1.90) | (0.58) | (-1.90) | |
| Constant | 0.8053*** | -173.2385*** | 0.8077*** | -137.2329** | 0.8076*** | -34.2405** | 0.8061*** |
| (41.59) | (-2.75) | (41.68) | (-2.55) | (41.68) | (-2.04) | (41.59) | |
| Year | Yes | Yes | Yes | Yes | Yes | Yes | Yes |
| Firm | Yes | Yes | Yes | Yes | Yes | Yes | Yes |
| Observations | 2,618 | 2,618 | 2,618 | 2,618 | 2,618 | 2,618 | 2,618 |
| R2 | 0.980 | 0.754 | 0.980 | 0.745 | 0.980 | 0.656 | 0.980 |
In Columns (4) and (5), the coefficients for green finance remain significantly positive, suggesting that it improves both green innovation quality and GTFP. Moreover, the significantly positive coefficient for Inva reported in Column (5) indicates that green finance enhances GTFP by improving the quality of corporate green innovation. Conversely, the coefficients for green finance in Columns (6) and (7) are not significant, and the coefficient for Uma is also insignificant. This finding suggests that green finance does not substantially increase the quantity of green innovation, indicating that green innovation quantity does not play a mediating role in this relationship.
Overall, the mediation test results suggest that corporate green innovation partially mediates the positive impact of green finance on GTFP. Importantly, this effect is primarily driven by improvements in the quality of green innovation rather than its quantity.
Green finance, carbon emissions, and corporate GTFP
In Table 11, the dependent variable in Columns (1) and (3) is corporate GTFP, whereas the dependent variable in Column (2) is corporate carbon emissions. The results indicate that the coefficient of green finance in Column (2) is significantly negative, suggesting that green finance development reduces corporate carbon emissions. Conversely, the coefficients for green finance in Columns (1) and (3) are significantly positive, and the coefficient for Carbon in Column (3) is significantly negative, confirming the mediating role of carbon emissions. These empirical results demonstrate that green finance enhances corporate GTFP by reducing carbon emissions, thereby validating Hypothesis 3b.
Mediation analysis results for corporate carbon emissions
| Variables | (1) | (2) | (3) |
| GTFP | Carbon | GTFP | |
| G-Finance | 0.0158*** | -0.2986* | 0.0151*** |
| (2.79) | (-1.94) | (2.66) | |
| Carbon | -0.0014* | ||
| (-1.67) | |||
| Size | 0.0014* | 0.7701*** | 0.0025** |
| (1.83) | (35.92) | (2.47) | |
| Age | -0.0005 | -0.0166 | -0.0005 |
| (-0.89) | (-1.17) | (-0.96) | |
| ROA | -0.0300*** | 1.6893*** | -0.0261** |
| (-2.73) | (5.67) | (-2.36) | |
| Growth | 0.0009** | 0.0137 | 0.0009** |
| (2.03) | (1.20) | (2.07) | |
| ROIC | 0.0135** | -0.4623*** | 0.0126** |
| (2.45) | (-3.09) | (2.27) | |
| Income | -0.0007* | -0.0071 | -0.0007* |
| (-1.88) | (-0.72) | (-1.91) | |
| Constant | 0.8196*** | -3.6474*** | 0.8148*** |
| (39.12) | (-6.42) | (38.57) | |
| Year | Yes | Yes | Yes |
| Firm | Yes | Yes | Yes |
| Observations | 2,375 | 2,347 | 2,347 |
| R2 | 0.977 | 0.947 | 0.977 |
CONCLUSION
This study examines how market-dominated direct financing and bank-dominated indirect financing influence the GTFP of China’s energy firms. The findings demonstrate that green finance significantly enhances GTFP by promoting high-quality green innovation and achieving substantial reductions in carbon emissions. Notably, market-driven direct financing, particularly through green bonds, exhibits superior efficiency and broader inclusivity across enterprise ownership types and industries compared to traditional credit-centric models. The ongoing transition of China’s financial system from a “credit-dominant” structure to a “market-collaborative” framework is essential for the high-quality, low-carbon transformation of the energy sector. Future development should focus on deepening direct financing markets and establishing a synergistic “capital-innovation-performance” mechanism to ensure that green investments generate sustainable long-term environmental and economic benefits.
Therefore, this study offers the following policy recommendations. First, given that direct financing provides a more inclusive pathway for improving GTFP, particularly for non-state-owned and renewable energy firms, regulatory authorities should establish “green channels” for initial public offerings and refinancing activities of energy enterprises engaged in substantial green technologies. Second, as green bonds are the most efficient driver of GTFP, policies should move beyond interest subsidies and instead establish public-backed credit enhancement mechanisms, thereby lowering risk premiums and long-term capital costs for traditional energy firms transitioning toward low-carbon development. Third, a long-term “capital-innovation-performance” mechanism should be established by encouraging sustainability-linked bonds that tie interest rates to environmental performance of firms.
Although this study provides robust empirical evidence for the energy sector, the sample period ends in 2021. Future research could examine the real-time impact of the 2024 “Guiding Opinions on Further Strengthening Financial Support for Green and Low-Carbon Development” to provide updated insights into China’s evolving green financial landscape.
DECLARATIONS
Authors’ contributions
Original draft, methodology, funding acquisition, formal analysis, and conceptualization: Chai, S.
Original draft, software, and methodology: Cao, M.
Review, editing, and validation: Chu, W.
Review and editing: Zhou, Q.
Availability of data and materials
The data used in this study are derived from several public and commercial databases and are publicly or commercially available. Control variable data were obtained from the China Stock Market and Accounting Research Database (CSMAR). Green finance data were compiled from the China Statistical Yearbook, the China City Statistical Yearbook, the China Environmental Statistical Yearbook, and the Wind Database. Data on green innovation were retrieved from the China Research Data Services Platform (CNRDS). Corporate carbon emission data were manually collected from annual reports and sustainability reports of publicly listed companies. The data supporting the findings of this study are included within the article. Further inquiries can be directed to the corresponding author.
AI and AI-assisted tools statement
Not applicable.
Financial support and sponsorship
This work was supported by the National Social Science Foundation of China (No. 24FJYA005).
Conflicts of interest
All authors declared that there are no conflicts of interest.
Ethical approval and consent to participate
Not applicable.
Consent for publication
Not applicable.
Copyright
© The Author(s) 2026.
REFERENCES
1. Chai, S.; Zhou, Q.; Ji, Q.; Liu, Z.; Liu, C.; Chu, W. Inhibition or inducement? The impact of carbon emissions trading scheme (ETS) on corporate earnings management from the perspective of public pressure. Int. Rev. Financ. Anal. 2025, 101, 104019.
2. Zeng, A.; Liu, Y.; Tan, X.; Xiong, X.; Xing, X. Uncovering the evolution of the public climate finance policy mix for renewable energy in China. Carbon. Footprints. 2025, 4, 13.
3. Zhang, H.; Chen, Y. The role of new quality productivity in driving China’s green economic growth. Int. Rev. Econ. Financ. 2025, 102, 104315.
4. Gu, J. New quality productive forces and rural China’s clean cooking transition: a spatial analysis. Energy. Policy. 2026, 208, 114908.
5. Chai, S.; Chu, W.; Zhang, Z.; Li, Z.; Abedin, M. Z. Dynamic nonlinear connectedness between the green bonds, clean energy, and stock price: the impact of the COVID-19 pandemic. Ann. Oper. Res. 2022, 345, 1137-64.
6. Berdiev, U. Stock market reaction to green bond announcements: the role of firm sustainability. Financ. Res. Lett. 2025, 86, 108295.
7. Liu, M.; Duan, H.; Cui, H. Policy incentives and collaborative diffusion of urban green innovation: based on the green credit subsidy policy. Econ. Anal. Policy. 2025, 87, 2520-33.
8. Reboredo, J. C.; Ugolini, A.; Aiube, F. A. L. Network connectedness of green bonds and asset classes. Energy. Econ. 2020, 86, 104629.
9. Sun, G.; Wang, J.; Ai, Y. The impact of government green subsidies on stock price crash risk. Energy. Econ. 2024, 134, 107573.
10. Ma, L.; Iqbal, N.; Bouri, E.; Zhang, Y. How good is green finance for green innovation? Evidence from the Chinese high-carbon sector. Resour. Policy. 2023, 85, 104047.
11. Chi, G.; Liu, Y.; Fang, H.; Xiu, Y. Tapping the potential of green finance: can energy efficiency credit drive traditional industries to green? Evidence from China. Econ. Anal. Policy. 2025, 87, 1834-53.
12. Tian, C.; Shen, X.; Liu, Y. Green finance policies and bank systemic risk: evidence from listed banks in China. Financ. Res. Lett. 2025, 80, 107388.
13. Marcinkowska, M.; Brzeszczyński, J.; Charteris, A.; Gajdka, J.; Obojska, L.; Szczygielski, J. J. Sustainability, energy finance and the role of central banks: a review of current insights and future research directions. Energy. Econ. 2025, 144, 108084.
14. Wang, H.; Fu, J.; Lei, X.; Huang, W. Transforming firms for a greener future: the role of green finance in shaping environmental performance in China. J. Environ. Manage. 2025, 394, 127547.
15. Huang, S.; Liu, S.; Zhou, Q. Does green finance affect ESG rating divergence? A study based on information disclosure quality. Financ. Res. Lett. 2025, 86, 108626.
16. He, L.; Liu, R.; Zhong, Z.; Wang, D.; Xia, Y. Can green financial development promote renewable energy investment efficiency? A consideration of bank credit. Renew. Energy. 2019, 143, 974-84.
17. Zhang, C.; Zhang, L.; Liu, L.; Du, C. The study of the relationship between green finance and resource efficiency in east asian economies. Resour. Policy. 2024, 89, 104658.
18. Xu, X.; Liu, Q. Transformation of innovation in heavily polluting enterprises under resource constraints: the role of green finance policy. Int. Rev. Econ. Financ. 2025, 103, 104524.
19. Feng, C.; Zhong, S.; Wang, M. How can green finance promote the transformation of China’s economic growth momentum? A perspective from internal structures of green total-factor productivity. Res. Int. Bus. Financ. 2024, 70, 102356.
20. Lee, C.; Lee, C. How does green finance affect green total factor productivity? Evidence from China. Energy. Econ. 2022, 107, 105863.
21. Yi, H.; Hao, L.; Liu, A.; Zhang, Z. Green finance development and resource efficiency: a financial structure perspective. Resour. Policy. 2023, 85, 104068.
22. Liu, X.; Guo, W. Dynamic impact of green finance on renewable energy development: based on scale, structure, and efficiency perspectives. Renew. Energy. 2025, 238, 121854.
23. Li, Q.; Lei, H.; Yu, M. Green finance, green innovation and carbon intensity. Int. Rev. Financ. Anal. 2025, 106, 104550.
24. Li, R.; Wen, S.; Xue, S. Risk as opportunity: the incentive effect of green finance policy on risk-taking of energy firms. Energy 2026, 344, 139811.
25. Wang, J.; Ye, B.; He, Z.; Pu, H.; Su, B.; Lu, Y. Does green finance ensure energy security while achieving low-carbon transformation of listed electricity firms? Evidence from China. Energy. Econ. 2026, 153, 109092.
26. Lee, C.; Chang, Y.; Wang, E. Crossing the rivers by feeling the stones: the effect of China’s green credit policy on manufacturing firms’ carbon emission intensity. Energy. Econ. 2022, 116, 106413.
27. Zhang, A.; Deng, R.; Wu, Y. Does the green credit policy reduce the carbon emission intensity of heavily polluting industries? Evidence from China’s industrial sectors. J. Environ. Manage. 2022, 311, 114815.
28. Zhang, D. Does green finance really inhibit extreme hypocritical ESG risk? A greenwashing perspective exploration. Energy. Econ. 2023, 121, 106688.
29. Zhong, M.; Niu, Z.; Zhu, Y.; Li, R. Government green subsidies and corporate ESG greenwashing: evidence from China. Econ. Anal. Policy. 2025, 88, 1321-46.
30. Wang, Q.; Fan, Z. Green finance and investment behavior of renewable energy enterprises: a case study of China. Int. Rev. Financ. Anal. 2023, 87, 102564.
31. Wang, S.; Shu, W.; Cui, L. Green finance policy and green economic transformation. Int. Rev. Financ. Anal. 2024, 96, 103785.
32. Hao, Y.; Liang, J.; Liu, K. Green financial policy reform, financing constraints, and corporate risk-taking. Financ. Res. Lett. 2025, 86, 108504.
33. Wang, T.; Liu, X.; Wang, H. Green bonds, financing constraints, and green innovation. J. Clean. Prod. 2022, 381, 135134.
34. Xiong, Y.; Dai, L. Does green finance investment impact on sustainable development: role of technological innovation and renewable energy. Renew. Energy. 2023, 214, 342-9.
35. Liu, S.; Li, S. Corporate green bond issuance and high-quality corporate development. Financ. Res. Lett. 2024, 61, 104880.
36. Guo, S.; Zhang, Z. Green credit policy and total factor productivity: evidence from Chinese listed companies. Energy. Econ. 2023, 128, 107115.
37. Li, Y.; Yu, C.; Shi, J.; Liu, Y. How does green bond issuance affect total factor productivity? Evidence from Chinese listed enterprises. Energy. Econ. 2023, 123, 106755.
38. Yue, H.; Zhou, Z.; Liu, H. How does green finance influence industrial green total factor productivity? Empirical research from China. Energy. Reports. 2024, 11, 914-24.
39. Sun, F.; Li, Y. The role of combinatorial green finance policies in improving total factor energy efficiency: evidence from Chinese cities. J. Clean. Prod. 2025, 526, 146681.
40. Meng, Y.; Yu, J.; Yu, Y.; Ren, Y. Impact of green finance on green total factor productivity: new evidence from improved synthetic control methods. J. Environ. Manage. 2024, 372, 123394.
41. Huang, S.; Wang, Y.; Li, S.; Pan, D. Impact of regional green finance development on green transformation of enterprises. Financ. Res. Lett. 2026, 92, 109412.
42. Zhu, Z.; Hua, Q.; Xu, S.; Lin, W. The mechanism of green finance in promoting China’s new quality productive forces: technological innovation and data factor. Res. Int. Bus. Financ. 2025, 79, 103038.
43. Cheng, Z.; Zhao, M. The impact of green bond issuance on corporate green total factor productivity. J. Environ. Manage. 2026, 398, 128502.
44. Wang, T.; Chen, Y. An analysis of the synergistic influence of innovation factor resource allocation, employment quality, and financial resource misallocation. Financ. Res. Lett. 2025, 86, 108314.
45. Zheng, M.; Zhou, H. Does a bank-dominated financial system benefit the development of renewable energy in developing countries? The case of China. Energy. Strategy. Rev. 2025, 59, 101715.
46. He, S.; Hou, Y.; Dong, Z.; Zhang, J.; Wu, Y.; Liu, S. The evolution of China’s electricity market-oriented reform: pathways to achieving marketization and decarbonization in response to climate policy. J. Environ. Manage. 2025, 389, 126103.
47. Liang, S.; Wang, P.; Jia, C.; Zhu, J. Studying green financing, factor allocation efficiency, and regional productivity growth in renewable energy industries. Renew. Energy. 2023, 214, 130-9.
48. Fu, Q.; Zhao, S. Influence of green finance on new-quality productivity of enterprises: evidence from Chinese a-share listed companies. Int. Rev. Financ. Anal. 2025, 105, 104356.
49. Lin, J. Y.; Wang, W.; Xu, V. Z. Distance to frontier and optimal financial structure. Struct. Change. Econ. Dyn. 2022, 60, 243-9.
50. Galindo, M.; Méndez, M. T. Entrepreneurship, economic growth, and innovation: are feedback effects at work? J. Bus. Res. 2014, 67, 825-9.
51. Schröder, A.; Schlereth, C.; Hienerth, C.; Kellermanns, F. A perfect match? How entrepreneurs evaluate and decide on venture capital firms. J. Bus. Res. 2025, 200, 115621.
52. Wang, C.; Wang, C.; Long, H.; Zaremba, A. Does green bond issuance reduce the cost of bank loans? Evidence from China. J. Corp. Financ. 2025, 94, 102859.
53. Henide, K. Voluntary disclosure and adverse selection: bayesian game theoretical inference for green bond labelling regimes. Int. Rev. Financ. Anal. 2022, 83, 102248.
54. Tan, W.; Chen, Y.; Sun, Y.; Guo, X.; Li, Z. Internal capital markets and risk-taking: evidence from China. Pac. Basin. Financ. J. 2023, 78, 101968.
55. Gao, Y.; Wen, S.; Yuan, J.; Zhen, Q. Green credit policy and corporate innovation: a study of heavily polluting listed firms. Financ. Res. Lett. 2025, 85, 108116.
56. Xu, X.; Zhang, C.; Yang, L. Green bonds: catalyst or constraint for corporate green investment efficiency? J. Multinatl. Financ. Manag. 2025, 79, 100920.
57. Jin, B.; Xie, Y.; Huang, J. Green finance reform pilot zones promote green technology innovation in industrial enterprises. Financ. Res. Lett. 2025, 86, 108320.
58. Xiao, B.; Li, H. Financial efficiency, green innovation and green total factor productivity. Financ. Res. Lett. 2025, 76, 107005.
59. Meng, S.; Duan, Y.; Zhou, W. How does green finance policy reduce the carbon emissions of polluting enterprises? A mediation effect analysis of inclusive finance. Res. Int. Bus. Financ. 2025, 77, 102914.
60. Zhu, C.; Qi, J.; Feng, L.; Wang, X. Source control or end-of-pipe treatment: How green finance policy impacts enterprise carbon intensity. Int. Rev. Financ. Anal. 2025, 104, 104323.
61. Xiao, B.; Guo, X.; Guo, X.; Wang, J. How does green finance policy in China help reduce pollution emissions? Energy efficiency improvement or green innovation. J. Clean. Prod. 2024, 467, 142933.
62. Xu, B. Assessing the role of financial tool in China’s low-carbon transition: evidence from traditional credit and green credit. Energy 2025, 335, 138014.
63. Yu, F.; Zhang, Q.; Jiang, D. The impact of regional environmental regulations on digital transformation of energy companies: The moderating role of the top management team. Manage. Decis. Econ. 2023, 44, 3152-65.
64. Li, D.; Wang, P. FinTech development and corporate green total factor productivity. Int. Rev. Financ. Anal. 2025, 107, 104567.
65. Zhao, S.; Wu, Q.; Zhou, X. Impact of green credit on financing constraints of energy-consuming firms. Financ. Res. Lett. 2025, 74, 106801.
66. Block, J.; Lambrecht, D.; Willeke, T.; Cucculelli, M.; Meloni, D. Green patents and green trademarks as indicators of green innovation. Research. Policy. 2025, 54, 105138.
67. Hao, W. Liu J.; Zhang L. Carbon emissions and assets pricing-evidence from chinese listed firms. China. J. Econ. 2022, 9, 28-75. (in Chinese). https://tsjj.cbpt.cnki.net/WKG/WebPublication/paperDigest.aspx?paperID=e2b5f2cf-e25b-4ffa-ac42-1e7eba0f3103 (accessed 2026-05-20).
68. Ge, H.; Zhang, X.; Gao, P.; Li, M. Global value chain participation and firm-level carbon emissions: evidence from China. Struct. Change. Econ. Dyn. 2026, 77, 313-26.
69. Ren, S.; Wu, Y.; Zhao, L.; Du, L. Third-party environmental information disclosure and firms’ carbon emissions. Energy. Econ. 2024, 131, 107350.
70. Sohaib, M.; Majeed, A.; Liu, J.; Oláh, J. The role of renewable energy in mitigating carbon emissions: Insights from China’s energy consumption patterns. Energy. Strategy. Rev. 2025, 61, 101860.
71. Jiang, Y. Government digital governance and corporate green total factor productivity. Int. Rev. Econ. Financ. 2025, 102, 104338.
Cite This Article
How to Cite
Download Citation
Export Citation File:
Type of Import
Tips on Downloading Citation
Citation Manager File Format
Type of Import
Direct Import: When the Direct Import option is selected (the default state), a dialogue box will give you the option to Save or Open the downloaded citation data. Choosing Open will either launch your citation manager or give you a choice of applications with which to use the metadata. The Save option saves the file locally for later use.
Indirect Import: When the Indirect Import option is selected, the metadata is displayed and may be copied and pasted as needed.
About This Article
Copyright

Data & Comments
Data
0


Comments
Comments must be written in English. Spam, offensive content, impersonation, and private information will not be permitted. If any comment is reported and identified as inappropriate content by OAE staff, the comment will be removed without notice. If you have any queries or need any help, please contact us at [email protected].