

Concentration distribution and group disparity of traffic-derived NO2 exposure in Baoshan District
 0
0 Abstract
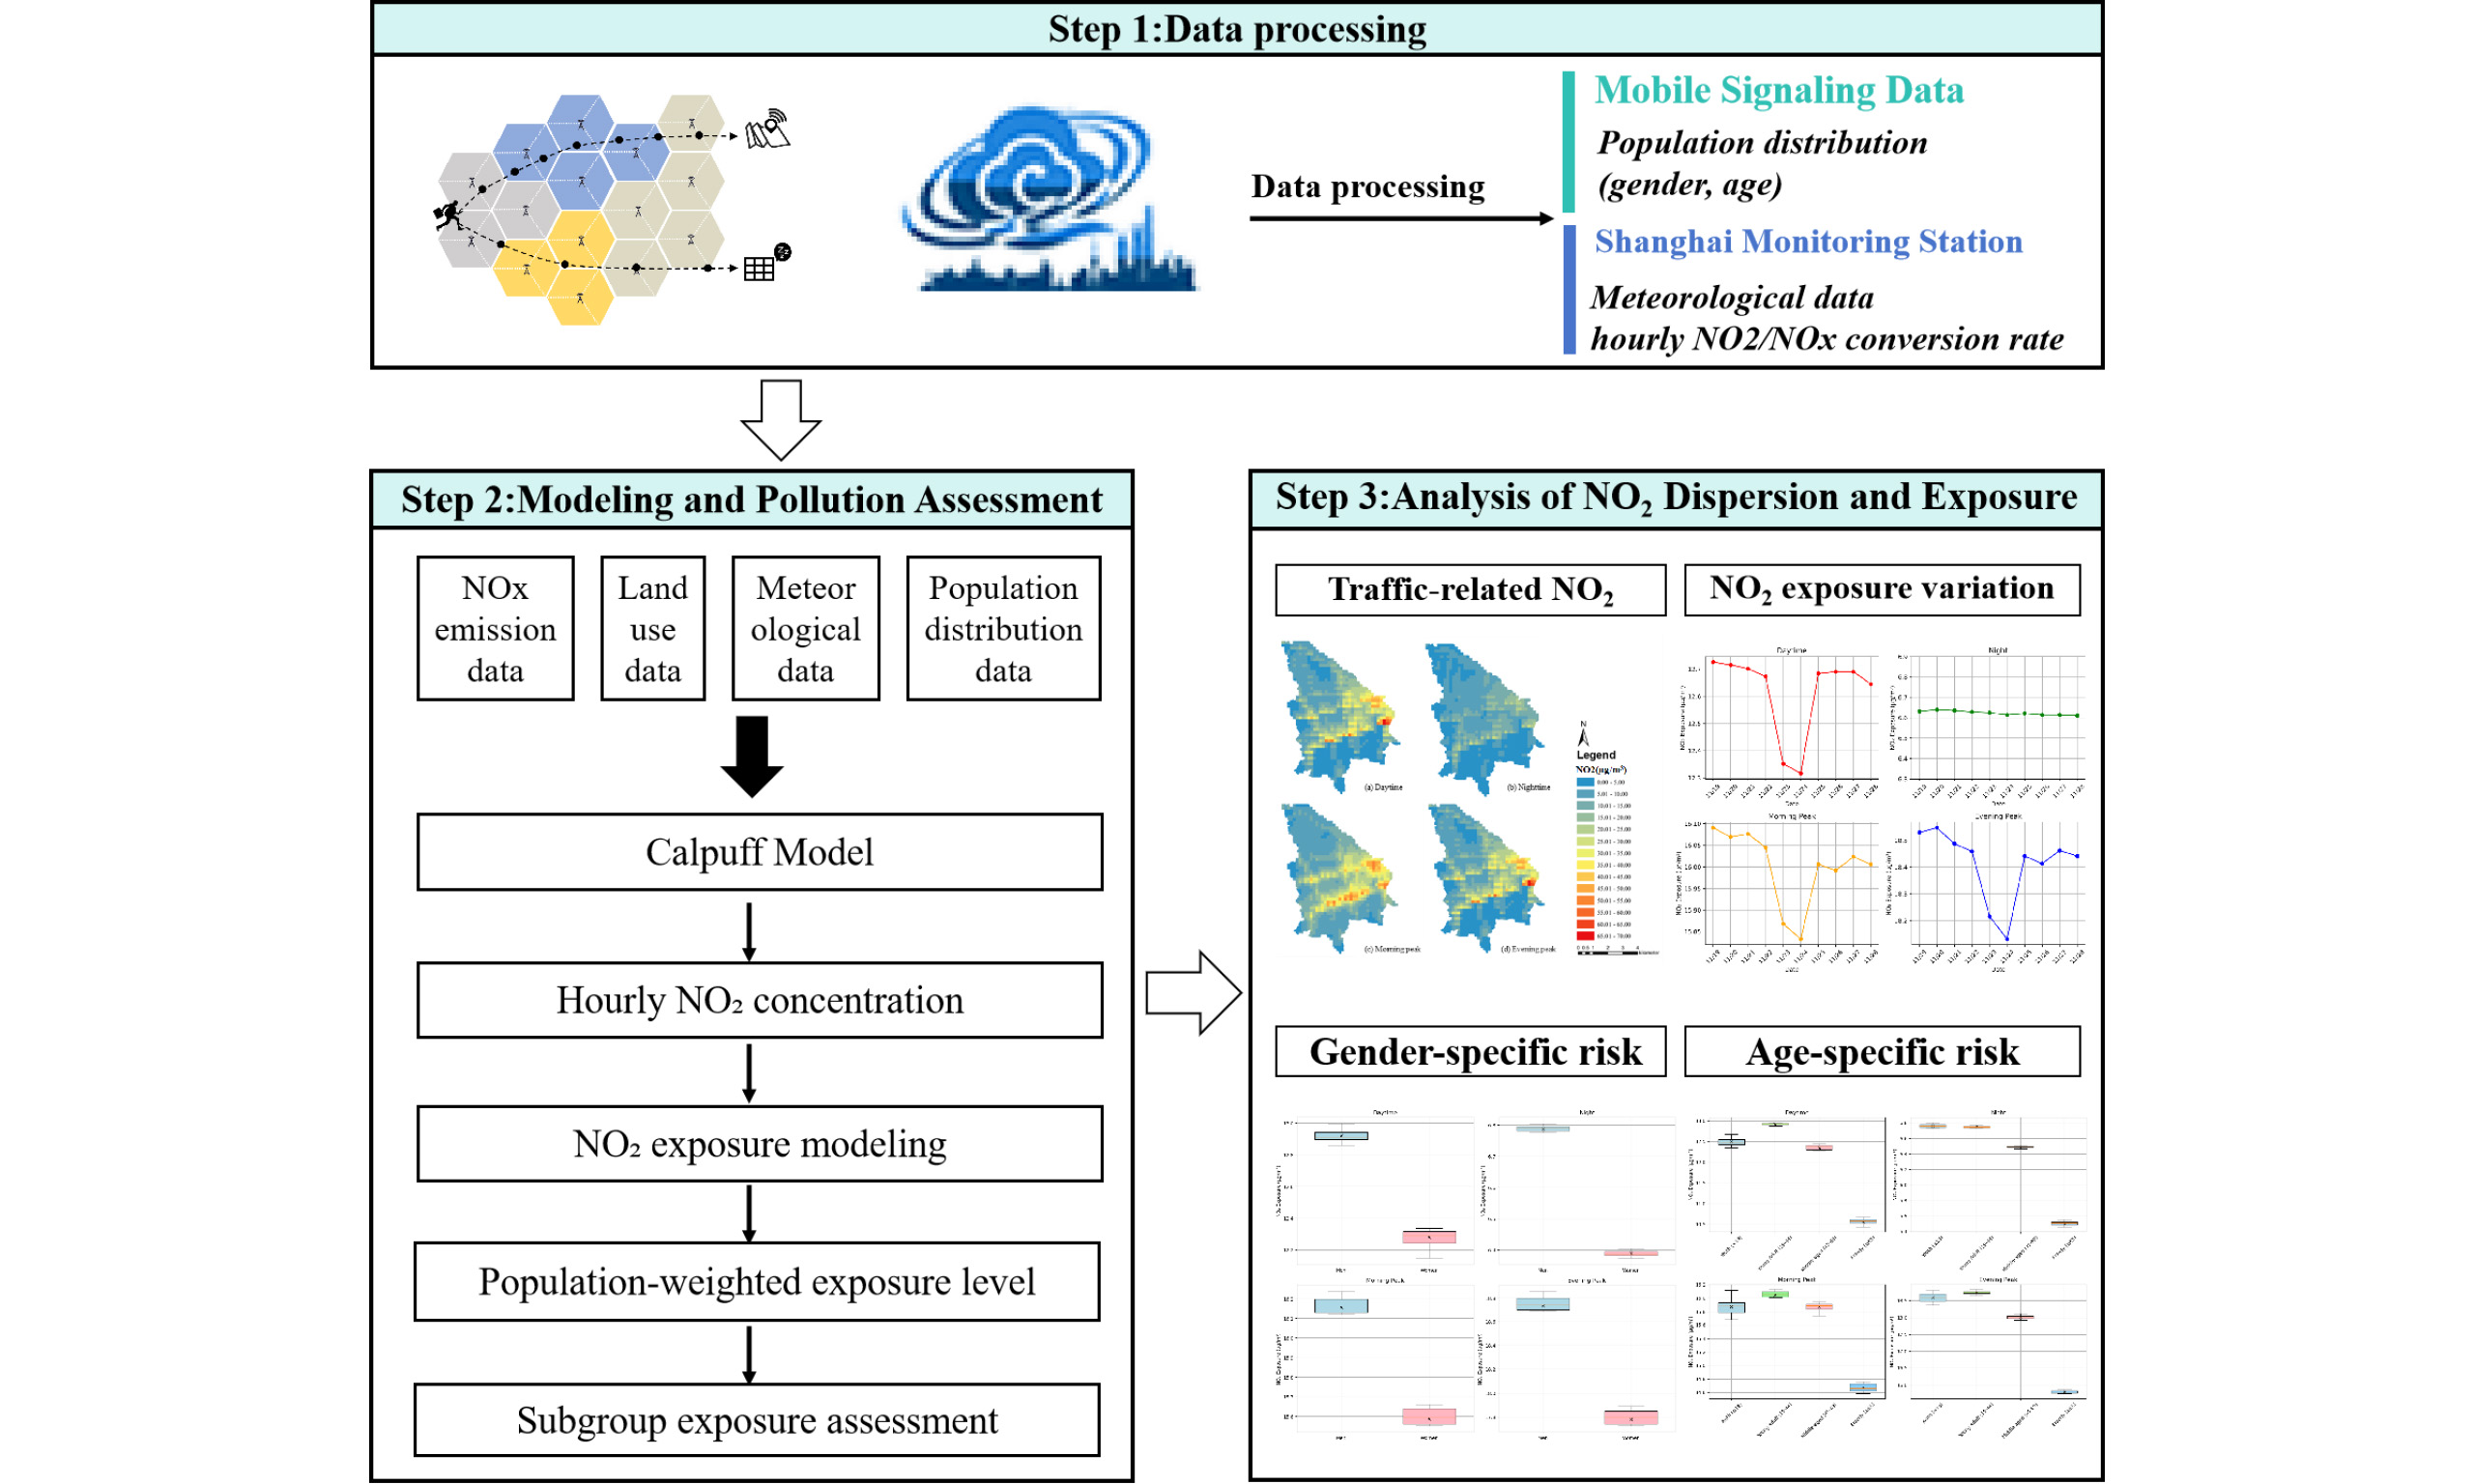
Motor vehicles are a major source of NO2 emissions, making traffic-related pollution a key target for urban air pollution control management. However, research on traffic-related NO2 exposure risks in China remains nascent, particularly regarding spatio-temporal variations and exposure inequities. To support evidence-based public health policies, it is essential to investigate group disparities in exposure across both spatial and temporal dimensions. This study utilizes the CALPUFF model and mobile phone signal data to examine the spatio-temporal patterns and population group disparities in NO2 exposure within Baoshan District, Shanghai, China. The findings reveal a bimodal diurnal pattern, with higher NO2 exposure levels on weekdays and lower levels on weekends. Areas with heavy traffic and high population density, such as port zones and the outer ring expressway, are identified as the most vulnerable. Furthermore, males and younger age groups experience greater exposure to traffic-related NO2, whereas elderly individuals are comparatively less exposed.
Keywords
INTRODUCTION
Nitrogen dioxide (NO2), a primary contributor to atmospheric acid deposition, photochemical smog, and other pollution issues, has increasingly become a key focus of air pollution control efforts. While emissions from industrial and domestic sources have steadily declined over time, those from transportation and other mobile sources have increased, reaching 6.336 million tons and accounting for over 51.3% of total NO2 emissions[1]. In urban areas, motor vehicles are a major source of NO2 pollution. Several studies have confirmed that short-term exposure to NO2 can result in airway hyperresponsiveness and impaired lung function, while long-term exposure may compromise immunity and heighten the risk of respiratory infections[2]. With rapid urbanization, NO2 pollution from road traffic is expected to rise, posing greater and more widespread risks to public health.
Exposure levels are influenced by both pollutant concentrations in the areas individuals occupy and the duration of time spent in those locations[3,4]. Thus, exposure is determined by the spatial and temporal distribution of both air pollutants and population presence. However, research on traffic-related exposure risk in China remains in its early stages, particularly regarding environmental justice. It remains unclear whether vulnerable groups are disproportionately affected or how such disparities evolve over time and space.
To address this gap, we propose an evaluation framework to assess the exposure risk from traffic-derived NO2 pollution, using Shanghai’s Baoshan District as a case study. Beyond pollution simulation, this study makes two additional contributions to the pollution modeling literature. First, it introduces a novel approach that integrates the CALPUFF atmospheric dispersion model with high-resolution mobile phone signaling data, enabling a dynamic exposure risk assessment that accounts for real-time human mobility patterns. The fine spatio-temporal resolution of these data allows for more accurate identification of vulnerable groups, especially during peak traffic hours and in high-emission zones, thereby significantly improving the accuracy and realism of exposure assessments. Second, from an environmental justice perspective, we investigate disparities in exposure across gender and age groups using time-resolved, activity-based population data rather than static census data. This approach uncovers hidden inequalities in traffic-related NO2 exposure that are often overlooked in traditional studies. Notably, this research pioneers the application of dynamic exposure modeling to assess intra-urban exposure inequities within a Chinese context, a topic that remains underexplored in current literature. Our findings provide both empirical evidence and methodological advancement that support the development of equity-oriented, fine-grained traffic pollution mitigation policies in rapidly urbanizing regions.
BACKGROUND
Application of the CALPUFF model
In current environmental impact assessments and air pollutant dispersion simulation studies, small- to medium-scale air quality models are widely applied in scenarios such as industrial emissions and urban pollution control. Commonly used models include AERMOD, ADMS (Atmospheric Dispersion Modelling System), and CALPUFF. Among these, AERMOD, a steady-state Gaussian model recommended by the U.S. Environmental Protection Agency (EPA), is extensively employed to simulate pollutant dispersion over short ranges and relatively flat terrains[5,6]. Its advantages include a well-established framework, computational efficiency, and ease of integration with meteorological data. However, AERMOD performs poorly under conditions of low wind speeds, complex topography, or non-steady-state atmospheric dynamics. ADMS, developed by the UK’s Cambridge Environmental Research Consultants (CERC), is also a steady-state model but features pollutant chemistry compared to AERMOD, demonstrating superior performance in urban micro-meteorological environments[7]. Nevertheless, ADMS is less suitable for long-range transport modeling and often incurs higher costs due to commercial licensing requirements.
In contrast, CALPUFF employs a non-steady-state Lagrangian puff modeling approach, enabling dynamic simulation of pollutant dispersion under changing wind directions and speeds. This makes it particularly suited for simulating long-distance transport, complex terrains, and coastal or land-sea interface pollution scenarios[8]. The model supports time-varying emission sources, dynamic meteorological inputs, and integration with diverse meteorological models[9], thereby enabling high-resolution spatiotemporal simulations. With its non-steady-state modeling capability and flexible input mechanisms, CALPUFF exhibits strong adaptability and accuracy, positioning it as one of the most promising tools for simulating complex pollution dispersion scenarios.
In the transportation sector, CALPUFF has been widely applied in four key areas: (1) spatiotemporal simulation of air pollution; (2) assessment of exposure risks to traffic-related pollutants; (3) investigation into emission inventories; and (4) analysis of traffic impact scenarios.
Regarding spatiotemporal simulation, research primarily targets pollutants closely associated with vehicular emissions, including nitrogen oxides (NOx[10,11], carbon monoxide (CO)[12], carbon dioxide (CO2)[13], sulfur dioxide (SO2)[14], and particulate matter (PM)[15,16]). Most studies examine the spatial and temporal distribution characteristics of two or three types of pollutants simultaneously.
For assessing exposure risks, a study in the Montreal region of Canada employed a four-stage traffic model, an emissions model, and CALPUFF to quantify the total emissions associated with residents' daily travel. The findings revealed that exposure risk increases significantly during outdoor activities, with average outdoor exposure levels 23%-44% higher than those indoors, regardless of indoor air quality conditions[17]. These results underscore the importance of incorporating travel trajectory data when evaluating individual exposure risks.
In the context of emission inventory development and traffic scenario analysis, it is crucial to allocate responsibility for emissions and formulate targeted mitigation strategies. The Montreal case study revealed that improving vehicle performance yields more substantial reductions in traffic-related pollution than investments in public transportation or other policy interventions[17].
Air pollution exposure assessment
Accurate assessment of air pollution exposure requires not only high-resolution measurements of pollutant concentrations but also a comprehensive understanding of human activity patterns[18]. Previous studies have largely focused on static population data, such as census statistics[19,20] and nighttime light imagery[21,22]. At the macro-static level, exposure risk is typically evaluated using indicators such as air quality concentration[23], population exposure intensity[24], and population-weighted exposure level (PWEL)[25]. However, air quality concentration alone does not account for the spatial heterogeneity of population distribution and has been criticized for its theoretical limitations[26]. Population exposure intensity is highly sensitive to population density, and substantial regional differences can lead to polarized exposure risk assessments. By comparison, PWEL is capable of capturing fine-scale spatial variations in exposure risk and is widely used in urban-level studies in China[27].
To overcome the limitations of macro-static assessments that overlook individual mobility, recent studies have incorporated dynamic population distribution data, such as travel surveys[28,29] and mobile phone signal data[30,31], to analyze exposure during various daily activities. For example, Guo et al. used mobile phone signal data to examine spatial and temporal variations in PM2.5 exposure risk among different socioeconomic groups in Shenzhen[32]. Additionally, studies investigating exposure during commuting have revealed that traffic congestion and longer commuting distances significantly increase pollution exposure levels[33].
Exposure equity and environmental justice
The principle of environmental justice asserts that all individuals, regardless of socioeconomic status, should have equitable access to public resources and share an equal burden of the health impacts resulting from environmental degradation[34]. Originating in the United States in the 1980s, the concept initially focused on the spatial inequities associated with the placement of polluting facilities in marginalized communities, exemplified by the 1,982 protests against the siting of a hazardous waste landfill in Warren County, North Carolina[35]. Over time, this framework has expanded to encompass disparities in air quality, access to transportation, flood risk management, and other dimensions, evolving into a critical interdisciplinary field that bridges social geography and public health.
A major subfield of environmental justice research is the assessment of equity in air pollution exposure, which seeks to identify disparities in exposure levels among different sociodemographic groups (e.g., by gender, age, income, ethnicity). Extensive evidence confirms that low-income and less-educated populations, along with children, the elderly, and ethnic minorities, often bear a disproportionate share of pollution exposure risks[36]. For example, studies in the United Kingdom have revealed a “Matthew effect” in air quality improvement policies, whereby middle- to high-income groups - who typically have lower baseline exposure - benefit disproportionately, while high-exposure, impoverished communities suffer unintended consequences during policy transitions. This trend risks deepening regional resource allocation conflicts and perpetuating environmental injustices.
However, current research on exposure equity is largely concentrated in developed nations, particularly the United States and the United Kingdom, with relatively limited attention to developing countries such as China. Amid China’s rapid urbanization and industrialization, air pollution from transportation, ports, and construction has become increasingly intertwined with daily human activity, intensifying exposure disparities across social groups. Consequently, examining group-specific disparities in traffic-related pollution exposure in Chinese cities is now a critical pathway for promoting health equity and enhancing environmental governance.
METHODS
Case study
Baoshan District, located in the northeastern part of Shanghai, falls under the city’s jurisdiction. Positioned at the confluence of the Yangtze River, Huangpu River, and Yunzaobang, the district features a 46.5-kilometer-long shoreline. Its port area connects to more than 400 ports across 164 countries and regions. As a key “waterway gateway” for Shanghai, Baoshan features an integrated transport infrastructure that links waterborne shipping with highways, railways, and urban roads [Figure 1]. Due to the area's distinctive industrial profile, a high concentration of warehousing and logistics enterprises has developed, resulting in frequent freight vehicle activity. Consequently, traffic-related air pollution in this district is notably severe.

Figure 1. Road network in the study area.
Simulation of traffic-derived NOx pollution using the CALPUFF model
The CALPUFF modeling system consists of four main components: a preprocessing module, a meteorological module (CALMET), a dispersion module (CALPUFF), and a postprocessing module (CALPOST) [Figure 2]. First, the preprocessing module converts land use and terrain elevation data into georeferenced formats compatible with the CALMET module. It also processes surface and upper-air meteorological data. Next, CALMET generates hourly, three-dimensional diagnostic fields of wind and temperature, which characterize the local geographic and meteorological conditions. Then, the CALPUFF module simulates the atmospheric dispersion of pollutants by generating air pollutant puffs and modeling their physical transport and chemical transformation in the atmosphere. Finally, the resulting concentration data are input into the CALPOST module, which produces geographic information output files suitable for statistical analysis and ArcGIS mapping.

Figure 2. Framework of the CALPUFF model.
The CALPUFF model utilizes a three-dimensional grid system, where the X, Y, and Z axes represent the east-west, north-south, and vertical directions, respectively. In this study, the Universal Transverse Mercator (UTM) coordinate system is adopted as the projection system, with the World Geodetic System 1984 (WGS-84) serving as the geodetic datum.
The study area encompasses a 25 × 27 km region centered on Baoshan District. The UTM coordinates of the origin are (337.160, 3459.74) km, and the horizontal grid resolution is set to 0.5 km. The domain consists of 50 grid points along the X-axis (east-west) and 54 grid points along the Y-axis (north-south). Vertically, the Z-axis includes 11 levels with top heights defined as 0, 20, 40, 80, 160, 320, 640, 1,200, 2,000, 3,000, and
Terrain elevation data are sourced from the USGS SRTM1 dataset. In the terrain preprocessing module, these data are converted into the “terrel.dat” file to represent the elevation of each grid cell. Land use data are derived from the USGS Global Land Cover Characteristics (GLCC) database, specifically the Asian region (USGS Global (Lambert Azimuthal) for Eurasia-Asia), with a spatial resolution of 1 km. These data are processed into the “lu.dat” file to describe land use across the grid.
Ground-level meteorological data are obtained from 11 observation stations across Shanghai, including Minhang, Baoshan, Jiading, Chongming, Xujiahui, Nanhui, Pudong, Jinshan, Qingpu, Songjiang, and Fengxian [Table 1]. The dataset spans from 00:00 on November 11 to 23:00 on November 30, 2019, and includes hourly records of wind speed (m/s), wind direction (degrees), temperature (Kelvin), cloud cover (tenths), cloud base height (hundreds of feet), surface pressure (hPa), and relative humidity (%). To maintain data continuity for model input, missing values in variables such as wind speed, temperature, or cloud cover were filled using linear interpolation based on the average of adjacent time points.
Basic information of ground meteorological observation stations in Shanghai
| Name | Station ID | X (km) | Y (km) | Observation site elevation (m) |
| Minhang | 58361 | 344.16 | 3,442.17 | 5.5 |
| Baoshan | 58362 | 352.12 | 3,473.96 | 5.5 |
| Jiading | 58365 | 332.97 | 3,471.03 | 4.4 |
| Chongming | 58366 | 357.11 | 3,504.45 | 4.3 |
| Xujiahui | 58367 | 350.56 | 3,451.95 | 4.6 |
| Nanhui | 58369 | 384.38 | 3,436.49 | 5 |
| Pudong | 58370 | 360 | 3,456.02 | 4.4 |
| Jinshan | 58460 | 342.03 | 3,400.84 | 5.2 |
| Qingpu | 58461 | 320.97 | 3,445.99 | 4 |
| Songjiang | 58462 | 331.42 | 3,435.02 | 4.2 |
| Fengxian | 58463 | 356.19 | 3,418.08 | 4.6 |
Upper-air meteorological data must include at least two observations per day, covering geopotential height, temperature, wind direction, and wind speed at the 500, 700, 850, 925, and 1000 hPa pressure levels. In this study, the data were sourced from publicly accessible datasets provided by the University of Wyoming (UWyo) and the National Oceanic and Atmospheric Administration (NOAA).
The road traffic emission data for Baoshan District [Table 2] were obtained from the Shanghai Environmental Monitoring Center. These data encompass all 4,511 major roads in the district and span the period from 00:00 on November 11 to 23:00 on November 30, 2019. The dataset includes information such as road identification number, date, time, vehicle type, road length, average vehicle speed, traffic flow, vehicle mileage, and NOx emissions.
Road traffic emission data for Baoshan district
| Field name | Explanation |
| Road ID | Unique identifier with no inherent meaning |
| Date | Format: “YY-MM-DD” |
| Time | Time unit: 1 h |
| Vehicle type | 0: Total; 11: Taxi; 21: Bus; 31: Shanghai-plated small passenger car; 32: Out-of-province small passenger car; 33: Shanghai C-plated small passenger car; 41: Small truck; 51: Large bus; 61: Large truck; 71: Container truck |
| Road length | Unit: kilometers |
| Average vehicle speed | Average speed of all vehicle types passing through the road per hour, unit: kilometers/hour |
| Traffic flow | Number of vehicles passing through the road per hour, unit: vehicles/hour |
| Vehicle mileage | Total vehicle mileage per hour, unit: vehicle kilometers/hour |
| NOx emissions | Total NOx emissions from all vehicle types per hour, unit: grams/hour |
Conversion rate of NO2/NOx
Nitrogen oxide (NOx) emissions are commonly used as a statistical metric for pollution source data. When air quality models are employed to simulate the spatial and temporal distribution of NO2 concentrations, and photochemical models are unable to predict NO and NO2 separately, NO2 concentrations are typically estimated based on NOx data. According to the Technical Guidelines for Environmental Impact Assessment - Atmospheric Environment, issued by the Ministry of Ecology and Environment of China, a conversion rate of 90% for NO2/NOx should be used when calculating hourly or daily mass concentrations of NO2. For annual average mass concentrations, an estimated conversion rate of 75% is recommended[37]. However, this standardized approach may constrain the flexibility of air pollution simulations, potentially leading to inaccurate assessments of ambient air quality. To improve this, Luo et al. proposed a proportional simulation method for converting NOx to hourly NO2 concentrations[38]. This method derives the
In this study, NO2 concentrations are derived using an hourly NO2/NOx conversion rate. The data used to calculate the conversion rates were obtained from traffic monitoring stations in Shanghai, as shown in Table 3. These include five roadside air monitoring stations, one airport station, and two port stations, covering the period from 00:00 on November 11 to 23:00 on November 30, 2019. The five roadside monitoring stations are located within the Outer Ring Road, while the airport and port stations are also situated nearby.
Basic information on Shanghai traffic monitoring stations
| Station name | Longitude | Latitude | Station type |
| Caoxi road roadside station | 121.435 | 31.174 | Roadside air station |
| Yan'an West road roadside station | 121.414 | 31.318 | Roadside air station |
| Gonghe new road roadside station | 121.449 | 31.277 | Roadside air station |
| Dongfang road roadside station | 121.528 | 31.212 | Roadside air station |
| National exhibition center | 121.467 | 31.207 | Roadside air station |
| Hongqiao airport station | 121.352 | 31.208 | Airport air station |
| Waigaoqiao port area - station 2 | 121.582 | 31.369 | Port air station |
| Waigaoqiao port area - station 4 | 121.654 | 31.331 | Port air station |
The conversion rate calculation formula is as follows, where i represents the hour, NO2i is the NO2 concentration at hour i, and NOXi is the NOX concentration at hour i:
Mobile phone signal data
The mobile phone signal dataset for Shanghai, covering the period from November 11 to November 30, 2019, was provided by JISMART (http://daas.smartsteps.com/, accessed on January 19, 2021). This dataset includes information on time, location, and users. Initially, it comprised data on approximately
Using data from the Seventh National Population Census as a reference, SPSS 26.0 was employed to perform a correlation analysis and paired sample t-test to compare the spatial distribution, gender composition, and age structure of the resident population in Shanghai, as inferred from the mobile signaling data. These analyses aimed to verify whether significant differences exist between the two datasets and, in turn, to assess the extent to which mobile signaling data can represent the demographic distribution of Shanghai's resident population.
Regarding population distribution, the proportions of residents in each administrative district, as derived from both the census and the mobile signaling data, are presented in Table 4. The Pearson correlation coefficient was calculated at 0.998, indicating a strong linear relationship. Furthermore, the significance level of the paired sample t-test was 0.999, which is much greater than the conventional threshold of 0.05, suggesting that there is no statistically significant difference between the two datasets at the 0.05 level. Overall, these results confirm that mobile signaling data can reliably represent the population distribution across Shanghai’s various districts.
Distribution of the resident population across different districts of Shanghai
| District | Seventh national census data (%) | Mobile signaling data (%) | District | Seventh national census data (%) | Mobile signaling data (%) |
| Huangpu | 2.73 | 2.14 | Baoshan | 9.22 | 9.42 |
| Xuhui | 4.59 | 3.79 | Jiading | 7.57 | 8.24 |
| Changning | 2.86 | 3.33 | Pudong | 23.44 | 25.66 |
| Jing'an | 4.03 | 3.8 | Jinshan | 3.4 | 2.46 |
| Putuo | 5.11 | 5.07 | Songjiang | 7.88 | 8.22 |
| Hongkou | 3.13 | 2.53 | Qingpu | 5.25 | 5.06 |
| Yangpu | 5.13 | 4.46 | Fengxian | 4.71 | 4.72 |
| Minhang | 10.95 | 11.1 |
In analyzing the gender structure, the gender ratio, defined as the number of males per 100 females, was used as the evaluation metric. Table 5 presents the gender ratios for each administrative district in Shanghai based on data from the Seventh National Population Census and mobile signaling data. The Pearson correlation coefficient between the two datasets was 0.794, indicating a strong positive correlation. The paired sample t-test result was 0.374, greater than the 0.05 significance level. This suggests there is no statistically significant difference in the mean gender ratios between the two datasets, supporting the conclusion that mobile signaling data can effectively represent gender structure across different districts in Shanghai.
Gender structure in Shanghai's administrative districts
| District | Seventh national census data | Mobile signaling data | District | Seventh national census data | Mobile signaling data |
| Huangpu | 107.59 | 101.63 | Baoshan | 109.51 | 100.13 |
| Xuhui | 95.06 | 95.02 | Jiading | 116.83 | 114.4 |
| Changning | 90.91 | 98.5 | Pudong | 108.04 | 103.32 |
| Jing'an | 95.19 | 96.79 | Jinshan | 113.74 | 117.63 |
| Putuo | 97.14 | 101.68 | Songjiang | 114.7 | 107.42 |
| Hongkou | 97.17 | 96.43 | Qingpu | 120.39 | 120.64 |
| Yangpu | 97.91 | 103.05 | Fengxian | 116.78 | 117.26 |
| Minhang | 107.72 | 93.6 |
Regarding age structure, a comparative analysis was conducted for three age groups (0-14, 15-64, and
Age structure in Shanghai's administrative districts
| District | Seventh national census data | Mobile signaling data | ||||
| 0-14 | 15-65 | ≥ 65 | 0-14 | 15-65 | ≥ 65 | |
| Huangpu | 8.67 | 72.84 | 18.48 | 8.74 | 73.72 | 17.54 |
| Xuhui | 9.79 | 69.6 | 20.61 | 9.39 | 71.48 | 19.13 |
| Changning | 8.89 | 70.46 | 20.65 | 9.11 | 71 | 19.89 |
| Jing'an | 9.31 | 68.72 | 21.97 | 10.78 | 70.2 | 19.02 |
| Putuo | 9.39 | 69.48 | 21.12 | 10.04 | 69.34 | 20.62 |
| Hongkou | 8.19 | 68.58 | 23.23 | 8.53 | 69.2 | 22.27 |
| Yangpu | 8.84 | 69.31 | 21.85 | 9.12 | 70.47 | 20.41 |
| Minhang | 10.86 | 75.11 | 14.02 | 9.57 | 76.91 | 13.52 |
| Baoshan | 10.01 | 74.61 | 15.39 | 8.54 | 74.72 | 16.74 |
| Jiading | 9.81 | 78.12 | 12.07 | 9.62 | 77.39 | 12.99 |
| Pudong | 10.48 | 74.53 | 14.99 | 10.03 | 76.32 | 13.65 |
| Jinshan | 9.22 | 73.75 | 17.03 | 9.54 | 70.75 | 19.71 |
| Songjiang | 10.7 | 78.39 | 10.91 | 10.76 | 76.87 | 12.37 |
| Qingpu | 8.86 | 79.58 | 11.56 | 9.31 | 76.79 | 12.9 |
| Fengxian | 9.28 | 76.96 | 13.76 | 9.21 | 77.92 | 12.87 |
Traffic-derived NO2 pollution exposure assessment
This study adopted the population-weighted exposure level (PWEL) as the indicator for assessing exposure to traffic-derived NO2 pollution, as proposed by Fu and Kan[25]. PWEL was calculated by combining predicted NO2 concentrations with dynamic population distribution data. The CALPUFF model was used to estimate NO2 concentrations for each standardized 1,000 × 1,000 m grid across different time periods. Hourly gridded population data were obtained from mobile phone records. PWEL was then used to evaluate the risk of exposure to traffic-derived NO2 pollution in each grid over various time intervals. The formula is as follows:
where i denotes the grid index, n is the total number of grids, Ei represents the potential population exposure in grid i, Pi is the population of grid i during a certain period, and Ci is the NO2 concentration in grid i. The overall population-weighted exposure level of traffic-derived NO2 pollution in Shanghai was assessed using Formula (3), where E represents the total potential exposure across the city:
RESULTS
Temporal variation in the NO2/NOx conversion rate in Shanghai
The NO2/NOx conversion rate in Shanghai predominantly falls within the range of 0.3-0.7 [Figure 3], which is comparable to the range reported in Seoul (0.4-0.8)[38]. However, it significantly deviates from the value suggested by China's Ministry of Ecology and Environment, as previously mentioned. Therefore, estimating NO2 concentrations using hourly data from air quality monitoring stations and a ratio-based hourly simulation method is crucial for accurately modeling the temporal and spatial distribution of NO2 exposure risk.

Figure 3. Temporal variation in the NO2/NOx conversion rate in Shanghai. (The broken line represents the mean hourly NO2/NOx conversion rate, and the grey shading area indicates the full range of hourly values).
Spatiotemporal distribution of traffic-related NO2
There is significant spatiotemporal variability in NO2 concentrations related to road traffic. Temporally, NO2 concentrations exhibit a “bimodal” distribution that aligns with the typical daily traffic pattern: the highest concentrations occur during morning and evening rush hours, reaching 15.51 and 18.36 μg/m3, respectively. Concentrations are slightly lower during the daytime, averaging around 12.62 μg/m3, and drop to their lowest levels at night, averaging just 7.12 μg/m3.
Spatially, NO2 concentrations tend to decrease from the center of the road outward to both sides. Overall, higher concentrations are observed along major roadways, including the east-west Shanghai Ring Expressway (G1503) and Outer Ring Expressway (S20), as well as the north-south Hutai Road and Yunchuan Road. Elevated concentrations are also found near warehousing and logistics hubs, such as Baoyang Road at the confluence of two rivers. Furthermore, areas prone to frequent traffic congestion, such as expressway toll stations, entrance and exit ramps, and overpasses, exhibit higher pollutant levels compared to other road segments [Figure 4].

Figure 4. Spatiotemporal simulation results of road traffic-related NO2.
Disparities in exposure and inequality
Wang et al. explored disparities in air pollution exposure and inequality from three aspects: temporal variation, spatial variation, and group disparity[39]. Building on their framework, this paper integrates all three dimensions, with a particular focus on examining the underlying factors that influence the impact of traffic-derived NO2 pollution on vulnerable populations.
Temporal variation
Exposure to traffic-related NO2 pollution peaks during rush hours, with the highest levels occurring in the evening, followed by the morning rush, daytime, and the lowest levels at night. Compared to other time periods, the evening peak displays a greater variability in exposure levels [Table 7]. This suggests that the degree to which permanent residents of Baoshan District are affected by traffic pollution during this period varies significantly, resulting in unequal levels of environmental exposure within residential areas.
Summary statistics of traffic-derived NO2 pollution exposure (µg/m3)
| Period | Mean | Minimum | Maximum | Standard deviation |
| Daytime | 12.62 | 12.31 | 12.75 | 0.15 |
| Nighttime | 6.62 | 6.58 | 6.67 | 0.02 |
| Morning peak | 16.00 | 15.83 | 16.14 | 0.10 |
| Evening peak | 18.41 | 18.13 | 18.63 | 0.15 |
This study postulates that such disparities are associated with the travel behavior typical of the evening peak. This period is characterized by more dispersed travel times, a higher proportion of non-commuting trips, and greater diversity in travel patterns. In contrast to relatively uniform commuting routines of the morning rush, the evening rush reveals substantial heterogeneity in individuals’ exposure to traffic-derived NO2 pollution.
In terms of daily variation, exposure is higher on weekdays than on weekends [Figure 5]. This is primarily due to rigid weekday travel patterns driven by work and school schedules, resulting in dense traffic, frequent vehicle use, and elevated emissions. Consequently, residents are often forced to travel through heavily polluted areas. On weekends, travel tends to be more flexible and discretionary, with a reduction in travel frequency and lower concentrations of traffic-related NO2 pollution, thereby decreasing exposure risk. However, this weekday-weekend distinction is less evident at night due to the continued operation of freight and logistics services. Nighttime travel tends to be limited in scope, and there is no significant variation in pollution exposure between weekdays and weekends, leading to a relatively stable risk level.

Figure 5. Time variation in traffic-derived NO2 pollution exposure risk.
Spatial variation
In this study, the mean-standard deviation classification method is employed to depict the spatial distribution characteristics of traffic-derived NO2 pollution exposure risk, with an emphasis on identifying areas with extreme exposure values. The mean exposure level serves as a baseline, and each grid is classified into one of four risk levels: low risk (0.5 and ≤ 1.5 SD), high risk (> 1.5 and ≤ 2.5 SD), and critical risk
Areas with high traffic pollution exposure are concentrated in the southern part of Baoshan District, specifically including Wusong Street and Baoshan Town near Wusong Port, Gucun Town near Baoan Road-Hutai Road, and Yanghang Town near the Yunchuan Road overpass on the Outer Ring Road [Figure 6]. These locations are not only densely populated but are also surrounded by major arterial roads that function as the main external passages for Baoshan District, making them particularly vulnerable to disruption by transit traffic.

Figure 6. Spatial variation in traffic-derived NO2 pollution exposure risk.
Group disparity
To investigate group disparity, user attribute information, including gender and age, was extracted from mobile phone signal data. Age was categorized into four groups: juvenile (≤ 18 years), young adults
Gender
Overall, males experienced a higher risk of exposure to traffic-derived NO2 pollution compared to females [Figure 7]. The gender disparity in exposure was most evident during peak hours, when the average NO2 exposure risk for males reached 0.76 μg/m3, approximately 4.59% higher than that of females. During the daytime hours, the exposure risk for males was around 0.61 μg/m3, about 6.20% higher than that of females. The lowest disparity occurred at night, with a male exposure level of 0.40 μg/m3, approximately 9.53% higher than that of females.

Figure 7. Gender-specific assessment of exposure risk to traffic-derived NO2 pollution.
In Baoshan District, heavy industries such as steel smelting and port cargo handling are predominantly male-dominated. These occupations typically require early-morning start times and late-evening finishes, coinciding with urban traffic peak hours. During the morning commute, male workers traveling to industrial sites are exposed to elevated NO2concentrations due to the simultaneous start of industrial productions and increased freight vehicle activity in industrial zones. Consequently, significant pollution exposure occurs both en route and within the workplace. Similarly, at the end of the workday, another surge in pollution levels occurs in industrial districts and surrounding roadways, leading to additional NO2 exposure for male workers. In contrast, female employment in such high-exposure industries is relatively low, contributing to their lower pollution exposure.
Male commuters are more inclined to drive private vehicles or use company-operated shuttles along expressways and arterial roads[40]. During rush-hour congestion, these drivers are immersed in environments with elevated vehicular exhaust emissions, where NO2concentrations are significantly higher than during off-peak hours. Additionally, male commuters typically have longer commuting distances and durations, leading to greater cumulative inhalation of air pollutants. By contrast, female commuters more often use public transportation, such as subways, which are electrically powered and primarily operate underground, thereby minimizing direct exposure to surface-level vehicle emissions. Shorter travel distances further limit exposure duration for female commuters. Thus, even during the same peak-hour periods, differences in commuting patterns and distance contribute to higher NO2exposure among male commuters.
Beyond commuting, occupational and lifestyle differences further intensify gender disparities in pollution exposure during high-risk periods. Men are more likely to engage in occupations necessitating substantial outdoor or road-based activities - such as logistics, taxi driving, and express delivery - which typically peak during morning and evening rush hours. These jobs inherently involve prolonged exposure to ambient air pollution at times when urban air quality is most deteriorated. In contrast, a greater proportion of women are employed in indoor settings or benefit from flexible work schedules, enabling some to avoid peak commuting times altogether, particularly due to family caregiving responsibilities. As a result, the differences in daily activity patterns between men and women substantially contribute to the observed disparities in cumulative NO2exposure.
Age
Different age groups exhibit varying levels of susceptibility to traffic-related NO2 pollution, with the elderly experiencing the lowest exposure risk. Specifically, recorded exposure concentrations during different time periods were 10.58, 5.51, 14.67, and 15.78 μg/m3, respectively [Figure 8].

Figure 8. Age-specific risk assessment of exposure to road traffic-derived NO2 pollution.
The observed disparities in NO2 exposure across age groups are primarily attributable to differences in travel behavior. Working-age adults are frequently present in traffic environments during peak periods, when vehicular emissions are most intense. In contrast, older adults typically avoid peak-hour travel or remain within residential areas. Motor vehicle emissions are a major contributor to urban NO2 pollution, accounting for over 40% of total nitrogen oxide emissions in Shanghai[41]. Consequently, the substantial volume of NOx generated by commuter traffic significantly elevates ambient NO2 concentrations during rush hours. Individuals who commute during these high-exposure windows - mainly young and middle-aged adults - therefore experience markedly higher levels of NO2 inhalation.
On the other hand, older adults and retired middle-aged individuals, whose activities are largely limited to indoor or community spaces[42], benefit from the shielding effects of buildings and the attenuation of pollutants over distance, resulting in significantly lower exposure levels compared to individuals in close proximity to traffic corridors. Although office workers spend much of the day indoors, their cumulative NO2 exposure is substantially increased by elevated concentrations during commuting periods. Adolescents, while spending most school hours indoors, still experience brief but significant exposure during travel to and from school. Thus, variations in daily activity patterns and mobility rhythms among age groups play a critical role in shaping the total NO2 exposure accumulated throughout the day.
Comparative analysis
This study finds a high level of consistency with existing literature regarding the weekend effect on NO2 pollution and the exposure characteristics of the elderly population. Regarding the weekend effect, Pommier (2023)[43] demonstrated that NOx emissions in UK cities were 1.54 to 3.05 times higher on weekdays than on weekends. Similarly, Demetillo et al. (2021)[44], based on TROPOMI data, confirmed a significant decrease in NO2 concentrations in US cities on weekends, largely due to reduced heavy-duty diesel vehicle activity. These findings align with the weekend effect observed in this study. Together, the studies suggest that traffic emissions, particularly from freight transport and commuting, are the main contributors to elevated weekday NO2 levels.
Concerning gender differences, the findings align with Mo et al. (2023), who found that men face higher NO2 exposure risks due to occupational factors (e.g., transportation and outdoor work) and longer durations of outdoor activity, based on a Chinese cohort study[45]. Hu et al. (2020) reported similar results in a multi-province survey across China[46]. However, this contrasts with the findings of Kim et al. (2019) in South Korea, which indicated that women experienced significantly higher average NO2 exposure than men (30.11 vs. 25.83 µg/m3), potentially due to indoor environmental exposures such as cooking fuel pollution[47]. Furthermore, Chau et al. (2002) in Hong Kong noted that long-distance commuters (typically male) are overexposed, but also suggested that women might encounter different exposure pathways related to residential environments or domestic responsibilities[48]. In addition, Setton et al. (2010), in a simulation study, found no gender differences at all, highlighting how exposure assessment methods (e.g., variations in spatial-temporal resolution between satellite data and individual monitoring) and differences in pollution source structures (traffic-dominant versus mixed-source cities) may influence observed outcomes[49].
The finding that elderly individuals experience lower NO2 exposure is consistent with most literature.
In summary, the weekend effect and the exposure characteristics of the elderly observed in this study align with findings from various global regions. However, the complexity of gender-based exposure differences underscores the need to account for regional cultural contexts (e.g., occupational roles and family responsibilities) and exposure pathways (i.e., the interplay between occupational and indoor microenvironment exposures). Future research could benefit from integrating high-resolution pollution data with individual behavioral trajectories (e.g., GPS-based activity patterns) to further reveal the mechanisms driving exposure disparities among population subgroups.
DISCUSSION
Spatiotemporal heterogeneity of conversion processes
The derived NO2/NOx ratio range (0.3-0.7), based on Luo Minghan's proportional simulation method, reflects the dynamic interplay between localized emission characteristics and atmospheric chemical processes in megacities such as Shanghai. This complexity is not adequately captured by national standard rates. Specifically:
Enhanced Photochemical Conversion: During summer in Shanghai, elevated temperatures, high relative humidity, and high solar radiation increase O3 and VOC concentrations, which in turn promote the conversion of NO to NO2[50,51]. This process pushes the NO2/NOx ratio toward the upper limit (0.7).
Nonlinear Effects of Particulate Matter: During heavy pollution episodes, heterogeneous reactions on PM2.5 surfaces, such as soot-catalyzed NO oxidation, further enhance NO2 formation, contributing to an elevated ratio[51].
Temporal Resolution Advantage: The national standard relies on annual averages, which overlook daily variations. Studies have shown that midday O3 peaks can raise the NO2/NOx ratio to 0.6-0.7, while nighttime values drop to 0.3-0.4. These temporal patterns are supported by monitoring data[52].
This broader ratio range more accurately captures the chemical complexity in high-emission, high-ozone urban environments, justifying its adoption for policy-relevant urban air quality modeling.
Group exposure disparities
This study reveals significant disparities in traffic-related NO2 exposure across gender and age groups, highlighting the significance of activity-path-based environmental exposure assessment in environmental equity research.
Gender disparities
Gender-based differences in exposure to traffic pollution can be explained by the concept of the social stratification of road networks, as proposed by the Institute of Human Geography[53]. Urban roads, as dynamic spaces of activity, serve both as infrastructure and public services, enabling access to various destinations. However, travel patterns differ substantially between genders due to factors such as family responsibilities, the division of labor, and environmental conditions, leading to gender-based segregation in mobility patterns and, ultimately, social stratification[54].
Previous research has shown that women, who often bear the primary responsibility for household chores, tend to choose jobs located closer to home. Consequently, their daily mobility is subject to various limitations and constraints[55]. As a result, women's travel typically involves short-distance, environmentally friendly trips, often along urban routes that include access to public transportation[56]. In contrast, men generally have fewer domestic responsibilities and greater career mobility. Their longer commuting distances lead to a preference for high-capacity urban arterials and expressways to optimize travel efficiency.
Furthermore, the division of labor contributes to occupational disparities in traffic exposure. In Shanghai, men dominate employment in the transportation, warehousing, postal, and construction sectors. Specifically, men account for 72% of workers in transportation-related industries and as much as 83% in construction[57]. Given these occupational trends and mobility behaviors, men experience greater exposure to traffic-related pollution and are therefore more vulnerable to its health impacts.
Age disparities
Significant differences in NO2 exposure were also observed across age groups. Older adults experienced the lowest levels of exposure across all time periods, primarily due to their limited, short-distance, and temporally concentrated travel patterns. Their reliance on walking or cycling, along with a tendency to remain within community-based areas, further reduced their contact with high-pollution zones such as highways. In contrast, working-age adults (19-44 years), whose mobility is largely dictated by rigid commuting schedules and occupational demands, faced the highest NO2 exposure, particularly during evening peak hours when pollutant concentrations exceeded daily averages.
These exposure disparities were most pronounced during the evening peak, likely due to the diversity of travel purposes and the wide dispersion of routes, which exacerbate inequities across age groups.
Compared to other age groups, older adults primarily engage in non-commuting travel, which is characterized by lower frequency, shorter distances, and briefer durations. On average, the elderly make 2.03 trips per day, slightly fewer than the 2.16 daily trips reported in Shanghai's Fifth Comprehensive Traffic Survey[58]. Regarding travel distance and duration, juveniles, young adults, middle-aged adults, and older adults average 5.4, 7.7, 7.1, and 2.8 km per day, respectively. Corresponding average travel times are 24.4, 33.6, 31.7, and 16.2 min, respectively. Clearly, the elderly travel shorter distances and for less time than all other age groups.
Additionally, Huang et al. found that the elderly’s activities are largely confined to their neighborhoods, with walking being the predominant mode of transport, supplemented by public transit and bicycles. When feasible, approximately 80% of seniors prioritize walking[59]. This pattern results in a strong preference for low-grade roads, such as neighborhood and branch roads, and minimal use of expressways and arterial roads. As a result, the elderly group is exposed to significantly lower levels of traffic-related pollution compared to other groups.
It is noteworthy that the greatest disparity in exposure risk among age groups occurs during evening peak hours, with a maximum difference of 2.88 μg/m3, followed by daytime (up to 2.27 μg/m3). Differences during the morning peak and nighttime are relatively smaller, at 1.37 and 1.25 μg/m3 respectively. These variations align with age-specific travel behavior. For instance, older adults demonstrate a reverse parabolic pattern in travel intensity - peaking during the morning and evening and tapering off in the afternoon[60].
Uncertainty analysis
This study integrates the CALPUFF dispersion model with dynamic mobile phone signaling data to enhance the spatiotemporal resolution of exposure assessments. However, several sources of uncertainty remain and warrant further refinement:
(1) Data Representativeness and Sampling Bias
Although the spatial distribution, gender, and age structure of the mobile phone signaling data are broadly consistent with the Seventh National Population Census, the sample covers only 23.5% of the city’s population. This may lead to underrepresentation of low-mobility groups (e.g., older adults or children). Furthermore, the inference-based classification of gender and age may introduce additional errors.
(2) Uncertainty in NO2 Concentration Estimation
NO2 concentrations are estimated from NOx emissions using hourly NO2/NOx conversion rates (range:
(3) Regional Limitations
This study focuses on Baoshan District, an industrial area on the outskirts of Shanghai characterized by freight-intensive transportation, which may limit the generalizability of the findings to central urban areas or non-port cities. Nevertheless, the proposed methodology is highly transferable and offers a replicable framework for application in other regions.
(4) Temporal Resolution Constraints
While hourly simulations effectively capture broad trends in dynamic exposure, they lack the resolution needed to detect minute-level pollution peaks, such as those occurring in traffic-congested areas. Future work could incorporate higher-frequency trajectory data and real-time monitoring to refine exposure modeling.
CONCLUSIONS
Key findings
This study, using Shanghai’s Baoshan District as a case study, developed a dynamic exposure risk assessment framework by integrating the CALPUFF dispersion model with mobile phone signaling data, systematically revealing the spatiotemporal distribution patterns and demographic disparities associated with traffic-related NO2 pollution. The key findings include:
Temporal Dimension: NO2 exposure exhibited a clear bimodal diurnal pattern, with noticeable weekday-weekend variations. Concentrations peaked during the morning and evening rush hours, while weekend levels remained consistently lower. This “rhythmic” pattern highlights the strong correlation between traffic emissions and human activity, providing a quantitative basis for “time-targeted pollution control”.
Spatial Dimension: Areas of high exposure risk clustered around ports, logistics corridors, and the outer-ring expressways, forming a spatial distribution pattern closely tied to the city’s functional zoning. This spatial correlation suggests that uneven transportation infrastructure may contribute to environmental inequities.
Demographic Dimension: Exposure risks varied significantly by gender and age group. Males and working-age adults (19-44 years) experienced the highest exposure risks, whereas older adults faced the lowest risks due to their infrequent and short-distance travel behavior. These disparities reflect differences in mobility patterns and highlight the “social-behavioral and structural” nature of traffic pollution exposure.
Policy implications
Time-based traffic management strategies
Traffic-related NO2 exposure peaks during morning and evening rush hours, especially when freight and commuter traffic overlap (e.g., during the evening peak). This overlap results in elevated NO2 concentrations and higher exposure levels for local residents. To address this, dynamic traffic management strategies should be implemented to reduce pollutant loads during critical time windows. For example, staggered commuting schedules and time-specific restrictions on heavy-duty diesel trucks should be enforced during weekday peak hours, particularly in densely populated areas along major transport corridors such as the Outer Ring Expressway. Diverting freight traffic away from peak residential travel times can help reduce cumulative emissions, flatten intra-day pollution peaks, and limit short-term NO2 buildup.
Targeted protection for high-exposure populations
Exposure assessments reveal that highly mobile groups, particularly working-age males, are disproportionately affected by traffic-related NO2 pollution, while elderly individuals - due to their limited mobility - experience the lowest exposure. To address this disparity, targeted interventions should prioritize high-exposure populations to reduce health risks and promote environmental equity. For example, individuals with frequent commutes and high exposure levels should benefit from tailored protective measures. Simulation results highlight persistently high NO2 concentrations along key corridors in the southern part of Baoshan District, such as Baoyang Road and the Outer Ring Expressway near the port area. Installing air purification systems and vegetative buffers along these heavily trafficked routes could help reduce inhalation risks for passersby. Additionally, promoting flexible work arrangements can lower exposure during peak hours, and enhanced occupational safety guidelines should be established for outdoor workers in high-exposure zones. These tailored strategies can significantly reduce risks for working-age individuals while also accommodating the needs of more vulnerable groups, thereby strengthening population-wide resilience to air pollution.
Spatial optimization of high-risk zones
Modeling results identify specific high-risk zones in the southern part of Baoshan District where traffic-related pollution exposure is spatially concentrated. These areas often serve dual roles as transportation hubs (e.g., ports, logistics parks, and expressway intersections) and high-density residential communities, compounding exposure risks. To mitigate these effects, spatial planning and environmental regulation should be employed to optimize land use. On one hand, green infrastructure should be expanded in high-pollution areas, such as logistics corridors and port-adjacent neighborhoods. For example, establishing vegetation barriers along Baoyang Road and the Outer Ring Expressway can help intercept and dilute vehicle emissions before they reach residential areas. On the other hand, land use and functional zoning policies should be refined to reduce the co-location of emission-intensive roads with sensitive land uses such as housing, schools, and hospitals. Strategic urban planning that spatially decouples residential areas from high-emission corridors will be key to lowering long-term exposure levels and addressing spatial inequities in environmental health outcomes.
Limitations
Limited Spatial Applicability: This study focuses on Baoshan, an industrial logistics-oriented district, which may limit the applicability of the findings to urban cores or non-port cities.
Data Constraints: The analysis relies on mobile signaling data to infer group attributes and movement trajectories, which may lack precision. More granular data sources (e.g., travel diaries or wearable devices) are needed to enhance accuracy.
Unquantified Health Impacts: While the study assesses exposure levels, it does not directly model the causal links between exposure and health outcomes.
DECLARATIONS
Acknowledgments
The authors express gratitude to all those who have provided assistance during the writing of this thesis.
Authors’ contributions
Conceptualization, formal analysis: Wang, S.; Luo, X.; Liu, C.
Software: Wang, H.; Wang, Q.; Fu, Y.
Investigation, resources: Fu, Q.; M.Y.
Data curation: Fu, Q.; Guo, X.; Yi, M.
writing - review and editing: Wang, S.; Fu, Y.; Luo, X.; Liu, C.
Supervision: Luo, X.; Liu, C.
Visualization: Wang, H.
Methodology, writing - original draft, validation: Wang, S.
Project administration, funding acquisition: Luo, X.
All authors have read and approved the published version of the manuscript.
Availability of data and materials
The data presented in this study are available from the corresponding authors upon reasonable request. The data are not publicly available due to privacy restrictions.
Financial support and sponsorship
This research was sponsored by the General Project of NSFC (No.52372340) and the International Cooperation and Exchanges NSFC (No.72061137071).
Conflicts of interest
Dr. Luo, X. is the Guest Editor of the Special Issue “Challenges and Opportunities for Transport Carbon Neutrality”. Dr. Luo was not involved in any steps of the editorial processing of this manuscript, including reviewer selection, manuscript handling, or decision making. The funders had no role in the design of the study; in the collection, analyses, or interpretation of data; in the writing of the manuscript; or in the decision to publish the results, while the other authors have declared that they have no conflicts of interest.
Ethical approval and consent to participate
Not applicable.
Consent for Publication
Not applicable.
Consent for publication
© The Author(s) 2025.
REFERENCES
1. Ministry of Ecology and Environment of China. State of the ecological environment bulletin. 2020. Available from: https://www.mee.gov.cn/hjzl/sthjzk/zghjzkgb/ [Last accessed on 19 May 2025].
2. Anenberg, S. C.; Mohegh, A.; Goldberg, D. L.; et al. Long-term trends in urban NO2 concentrations and associated paediatric asthma incidence: estimates from global datasets. Lancet. Planet. Health. 2022, 6, e49-58.
4. Smith, K. R. Air pollution assessing total exposure in the United States. Environ. Sci. Policy. Sustain. Dev. 1988, 30, 10-38.
5. Afzali, A.; Rashid, M.; Afzali, M.; Younesi, V. Prediction of air pollutants concentrations from multiple sources using AERMOD coupled with WRF prognostic model. J. Clean. Prod. 2017, 166, 1216-25.
6. Claggett, M. Comparing predictions from the CAL3QHCR and AERMOD models for highway applications. Transport. Res. Rec. 2014, 2428, 18-26.
7. Carruthers, D.; Holroyd, R.; Hunt, J.; et al. UK-ADMS: a new approach to modelling dispersion in the earth's atmospheric boundary layer. J. Wind. Eng. Ind. Aerod. 1994, 52, 139-53.
8. Scire, J. S.; Strimaitis, D. G.; Yamartino, R. J. A user’s guide for the CALPUFF dispersion model. Concord, MA: Earth Tech Inc., 2000. Available from: https://www.eoas.ubc.ca/courses/atsc507/ADM/calpuff/documentation/CAL-v5/CALPUFF_UsersGuide.pdf [Last accessed on 19 May 2025].
9. Ghannam, K.; El-Fadel, M. Emissions characterization and regulatory compliance at an industrial complex: an integrated MM5/CALPUFF approach. Atmos. Environ. 2013, 69, 156-69.
10. Ergun, P.; Kara, M.; Bayram, A.; Dumanoglu, Y.; Altiok, H.; Elbir, T. Application of an activity based approach to assess air quality from mobile sources in an urban center. Curr. Environ. Eng. 2014, 1, 64-72.
11. Joo, S.; Oh, C.; Lee, S.; Lee, G. Assessing the impact of traffic crashes on near freeway air quality. Transp. Res. Part. D. 2017, 57, 64-73.
12. Charabi, Y.; Abdul-Wahab, S.; Al-Rawas, G.; Al-Wardy, M.; Fadlallah, S. Investigating the impact of monsoon season on the dispersion of pollutants emitted from vehicles: a case study of Salalah city, sultanate of Oman. Transp. Res. Part. D. 2018, 59, 108-20.
13. Abdul-Wahab, S. A.; Fadlallah, S. O. A study of the effects of vehicle emissions on the atmosphere of Sultan Qaboos University in Oman. Atmos. Environ. 2014, 98, 158-67.
14. Broomandi, P. Modeling of air pollutants' dispersion by means of CALMET/CALPUFF (case study: district 7 in Tehran city). 2018.
15. Farrell, W.; Weichenthal, S.; Goldberg, M.; Valois, M. F.; Shekarrizfard, M.; Hatzopoulou, M. Near roadway air pollution across a spatially extensive road and cycling network. Environ. Pollut. 2016, 212, 498-507.
16. Zhang, Y.; Cai, M.; Wang, Z. Study on the distribution characteristics of PM2.5 on both sides of the elevated road in Guangzhou. Transp. Energy. Conserv. Environ. Prot. 2019, 15, 76-81.
17. Shekarrizfard, M.; Faghih-Imani, A.; Hatzopoulou, M. An examination of population exposure to traffic related air pollution: comparing spatially and temporally resolved estimates against long-term average exposures at the home location. Environ. Res. 2016, 147, 435-44.
18. Chen, Y.; Ebenstein, A.; Greenstone, M.; Li, H. Evidence on the impact of sustained exposure to air pollution on life expectancy from China's Huai River policy. Proc. Natl. Acad. Sci. USA. 2013, 110, 12936-41.
19. Fabisiak, J. P.; Jackson, E. M.; Brink, L. L.; Presto, A. A. A risk-based model to assess environmental justice and coronary heart disease burden from traffic-related air pollutants. Environ. Health. 2020, 19, 34.
20. Levy, I.; Karakis, I.; Berman, T.; Amitay, M.; Barnett-Itzhaki, Z. A hybrid model for evaluating exposure of the general population in Israel to air pollutants. Environ. Monit. Assess. 2019, 192, 4.
21. Guo, H.; Yang, S.; He, X.; Qiao, B.; Li, M. Study on the exposure intensity of air pollution in Zhengzhou city based on nighttime lighting. J. Henan. Polytech. Univ. 2019, 38, 81-8.
22. Zhang, X.; Hu, H. Risk assessment of exposure to PM2.5 in Beijing using multi-source data. J. Peking. Univ. 2018, 54, 1103-13.
23. Lim, S.; Kim, J.; Kim, T.; et al. Personal exposures to PM2.5 and their relationships with microenvironmental concentrations. Atmos. Environ. 2012, 47, 407-12.
24. Kousa, A.; Oglesby, L.; Koistinen, K.; Künzli, N.; Jantunen, M. Exposure chain of urban air PM2.5 - associations between ambient fixed site, residential outdoor, indoor, workplace and personal exposures in four European cities in the EXPOLIS-study. Atmos. Environ. 2002, 36, 3031-9.
25. Fu, Q.; Kan, H. Air pollution dispersion model and assessment of population weighted exposure. J. Environ. Health. 2004, 414-6.
26. Hoek, G.; Brunekreef, B.; Goldbohm, S.; Fischer, P.; van, B. P. A. Association between mortality and indicators of traffic-related air pollution in the Netherlands: a cohort study. Lancet 2002, 360, 1203-9.
27. Zou, B.; Pu, Q.; Luo, Y.; Tian, Y.; Zhang, W. Research on multi-indicator spatial zoning for urban PM2.5 pollution prevention and control. J. Saf. Environ. 2016, 16, 337-42.
28. Saraswat, A.; Kandlikar, M.; Brauer, M.; Srivastava, A. PM2.5 population exposure in New Delhi using a probabilistic simulation framework. Environ. Sci. Technol. 2016, 50, 3174-83.
29. Tang, R.; Tian, L.; Thach, T. Q.; et al. Integrating travel behavior with land use regression to estimate dynamic air pollution exposure in Hong Kong. Environ. Int. 2018, 113, 100-8.
30. Brusselaers, N.; Macharis, C.; Mommens, K. The health impact of freight transport-related air pollution on vulnerable population groups. Environ. Pollut. 2023, 329, 121555.
31. Xu, Y.; Yi, L.; Cabison, J.; et al. The impact of GPS-derived activity spaces on personal PM2.5 exposures in the MADRES cohort. Environ. Res. 2022, 214, 114029.
32. Guo, H.; Li, W.; Yao, F.; et al. Who are more exposed to PM2.5 pollution: a mobile phone data approach. Environ. Int. 2020, 143, 105821.
33. Lu, Y.; Habre, R. Impacts of distinct travel behaviors on potential air pollution exposure measurement error. Atmos. Environ. 2023, 306, 119820.
35. Martuzzi, M.; Mitis, F.; Forastiere, F. Inequalities, inequities, environmental justice in waste management and health. Eur. J. Public. Health. 2010, 20, 21-6.
36. Mitchell, G.; Norman, P.; Mullin, K. Who benefits from environmental policy? An environmental justice analysis of air quality change in Britain, 2001-2011. Environ. Res. Lett. 2015, 10, 105009.
37. Ministry of Ecology and Environment of China. Technical guidelines for environmental impact assessment - atmospheric environment. 2018. Available from: https://www.mee.gov.cn/ywgz/fgbz/bz/bzwb/other/pjjsdz/201808/t20180814_451386.shtml [Last accessed on 19 May 2025].
38. Luo, M.; Ding, T.; Chen, Q. Characteristics and simulation methods for photochemical transformation of nitrogen oxides. Environ. Eng. 2017, 35, 106-12.
39. Wang, H.; Luo, X.; Liu, C.; Fu, Q.; Yi, M. Spatio-temporal variation-induced group disparity of intra-urban NO2 exposure. Int. J. Environ. Res. Public. Health. 2022, 19, 5872.
40. Ta, N.; Wang, X.; Hu, L.; Liu, Z. Gender difference in commuting travel: a comparative study of suburban residents in Beijing and Shanghai. Transp. Policy. 2022, 28, 196-203.
41. Ministry of Ecology and Environment of China. Shanghai’s air pollution control efforts found lacking. Available from: https://www.mee.gov.cn/ywgz/zysthjbhdc/dcjl/202406/t20240613_1075708.shtml [Last accessed on 19 May 2025].
42. Feng, J.; Yang, Z. Factors influencing travel behavior of urban elderly people in Nanjing. J. Transp. Geogr. 2015, 34, 1598-608.
43. Pommier, M. Estimations of NOx emissions, NO2 lifetime and their temporal variation over three British urbanised regions in 2019 using TROPOMI NO2 observations. Environ. Sci. Atmos. 2023, 3, 408-21.
44. Demetillo, M. A. G.; Harkins, C.; Mcdonald, B. C.; Chodrow, P. S.; Sun, K.; Pusede, S. E. Space-based observational constraints on NO2 air pollution inequality from diesel traffic in major US cities. Geophys. Res. Lett. 2021, 48, e2021GL094333.
45. Mo, S.; Wang, Y.; Peng, M.; et al. Sex disparity in cognitive aging related to later-life exposure to ambient air pollution. Sci. Total. Environ. 2023, 886, 163980.
46. Hu, Y.; Yao, M.; Liu, Y.; Zhao, B. Personal exposure to ambient PM2.5, PM10, O), NO2, and SO2 for different populations in 31 Chinese provinces. Environ. Int. 2020, 144, 106018.
47. Kim, H.; Noh, J.; Noh, Y.; Oh, S. S.; Koh, S. B.; Kim, C. Gender difference in the effects of outdoor air pollution on cognitive function among elderly in Korea. Front. Public. Health. 2019, 7, 375.
48. Chau, C. K.; Tu, E. Y.; Chan, D. W. T.; Burnett, J. Estimating the total exposure to air pollutants for different population age groups in Hong Kong. Environ. Int. 2002, 27, 617-30.
49. Setton, E.; Keller, C. P.; Cloutier-Fisher, D.; et al. Gender differences in chronic exposure to traffic-related air pollution - A simulation study of working females and males. Prof. Geogr. 2010, 62, 66-83.
50. Sillman, S. The relation between ozone, NOx and hydrocarbons in urban and polluted rural environments. Atmos. Environ. 1999, 33, 1821-45.
52. Beidi, D. Temporal-spatial distribution characteristics of provincial industrial NOx emissions and driving factors in China from 2006 to 2013. Resour. Sci. 2016, 38, 93-8.
53. Chen, X. P.; Zhou, S. H.; Li, Q. P.; Zhan, W. Research on social differentiation of urban road network in Guangzhou: Gender differences of travel distribution based on trajectory data. Geogr. Res. 2021, 40, 1652-66.
54. Shen, Y. Segregation through space: a scope of the flow-based spatial interaction model. J. Transp. Geogr. 2019, 76, 10-23.
56. Tong, X.; Wang, Y. A gender comparative study of travel modes of urban residents. J. Shanxi. Univ. 2018, 45, 64-69.
57. Shanghai Statistics Bureau. Analysis on the development status and characteristics of female population in Shanghai. 2011. Available from: https://tjj.sh.gov.cn/tjfx/20111123/0014-236073.html [Last accessed on 19 May 2025].
58. Institute of Urban and Rural Construction and Transportation Development. Main results of the fifth comprehensive traffic survey in Shanghai. Traffic. Transp. 2015, 31, 15-18.
59. Huang, J.; Zhang, R.; Hu, G. Exploring the daily life circle of the elderly based on spatio-temporal behavior - Spatial recognition and feature analysis. Urban. Plan. Forum. 2019, 87-95.
Cite This Article
How to Cite
Download Citation
Export Citation File:
Type of Import
Tips on Downloading Citation
Citation Manager File Format
Type of Import
Direct Import: When the Direct Import option is selected (the default state), a dialogue box will give you the option to Save or Open the downloaded citation data. Choosing Open will either launch your citation manager or give you a choice of applications with which to use the metadata. The Save option saves the file locally for later use.
Indirect Import: When the Indirect Import option is selected, the metadata is displayed and may be copied and pasted as needed.
About This Article
Special Issue
Copyright

Data & Comments
Data
0


Comments
Comments must be written in English. Spam, offensive content, impersonation, and private information will not be permitted. If any comment is reported and identified as inappropriate content by OAE staff, the comment will be removed without notice. If you have any queries or need any help, please contact us at [email protected].