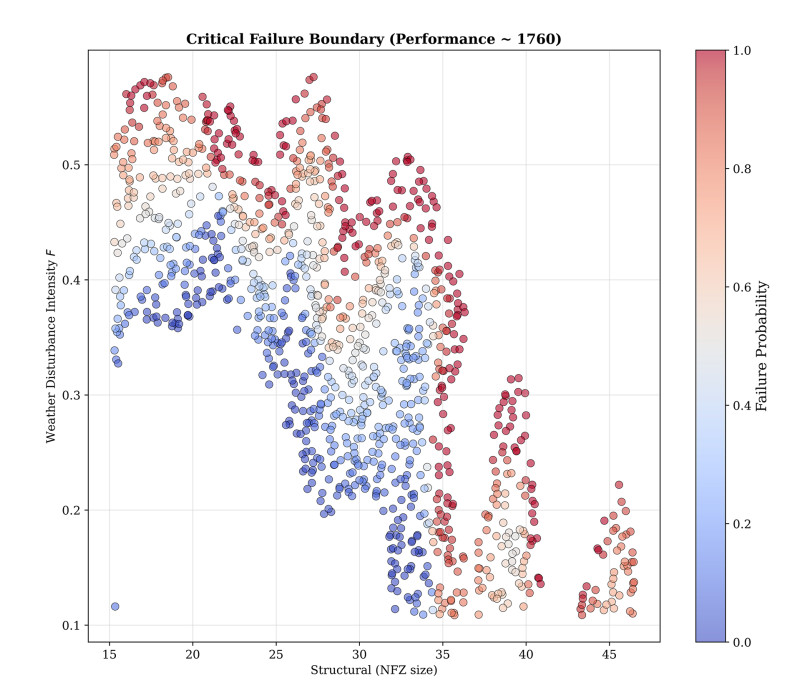
Figure 9. Critical failure boundary in the $$ (S, F) $$ parameter space. Each dot represents a disturbance scenario whose predicted performance lies within 5% of the failure threshold ($$ 1,672 < \hat{Q} < 1,848 $$); colour indicates the local failure probability (blue = safe, red = dangerous). The diagonal boundary band separates the safe region (lower-left: low $$ S $$, low $$ F $$) from the failure region (upper-right: high $$ S $$, high $$ F $$) and spans approximately 27% of the parameter space, reflecting prediction uncertainty.