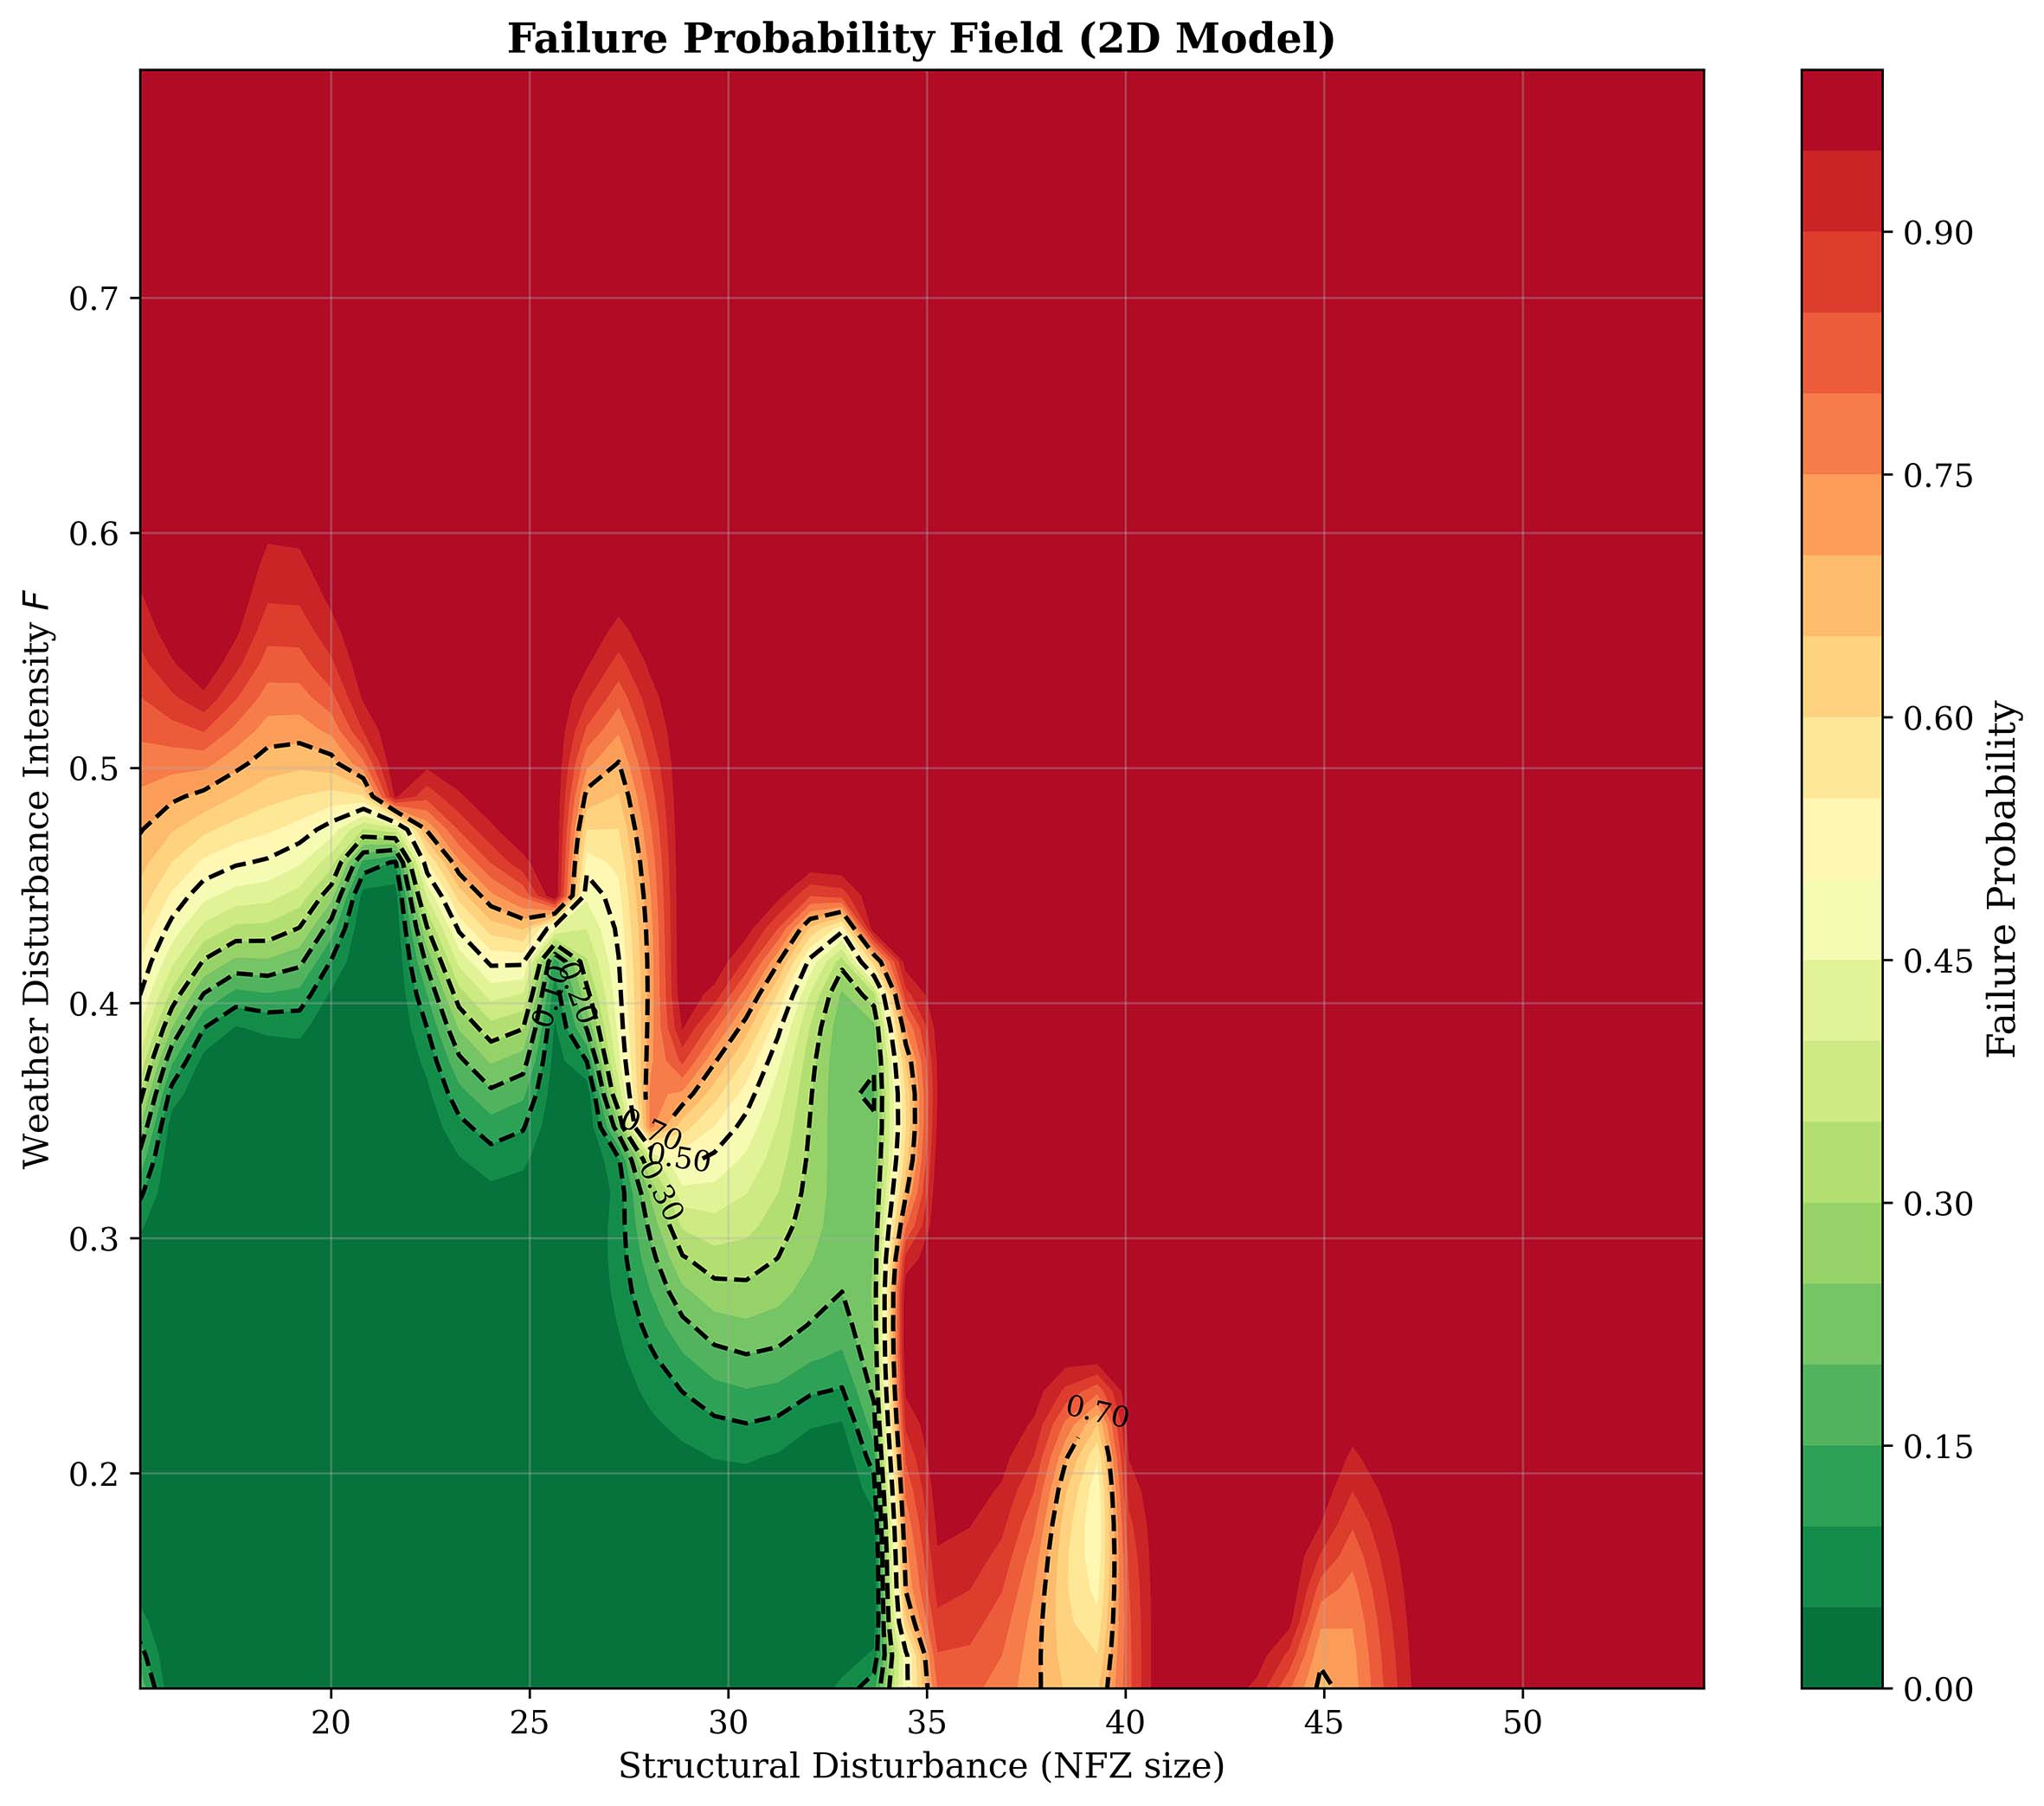
Figure 8. Failure probability field $$ P_f(S, F) $$ over the two-dimensional disturbance parameter space. The colour scale ranges from deep green ($$ P_f \leq 0.1 $$, safe) to deep red ($$ P_f > 0.9 $$, very high risk). The x-axis represents the structural disturbance intensity S and the y-axis represents the weather disturbance intensity F (higher F = more severe weather). The black dashed lines are iso-probability contours at $$ P_f $$ = 0.1, 0.2, 0.3, 0.5, and 0.7.