
Figure5

Kriging-based resilience assessment of low-altitude logistics networks under multiple operational disturbances

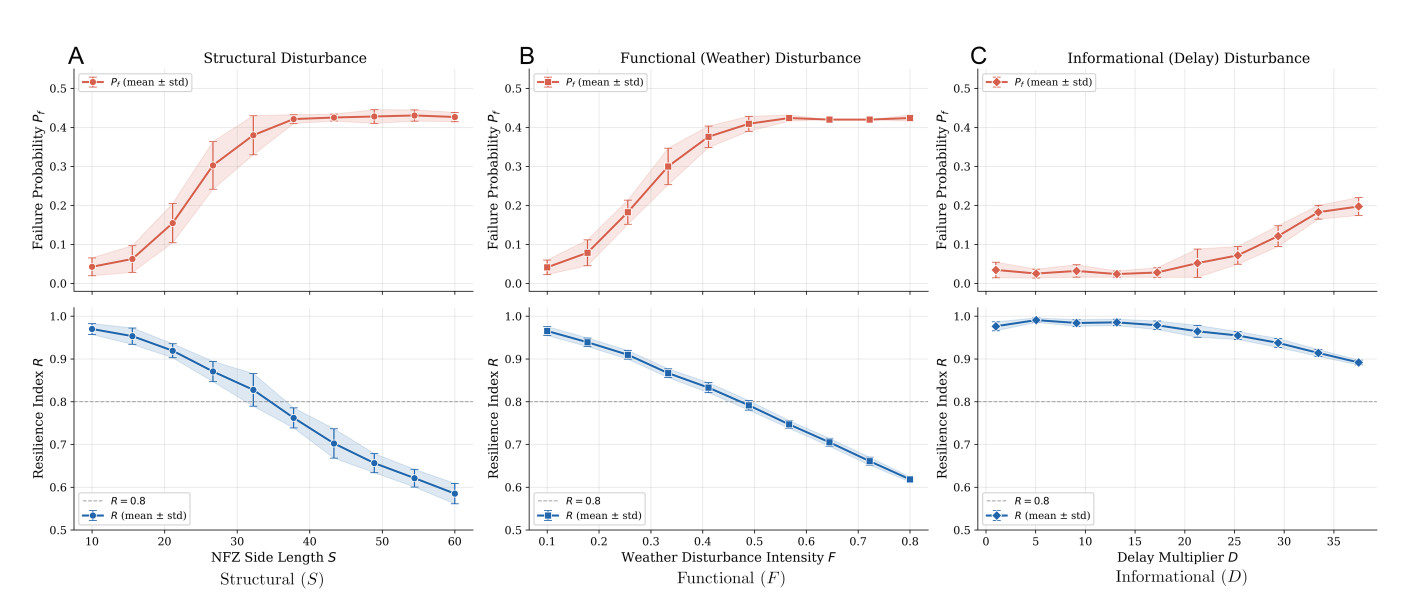
Figure 5. Single-disturbance degradation analysis. Each subfigure contains two vertically stacked panels: the upper panel shows the failure probability $$ P_f $$ and the lower panel shows the resilience index $$ R $$ (both reported as mean $$ \pm $$ standard deviation across 15 replications). The grey dashed line in the lower panel marks $$ R = 0.8 $$ as a reference. (A) Structural disturbance ($$ S \in [10, 60] $$): $$ P_f $$ rises sharply between $$ S = 20 $$ and $$ S = 35 $$ before saturating near 0.43; $$ R $$ decreases near-linearly from 0.97 to 0.59. (B) Functional disturbance ($$ F \in [0.1, 0.8] $$): $$ P_f $$ exhibits an S-shaped increase; $$ R $$ crosses the 0.8 reference near $$ F \approx 0.5 $$. (C) Informational disturbance ($$ D \in [1, 37.5] $$): $$ P_f $$ remains below 0.20 and $$ R $$ stays above 0.89 throughout, confirming its limited impact.

Complex Engineering Systems
ISSN 2770-6249 (Online)

Portico

All published articles are preserved here permanently:

https://www.portico.org/publishers/oae/


Portico

All published articles are preserved here permanently:

https://www.portico.org/publishers/oae/