
Figure4

Kriging-based resilience assessment of low-altitude logistics networks under multiple operational disturbances

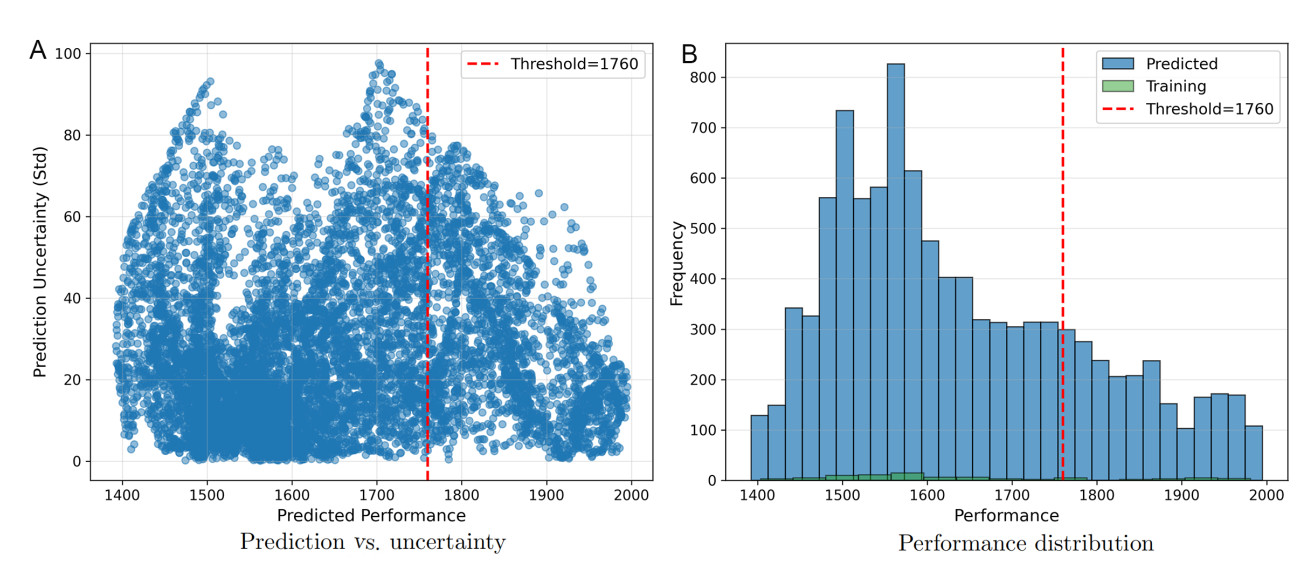
Figure 4. Kriging model uncertainty analysis based on 10,000 test scenarios. (A) Predicted performance $$ \hat{\mu} $$ vs. predictive standard deviation $$ \hat{\sigma} $$. (B) Performance distribution of test predictions (blue) and 80 training samples (green). The red dashed line marks the failure threshold $$ Q_{\mathrm{th}} = 1,760 $$.

Complex Engineering Systems
ISSN 2770-6249 (Online)

Portico

All published articles are preserved here permanently:

https://www.portico.org/publishers/oae/


Portico

All published articles are preserved here permanently:

https://www.portico.org/publishers/oae/