
Figure2

Kriging-based resilience assessment of low-altitude logistics networks under multiple operational disturbances

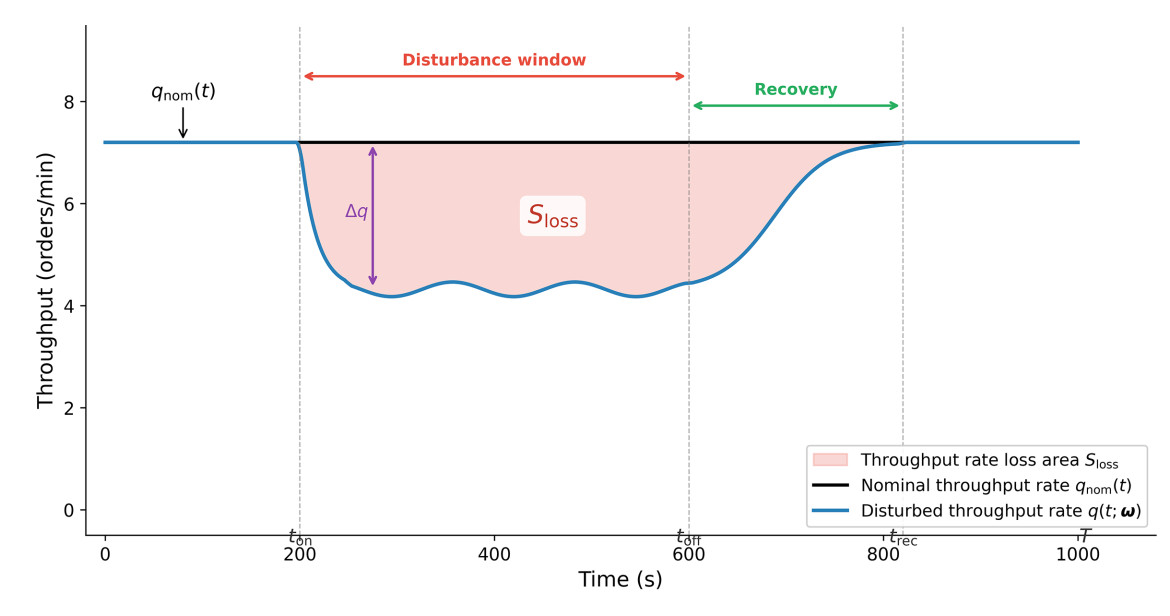
Figure 2. Schematic illustration of the resilience triangle. The shaded area between the nominal throughput rate curve $$ q_{\mathrm{nom}}(t) $$ and the disturbed throughput rate curve $$ q(t;\boldsymbol{\omega}) $$ represents the loss area $$ S_{\mathrm{loss}} $$. The resilience index $$ R = 1 - S_{\mathrm{loss}}/S_0 $$ captures both the degradation depth and the recovery dynamics.

Complex Engineering Systems
ISSN 2770-6249 (Online)

Portico

All published articles are preserved here permanently:

https://www.portico.org/publishers/oae/


Portico

All published articles are preserved here permanently:

https://www.portico.org/publishers/oae/