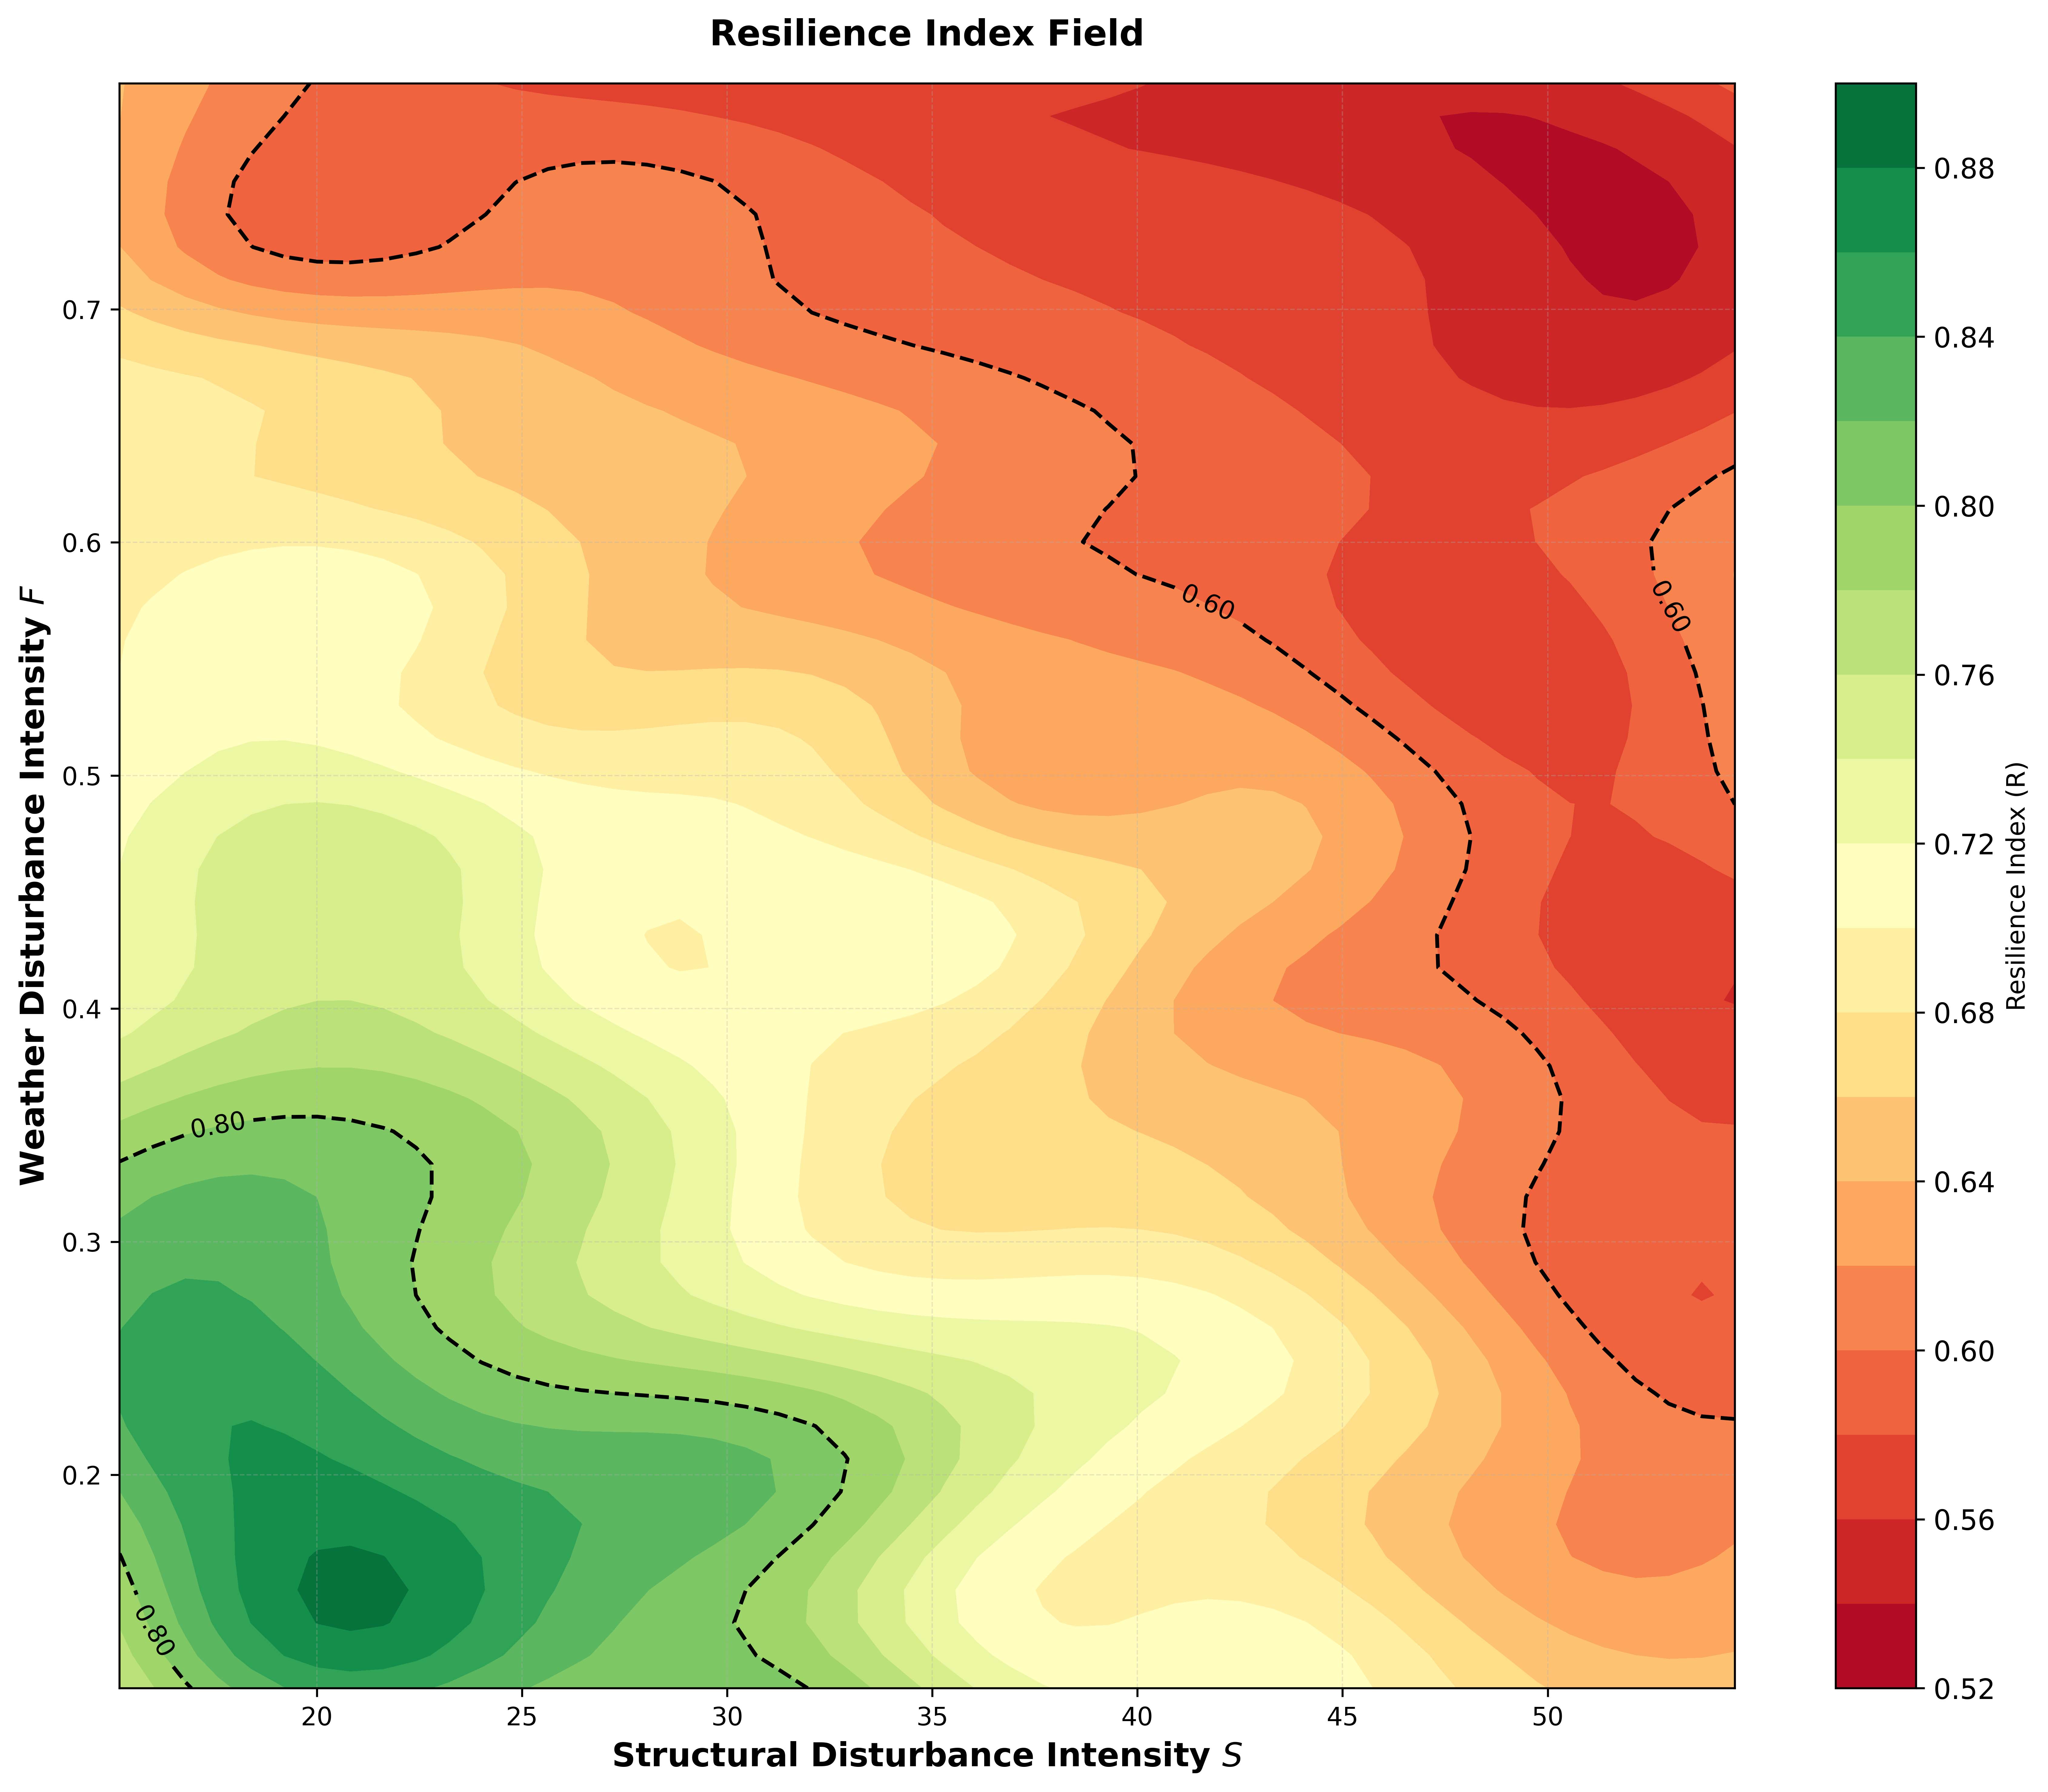
Figure 10. Resilience surface predicted by Kriging$$ _R $$ over the $$ (S, F) $$ disturbance parameter space. The colour scale represents the resilience triangle index $$ R $$ in Eq. (13). Three zones are delineated: high-resilience ($$ R \geq 0.8 $$, 10.9%), medium-resilience ($$ 0.6 \leq R < 0.8 $$, 62.8%), and low-resilience ($$ R < 0.6 $$, 26.4%). The contour lines mark $$ R = 0.8 $$ and $$ R = 0.6 $$.