
Figure7
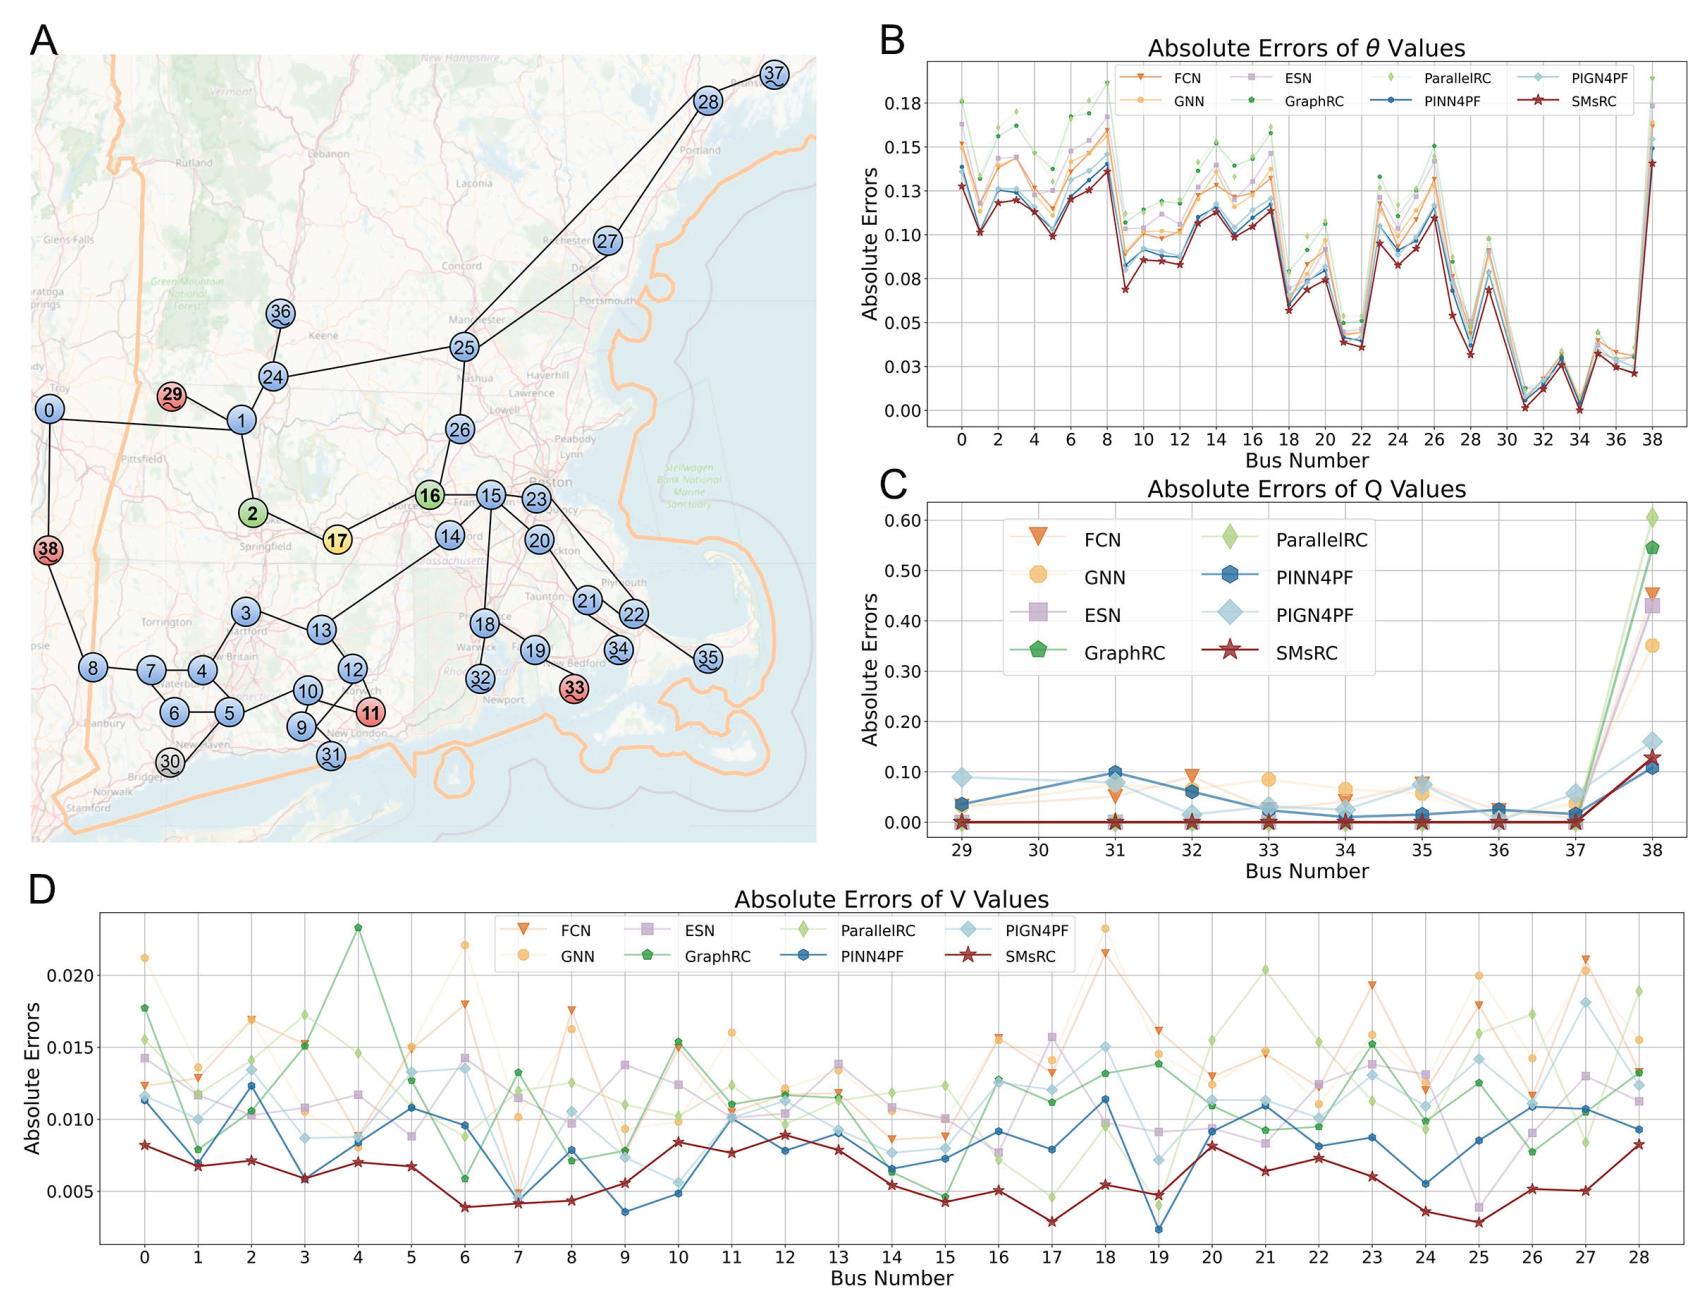
Figure 7. Case analysis of IEEE39 system located in New England. (A) The geographical distribution and connection relationships of 39 buses (Map data ©OpenStreetMap contributors). Green nodes are the direct neighbors of bus 17, and red nodes are the higher-order neighbors of bus 17 identified by SMsRC. (B-D) denote the absolute errors between the model outputs and the true system values for


