Figure4

A spatial multi-scale reservoir computing framework for power flow analysis in power grids

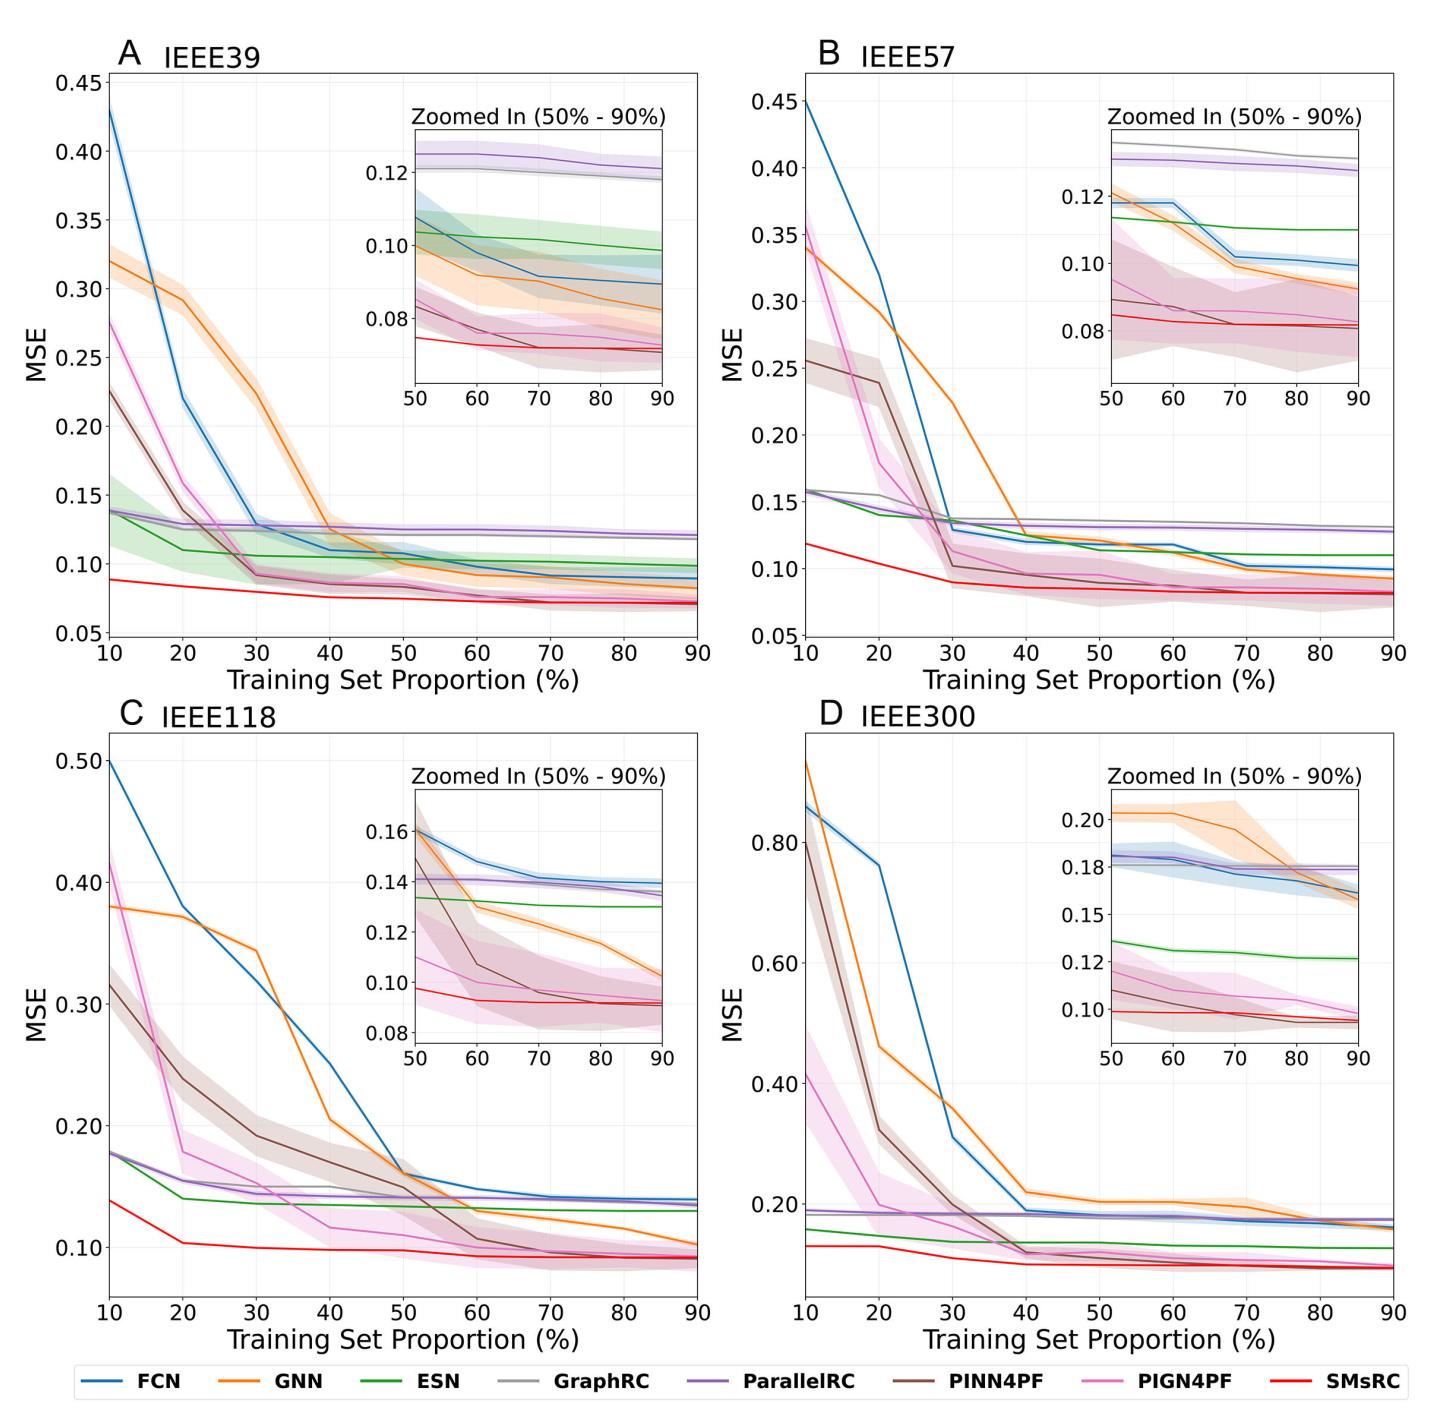
Figure 4. Comparison of MSE performance across four power grids. (A) IEEE39 bus system. (B) IEEE57 bus system. (C) IEEE118 bus system. (D) IEEE300 bus system. Shaded areas indicate the Standard Deviation (STD). Insets show magnified results for training set ratios of 50%–90% for clearer presentation.

Complex Engineering Systems
ISSN 2770-6249 (Online)

Portico

All published articles are preserved here permanently:

https://www.portico.org/publishers/oae/

Portico

All published articles are preserved here permanently:

https://www.portico.org/publishers/oae/