

Figure9
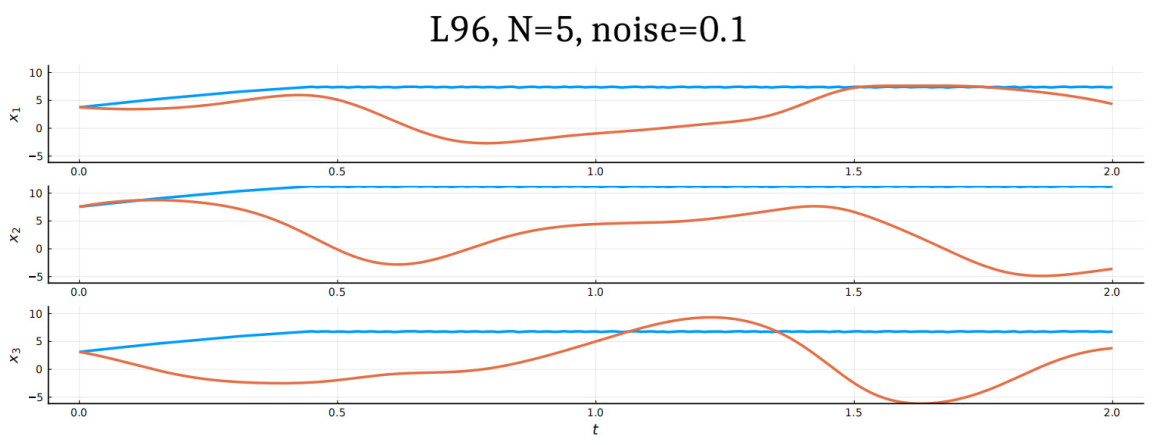
Figure 9. Reconstruction of the Lorenz 96 system with 5 cells. This figure offers a closer look at the graphs of Figure 8. The trajectories corresponding to the true and reconstructed drifts are in blue and orange, respectively.
Figure 9. Reconstruction of the Lorenz 96 system with 5 cells. This figure offers a closer look at the graphs of Figure 8. The trajectories corresponding to the true and reconstructed drifts are in blue and orange, respectively.


All published articles are preserved here permanently:
https://www.portico.org/publishers/oae/

