Figure3

A probabilistic approach to drift estimation from stochastic data

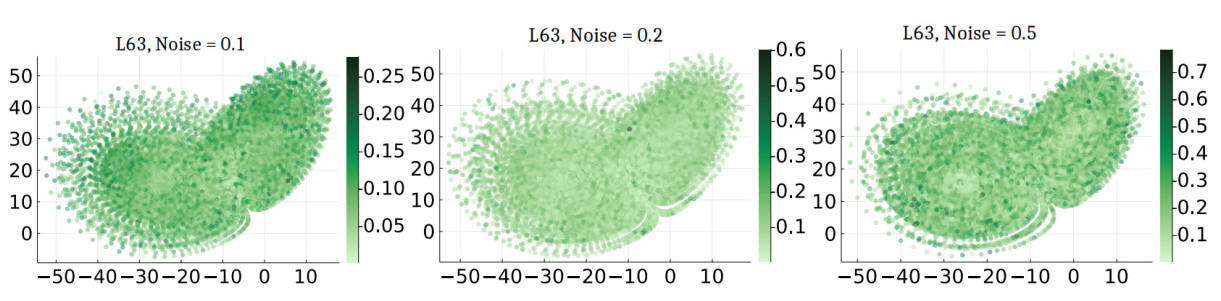
Figure 3. Estimating the drift in a stochastic Lorenz 63 model. The three figures present a heatmap of the pointwise error in computing the drift (26). The colored area of the phase space represents the support of the stationary measure of the underlying SDE.

Complex Engineering Systems
ISSN 2770-6249 (Online)

Portico

All published articles are preserved here permanently:

https://www.portico.org/publishers/oae/

Portico

All published articles are preserved here permanently:

https://www.portico.org/publishers/oae/