

fig18
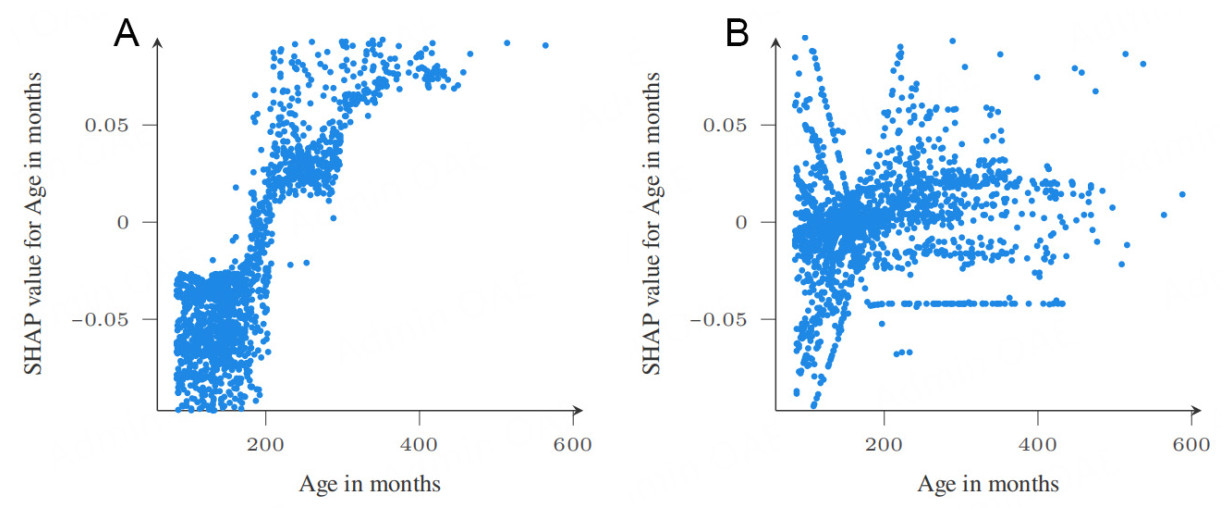
Figure 18. Age in months dependence plot RF - HFRBM comparison for all folds. (A) RF age in months SHAP dependence plot; (B) FRBM age in months SHAP dependence plot.
Figure 18. Age in months dependence plot RF - HFRBM comparison for all folds. (A) RF age in months SHAP dependence plot; (B) FRBM age in months SHAP dependence plot.


All published articles are preserved here permanently:
https://www.portico.org/publishers/oae/

