

fig15
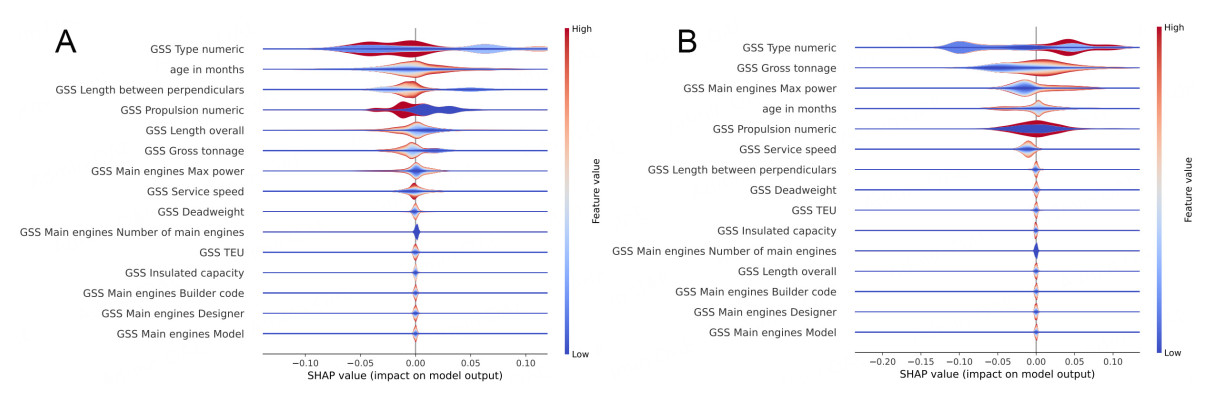
Figure 15. HFRBM violin plot for folds 0 and 1. For each test point assessed, the impact of the individual features from SHAP, and the value of the feature from the data set are given. The violin plot stacks these points, grouping those with the same SHAP value, and coloring the grouped points by the feature value. In this way, an understanding of how each feature affects the model globally is gained. (A) HFRBM violin plot for fold 0; (B) HFRBM violin plot for fold 1.


